Primary Vision
  • HOME
  • ABOUT US
    • ABOUT US
    • PRIMARY VISION AI INNOVATIONS
  • RESEARCH
    • INSIGHTS & ARTICLES
    • FREE ARTICLES
  • EVENTS
  • PRESS
  • SUPPORT
  • FAQ
  • LATEST NEWS
  • LOGIN
  • SIGN UP!
    • FRAC SPREAD COUNT SIGN-UP!
    • ENTERPRISE SUBSCRIPTION PLAN SIGN UP!
  • HOME
  • ABOUT US
    • ABOUT US
    • PRIMARY VISION AI INNOVATIONS
  • RESEARCH
    • INSIGHTS & ARTICLES
    • FREE ARTICLES
  • EVENTS
  • PRESS
  • SUPPORT
  • FAQ
  • LATEST NEWS
  • LOGIN
  • SIGN UP!
    • FRAC SPREAD COUNT SIGN-UP!
    • ENTERPRISE SUBSCRIPTION PLAN SIGN UP!
No Result
View All Result
Primary Vision
Home Market Trends

Halliburton Part 2: Estimates And Valuation

Avik Chowdhury by Avik Chowdhury
March 8, 2022
in Market Trends
0
Halliburton Part 2: Estimates And Valuation

  • Revenue estimates are steady in the next few years
  • EBITDA can decline marginally in NTM 2022 but will recover after that
  • The stock is reasonably valued at the current level

In Part 1 of this article, we discussed Halliburton’s outlook, performance, and financial condition. In this part, we will discuss more.

Linear Regression Based Forecast

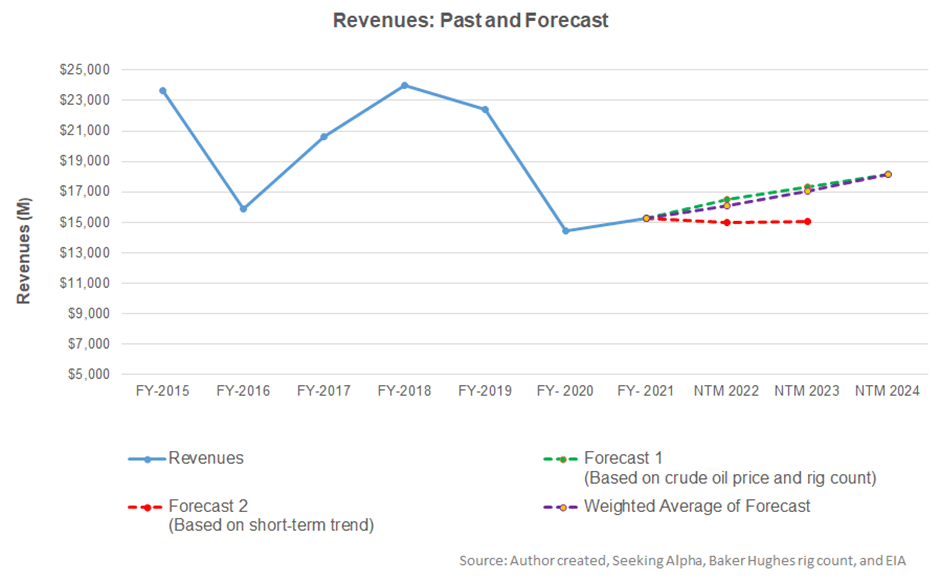
Based on a regression equation among the crude oil price, global rig count, and HAL’s reported revenues for the past seven years and the previous eight-quarters, revenues will increase steadily in the next three years.

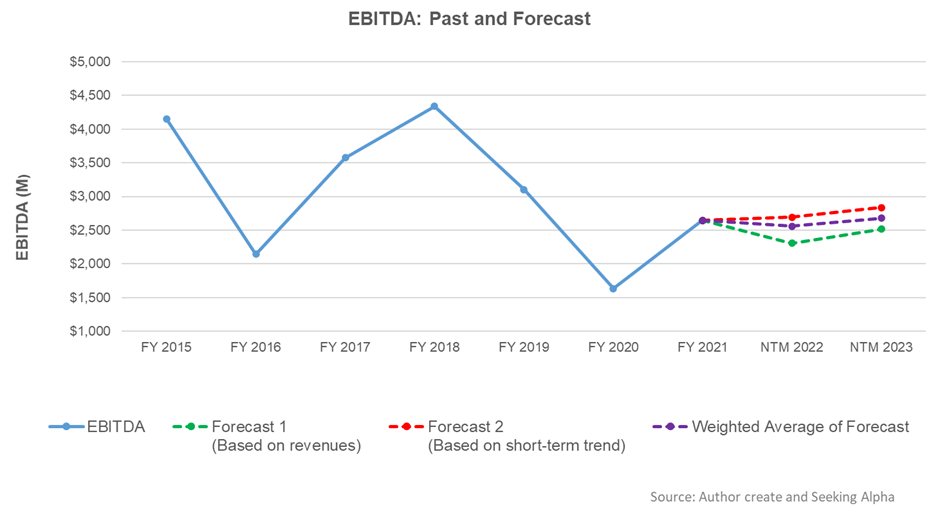
Based on the regression model using the average forecast revenues, the company’s EBITDA is expected to decrease moderately in the next 12 months (NTM 2022). However, from NTM 2023, it can start recovering.

Target Price And Relative Valuation

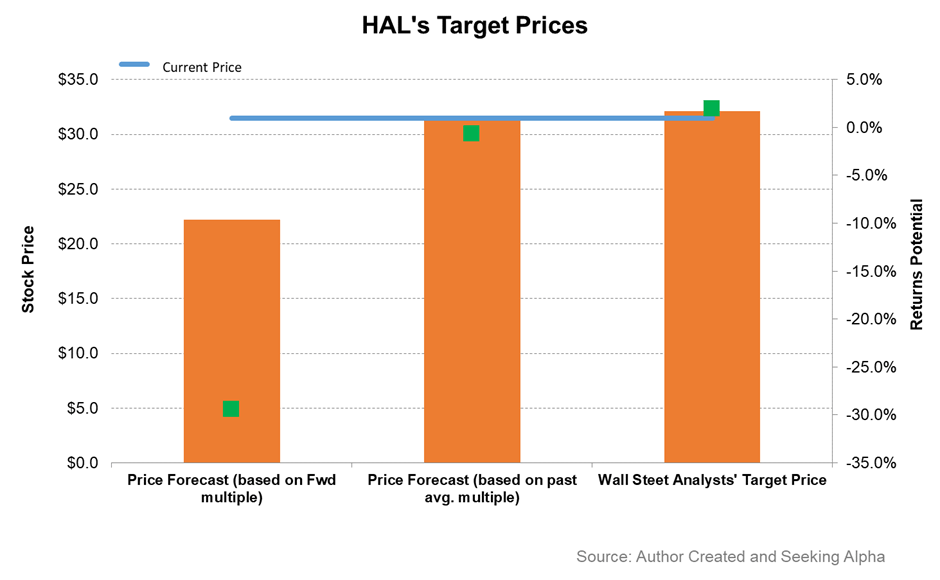
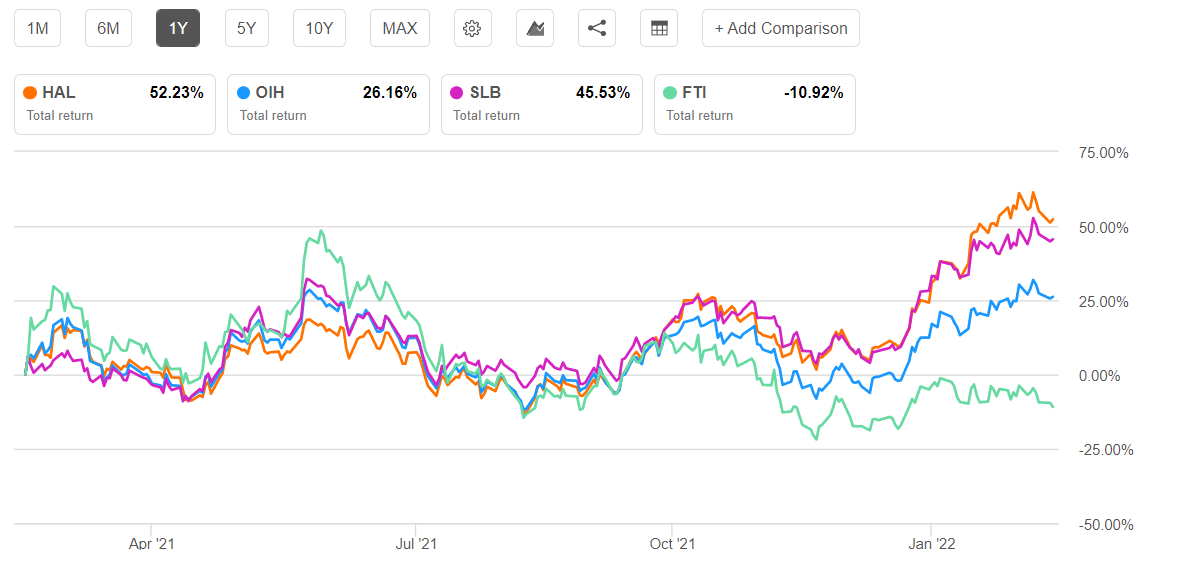
Returns potential using HAL’s forward EV/EBITDA multiple (10.2x) is significantly lower (29% downside) compared to returns potential using the past average multiple (1% upside). The Wall Street analysts have slightly higher return expectations (2% upside).

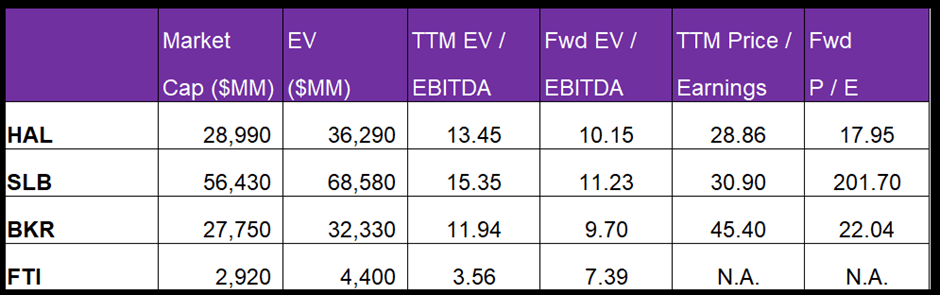
Halliburton’s forward EV-to-EBITDA multiple contraction versus the adjusted trailing 12-month EV/EBITDA is steeper because sell-side analysts expect HAL’s EBITDA to increase more sharply than its peers in the next four quarters. This typically results in a higher EV/EBITDA multiple compared to peers. The stock’s EV/EBITDA multiple (13.5x) is higher than its peers’ (SLB, BHGE, and FTI) average of 10.3x. So, the stock is reasonably valued, with a moderate downside bias, versus its peers at this level.

What’s The Take On HAL?

Halliburton reckons that several years of underinvestment in new production and the structural weakness in wellbore investment will start to bear fruit for the company in the medium term. The upstream operators’ capex can increase by the mid-teens in 2022, although some international geographies (Africa and Europe) will face headwinds. Seeing the growth prospect of the short-cycle products, it strategically reallocates assets to improve utilization and returns.

However, high input costs will continue to affect its North American performance in 2022 adversely. So, it plans to maximize operating margin by reducing costs, translating into cash flow maximization in this region. Pricing for the fracturing fleets is getting strong traction in the low-emissions equipment and Tier 4 diesel fleets. It has also been innovating in the digital space. For example, the iStar intelligent formation evaluation platform and the iCruise system have been its latest innovations.

HAL is deleveraging the balance sheet by retiring $0.6 billion in debt in February. Although efficient working capital management will keep cash flow steady, it may increase capex by 25% versus the previous year. The stock is reasonably valued versus its peers at this level. Nonetheless, given the robust medium-term drivers, investors might want to hold it for medium to long-term gains.

Previous Post

Halliburton Part 1: HAL Has Forceful Drivers; But Steep Pricing Weighs On Valuation

Next Post

Year-Over-Year Oil Data (USA)

Related Posts

Halliburton’s Perspective in Q1: KEY Takeaways
Market Trends

Halliburton’s Perspective in Q1: KEY Takeaways

May 16, 2025
STEP Energy Services: Q1 TAKE THREE
Market Trends

STEP Energy Services: Q1 TAKE THREE

May 15, 2025
Market Sentiment Tracker: Demand Holds, Cracks Widen
Market Trends

Market Sentiment Tracker: Demand Holds, Cracks Widen

May 14, 2025
Monday Macro View: What is the connection between Frac Job Count and OPEC’s production? Enterprise Subscribers
Market Trends

Monday Macro View: What is the connection between Frac Job Count and OPEC’s production? Enterprise Subscribers

May 12, 2025
Liberty Energy’s Perspective in Q1: KEY Takeaways
Market Trends

Liberty Energy’s Perspective in Q1: KEY Takeaways

May 12, 2025
KLX Energy Services: Q1 TAKE THREE
Market Trends

KLX Energy Services: Q1 TAKE THREE

May 9, 2025
Next Post
Year-Over-Year Oil Data (USA)

Year-Over-Year Oil Data (USA)

Please login to join discussion

Recent News

Halliburton’s Perspective in Q1: KEY Takeaways

Halliburton’s Perspective in Q1: KEY Takeaways

May 16, 2025
STEP Energy Services: Q1 TAKE THREE

STEP Energy Services: Q1 TAKE THREE

May 15, 2025
FREE READ: Oil Markets Trying to find direction

FREE READ: Oil Markets Trying to find direction

May 14, 2025
Market Sentiment Tracker: Demand Holds, Cracks Widen

Market Sentiment Tracker: Demand Holds, Cracks Widen

May 14, 2025
Monday Macro View: What is the connection between Frac Job Count and OPEC’s production? Enterprise Subscribers

Monday Macro View: What is the connection between Frac Job Count and OPEC’s production? Enterprise Subscribers

May 12, 2025
Primary Vision

Established in 2011, we are renowned for our expert frac data and analytics, providing a rich array of unique indicators and industry commentary.

CONTACT

+1-713-554-4977
info@primaryvision.co

SOCIAL NETWORKS

POLICIES

Privacy Policy
Terms of Use

PARTNERS

Amazon Web Services

TRUSTED SITES

Logo

Logo

RECENT NEWS

Halliburton’s Perspective in Q1: KEY Takeaways

Halliburton’s Perspective in Q1: KEY Takeaways

May 16, 2025
STEP Energy Services: Q1 TAKE THREE

STEP Energy Services: Q1 TAKE THREE

May 15, 2025
FREE READ: Oil Markets Trying to find direction

FREE READ: Oil Markets Trying to find direction

May 14, 2025
Market Sentiment Tracker: Demand Holds, Cracks Widen

Market Sentiment Tracker: Demand Holds, Cracks Widen

May 14, 2025
Monday Macro View: What is the connection between Frac Job Count and OPEC’s production? Enterprise Subscribers

Monday Macro View: What is the connection between Frac Job Count and OPEC’s production? Enterprise Subscribers

May 12, 2025
  • HOME
  • ABOUT US
  • RESEARCH
  • EVENTS
  • PRESS
  • SUPPORT
  • FAQ
  • LATEST NEWS
  • LOGIN
  • SIGN UP!

© 2025 Primary Vision. All rights reserved.

  • HOME
  • ABOUT US
    • ABOUT US
    • PRIMARY VISION AI INNOVATIONS
  • RESEARCH
    • INSIGHTS & ARTICLES
    • FREE ARTICLES
  • EVENTS
  • PRESS
  • SUPPORT
  • FAQ
  • LATEST NEWS
  • LOGIN
  • SIGN UP!
    • FRAC SPREAD COUNT SIGN-UP!
    • ENTERPRISE SUBSCRIPTION PLAN SIGN UP!

© 2025 Primary Vision. All rights reserved.