- Calfrac’s frac fleet count in the US stepped up in early 2022 but is unlikely to increase much from here
- High reactivation costs and commodity price inflation can hurt the operating margin in the short to medium term
- Suspension of investment in Russia can hurt the topline and operating profit
- Calfrac’s leverage is high, but robust liquidity reduces the risk factors
Trends And Company Outlook

Calfrac’s outlook is shaped by a few pressing issues: increased demand for on-location horsepower, supply chain constraints, and labor shortage. While falling idle capacity in the fracking market helps improve pricing, the supply chain disruption and commodity price inflation will keep the flow of incremental fleets limited.
In the US, the company witnessed a relatively slow activity in Q4 but has ramped up in 2022. While it exited 2021 with four fleets, it reached a count of eight by January. By Q2, it plans to add another fleet. However, it may not add anymore before the end of the year. With demand rising, it aims to achieve full utilization and reactivate idle equipment, which will lead to a higher return on the additional investment. The management sees opportunities to recover the additional cost brought about by higher input costs on the pricing front. Although the net effect is not apparent, the company’s operating profitability will likely be positively impacted by the current trend.
Challenges And Opportunities

Calfrac is likely to continue with the four fracturing fleets in Canada but has added another coiled tubing fleet in Q1. The Western Canadian fracturing market will remain tight as labor shortage will continue to weigh in on frac supply. The company managed to pass through the cost inflation with higher prices. It may take further similar actions in 2022. Investors may note that oilfield services have a longer duration in Canada than in the US and, therefore, saw more modest price reductions during times of recession. Outside of these regions, Calfrac expects activities in the Vaca Muerta shale in Argentina to remain steady, although inclement weather may cause activity disruption.
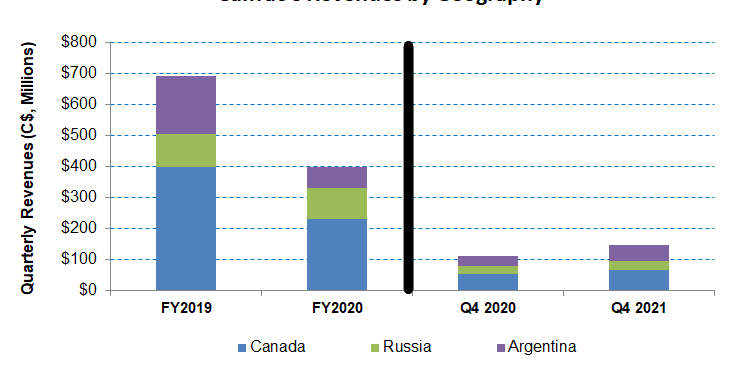
The most negatively affected region for the company would be Russia, where the company has recently decided to suspend any investments. The company canceled parts and equipment shipments bound for Russia following the Ukraine invasion. If the conflict lingers, the company’s topline can take a significant cut. Investors may note that Russia accounted for 11% of the company’s Q4 2021 revenues.
Rigs And Frac Spread Count

Year-to-date, the US active frac spread count went up by 14%, according to Primary Vision’s estimates. From December 2021 to February 2022, the drilled and completed well count in the Permian were higher (5% and 6% up, respectively), while the drilled but uncompleted (or DUC) wells declined by 11%. Many shales saw higher frac spread count addition during this period. In comparison, the frac spread count in Alberta (Canada) fell steeply by 2021.
As of now, the US rig count has gone up by 14% in Q1. The rig count in Canada has gone up by 55%, although it is still down by 14% compared to a year ago. The renewed thrust over increasing production following the ban on Russian oil can tighten energy supply while demand grows, leading to a sustained level of high crude oil prices
Canada: Performance And Outlook

Year-over-year, Calfrac’s revenues from Canada increased by 26% in Q4 2021 due primarily to an increase in its marketed asset base. It saw a marketed large fracturing fleet going up to four, while a fifth coiled tubing unit was activated. However, higher reactivation costs related to the fracturing fleet and coil tubing units also added to the cost. On top of that, the expiration of the wage subsidies and lower utilization affected the margin adversely. As a result, the operating profit margin decreased significantly, by 1,000 basis points, to 7%.
Analyzing Recent Performance in US and Argentina
Calfrac’s revenues from the US increased by 64% in Q4 2021 compared to a year ago. The benefit of pricing increases helped improve the result in this region. Plus, the topline was boosted by higher equipment utilization. The operating profit margin remained steady year-over-year but was substantially lower than in Canada (1.9%). Its revenues from Argentina made significant progress in Q4, mainly due to the company’s cementing operation growth. It also witnessed robust equipment utilization in the Vaca Muerta shale play. Such strong performance is expected to roll over for the rest of 2022 in Argentina.
Cash Flows and Balance Sheet
Calfrac’s cash flow from operations (or CFO) deteriorated steeply and turned negative in FY2021 compared to a positive CFO a year ago. Although revenues increased in this period, a much higher working capital requirement following the activity increase led to the fall in CFO. Also, Capex increased, leading to an even steeper fall in free cash flow in FY2021 versus a year ago.
Calfrac’s debt-to-equity ratio (1.2x) is lower than some of its peers (e.g., Nabors Industries or NBR), while some of its peers (Trican Well Services (TOLWF) have no debt. Anticipating a possible working capital gap, it recently secured a bridge financing loan to provide the necessary liquidity to fund the additional working capital requirements in 2022. As of December 31, 2021, its liquidity (cash plus investments plus availability of borrowings under the revolving credit facility) was $191 million.
Learn about Calfrac’s revenue and EBITDA estimates, relative valuation, and target price in Part 2 of the article.


