Before we start to talk about some of the important developments in energy markets around the world, I’d like the readers to check out this week’s ECON and EIA show. Mark has spoken about so many international issues and relevant matters that it will be useful for the readers to make sense of what is happening around us. He talks about the problems is Chinese economy that seems to be getting serious. Also, Europe is in focus and he mentions how Germany’s problems continue to grow alongwith Eurozone’s inflation. This and much more. Check out the show here.
Now onto the energy markets where, interestingly, the overall sentiment has undergone a shift. From ultra bullish where JP Morgan and others were calling for a $200 oil, to bearish as CITI bank and others see the possibility of a $60 oil per barrel. This bearishness, however, has not taken hold in the gas markets where prices remain elevated – despite shedding some gains. Recessionary fears seem to dominate especially WTI fell below $90 while Brent benchmark is well below $100. As such the millionair dollar question is where are prices headed in the next few weeks? I’ll talk about this in the end.
OPEC+ meeting was the talk of the town. But the outcome of that meeting couldn’t register any significant reaction as the group was only able to increase the output by 100,000 bpd equivalent to 86 seconds of global oil demand. This also undermined Biden’s recent visit to Saudi Arabia. The de facto leader can increase production to 12 mbpd and is working on the further add a million bpd of capacity to it. Many analysts are of the view that this might be difficult to achieve in reality and the country might only be able to produce 11.5 mbpd maximum – I disagree. Saudi Arabia is currently producing 10.78 mbpd.
Another reason that they will not increase production is current recessionary fears and impending or expected demand destruction. Take for example U.S. gasoline prices that have fallen for consecutie 50 session. The recent Summer Driving Season has been one of the weakest, indeed, as Irina Slave notes for Oilprice.com. Rise in inflation partly explains this reduction in demand as according to a report mentioned in the article the gasoline demand in U.S. fell to 8.59 mbpd, 7.6 percent drop on YoY basis and the lowest levels since 1997 (excluding lockdowns in 2020).
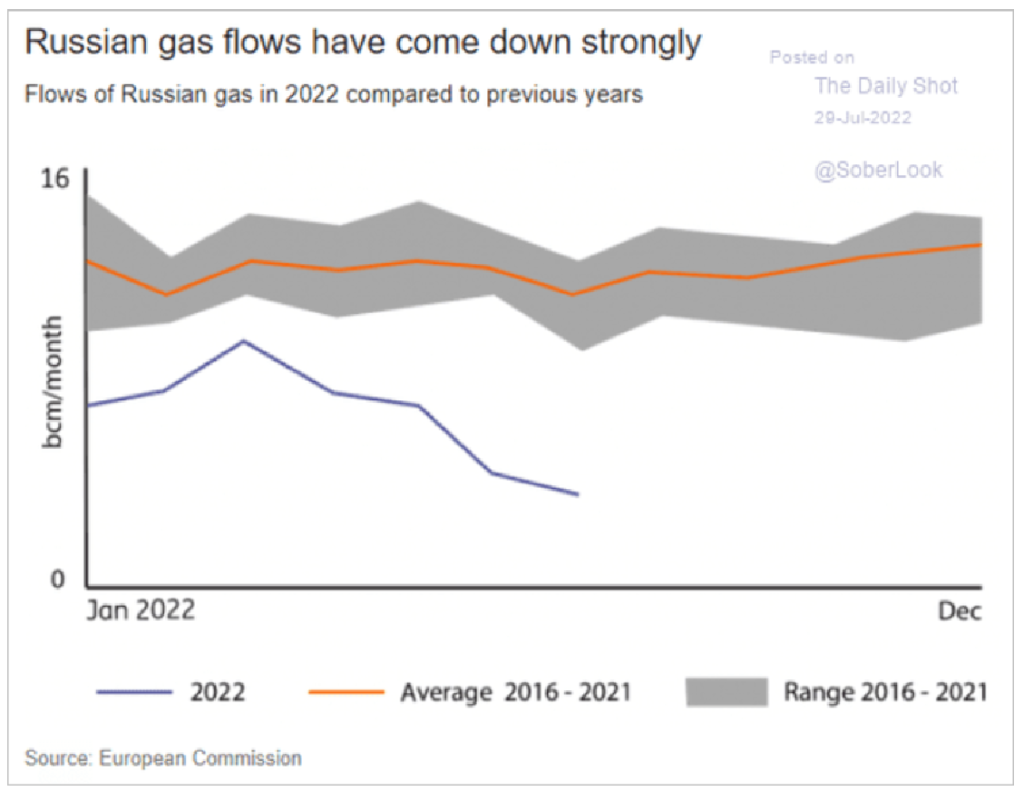
In other news, EU has been successful in reducing its gas dependence from Russia by 50 percent but this comes at a cost. ““We have already managed to cope with an overall reduction in the share of Russian gas imports from 40% at the beginning of the year to around 20% today, principally by buying more LNG, whose share of gas usage has doubled from 19% to 37%,” per an article that associates the quote to a top EU official. Reuters recently reported that it will cost more than 50 bn Euros for European countries to build their gas inventories above 80 percent as the winters near.
Crude oil traders have also been dumping their positions, selling oil. If prices remain below $89 for a prolonged period of time, we might see sellers gearing up for another round of selling their positions and prices can drop to $82 with next support at $76 and $66. Mostly, it will depend on the global economic outlook which seems concerning with Fed, BoE and ECB’s rate hikes.
Lastly, the recently released World LNG report by IGU is very useful and I’d recommend we read the summary of it. Why? Because as gas supplies to Europe are cut, LNG is the next big thing. The mechanisms of this shift will also effect the developing countries very seriously.
Here are some tidbits from it: Global LNG trade saw an increase of 4.5 percent from 2020 to 2021 while the pricing trends shifting completely. As we read this the prices are at its highest and may remain so in future. About 6.9 million tonnes per annum of new capacity was added in 2021. The global LNG shipping also registered some additions making the total active vessels at 641, representing a 10 percent growth in fleet size.
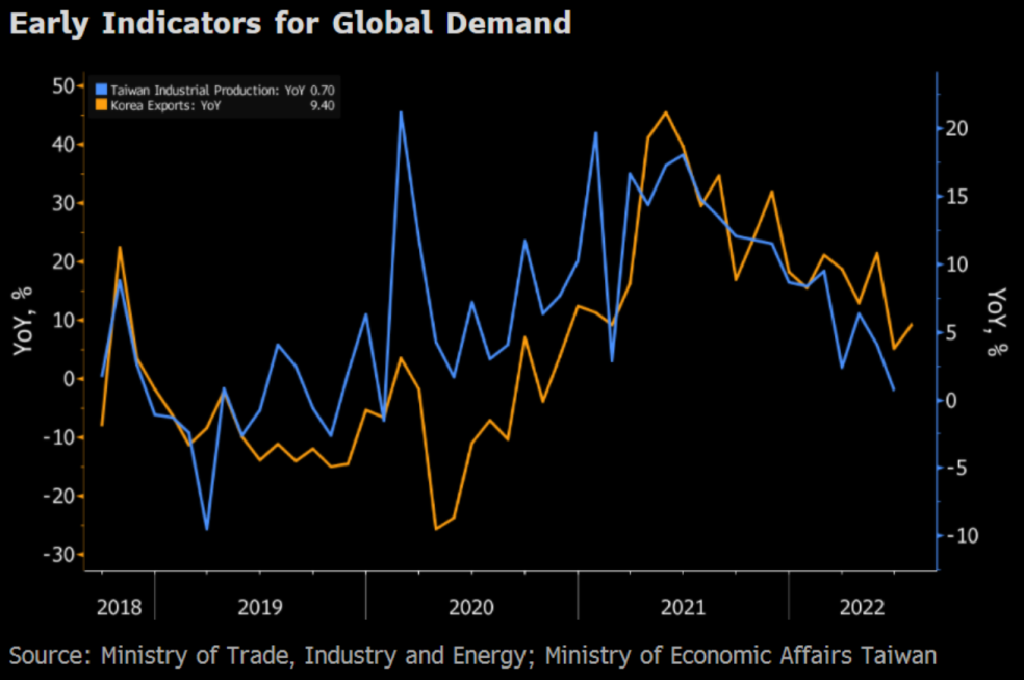
Before leaving. Here are some interesting charts from our recent show. Mark has made me addicted to charts too!

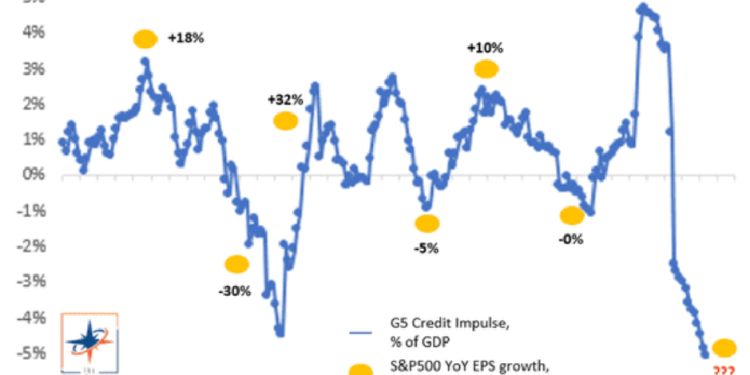
Now the following one is concerning:

This shows how Russian gas flows have changed recently:

Happy Reading and Sunday!


