Primary Vision
  • HOME
  • ABOUT US
    • ABOUT US
    • PRIMARY VISION AI INNOVATIONS
  • RESEARCH
    • INSIGHTS & ARTICLES
    • FREE ARTICLES
  • EVENTS
  • PRESS
  • SUPPORT
  • FAQ
  • LATEST NEWS
  • LOGIN
  • SIGN UP!
    • FRAC SPREAD COUNT SIGN-UP!
    • ENTERPRISE SUBSCRIPTION PLAN SIGN UP!
  • HOME
  • ABOUT US
    • ABOUT US
    • PRIMARY VISION AI INNOVATIONS
  • RESEARCH
    • INSIGHTS & ARTICLES
    • FREE ARTICLES
  • EVENTS
  • PRESS
  • SUPPORT
  • FAQ
  • LATEST NEWS
  • LOGIN
  • SIGN UP!
    • FRAC SPREAD COUNT SIGN-UP!
    • ENTERPRISE SUBSCRIPTION PLAN SIGN UP!
No Result
View All Result
Primary Vision
Home Market Trends

Schlumberger Part 2: Estimates And Relative Valuation

Avik Chowdhury by Avik Chowdhury
October 25, 2022
in Market Trends
0
Schlumberger Part 2: Estimates And Relative Valuation

  • Our regression model suggests Schlumberger’s revenue estimate is upward trending in NTM 2023 but may slow down considerably after that
  • EBITDA will also increase in the next couple of years
  • The stock is reasonably valued at the current level

Part 1 of this article discussed Schlumberger’s (SLB) outlook, performance, and financial condition. In this part, we will discuss more.

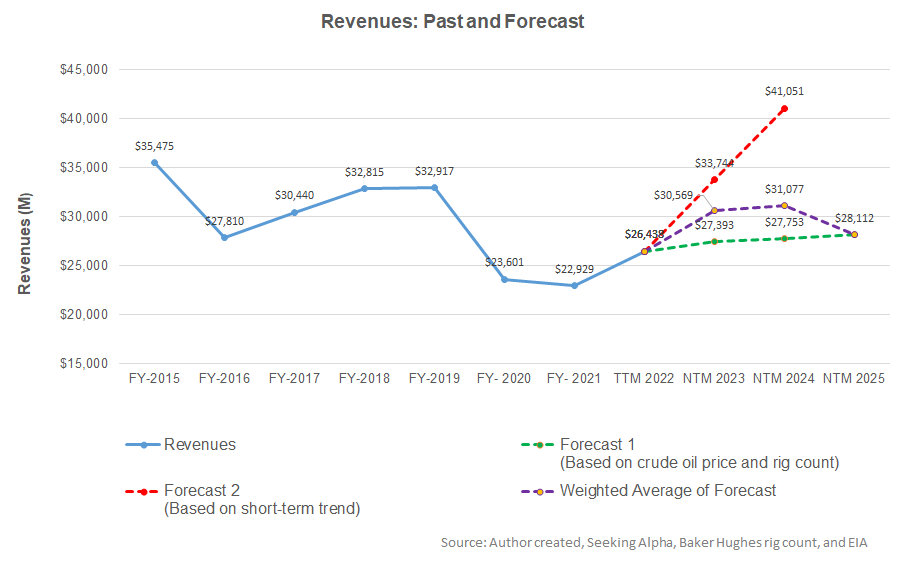
A regression equation-based model on the relationship among the crude oil price, global rig count, and SLB’s reported revenues for the past seven years and the previous eight-quarters suggests revenues to increase by 16% in the next 12 months (or NTM 2023). However, revenues will decelerate in 2024 and then decline in NTM 2025.

The EBITDA can increase by 31% in NTM 2023 and 10% again in NTM 2024. Based on the average forecast revenues, the model suggests the company’s EBITDA will decrease in NTM 2025.

Target Price And Relative Valuation

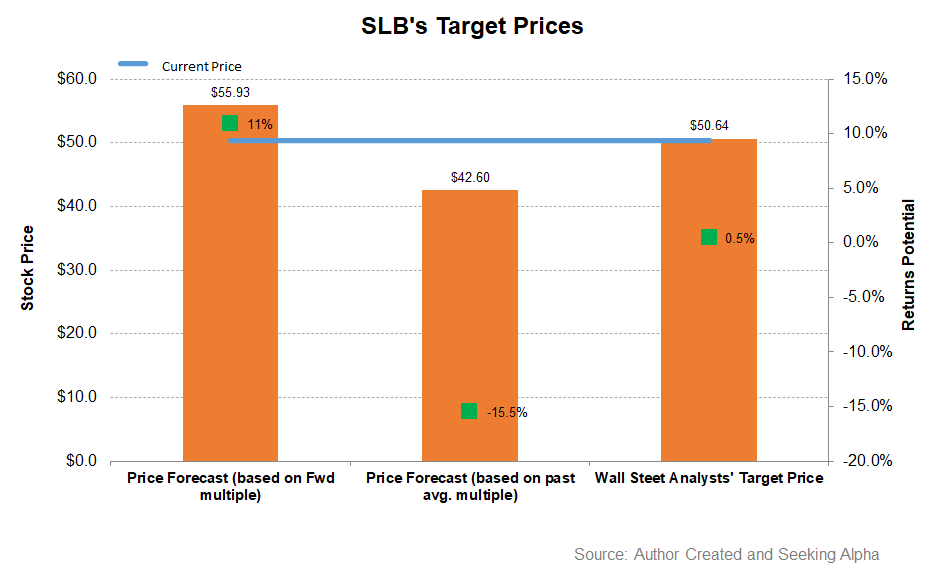
Returns potential using SLB’s forward EV/EBITDA multiple (12.2x) is higher (11% upside) than the returns potential using the past average multiple (15% downside). The Wall Street analysts have nearly zero return expectations at this level.

SLB’s forward EV-to-EBITDA multiple contraction versus the current EV/EBITDA is marginally higher than the peers because the company’s EBITDA is expected to increase more sharply than its peers in the next four quarters. This would typically reflect a higher EV/EBITDA multiple compared to the peers. The company’s EV/EBITDA multiple (15.2x) is higher than the peers’ (HAL, BKR, and FTI) average of 11.4x. So, I think the stock is reasonably valued at the current price.

What’s The Take On SLB?

Schlumberger’s management views that the energy demand will stay robust in the near term, while the typical winter seasonality can slightly distort the outlook in North America. In Q4, the SLB’s management expects to see “mid-20s” year-over-year revenue growth, while EBITDA can also expand. To ensure long-term growth, it has started investing handsomely in developing new capabilities in clean energy, including hydrogen and CCUS (carbon capturing).

A global economic slowdown concern and the adverse effects of year-end seasonality can disrupt the energy sector’s growth path. In Q3, the company’s Digital & Integration revenue segment revenues decreased because of higher exploration data transfer fees. Nonetheless, SLB’s free cash flow recovery in Q3 shows its improving health. The cash flow growth trend can continue in Q4. The stock is reasonably valued compared to its peers. Given the current momentum, we think the stock has a positive bias over an extended period.

Previous Post

OIL DYNAMICS GETTING INTERESTING

Next Post

Halliburton Part 1: HAL Rides On International Market Growth And A Cash Flow Recovery

Related Posts

Halliburton’s Perspective in Q1: KEY Takeaways
Market Trends

Halliburton’s Perspective in Q1: KEY Takeaways

May 16, 2025
STEP Energy Services: Q1 TAKE THREE
Market Trends

STEP Energy Services: Q1 TAKE THREE

May 15, 2025
Market Sentiment Tracker: Demand Holds, Cracks Widen
Market Trends

Market Sentiment Tracker: Demand Holds, Cracks Widen

May 14, 2025
MMV: What is the connection between Frac Job Count and OPEC’s production? Enterprise Subscribers
Market Trends

MMV: What is the connection between Frac Job Count and OPEC’s production? Enterprise Subscribers

May 12, 2025
Liberty Energy’s Perspective in Q1: KEY Takeaways
Market Trends

Liberty Energy’s Perspective in Q1: KEY Takeaways

May 12, 2025
KLX Energy Services: Q1 TAKE THREE
Market Trends

KLX Energy Services: Q1 TAKE THREE

May 9, 2025
Next Post
Halliburton Part 1: HAL Rides On International Market Growth And A Cash Flow Recovery

Halliburton Part 1: HAL Rides On International Market Growth And A Cash Flow Recovery

Please login to join discussion

Recent News

Halliburton’s Perspective in Q1: KEY Takeaways

Halliburton’s Perspective in Q1: KEY Takeaways

May 16, 2025
STEP Energy Services: Q1 TAKE THREE

STEP Energy Services: Q1 TAKE THREE

May 15, 2025
FREE READ: Oil Markets Trying to find direction

FREE READ: Oil Markets Trying to find direction

May 14, 2025
Market Sentiment Tracker: Demand Holds, Cracks Widen

Market Sentiment Tracker: Demand Holds, Cracks Widen

May 14, 2025
MMV: What is the connection between Frac Job Count and OPEC’s production? Enterprise Subscribers

MMV: What is the connection between Frac Job Count and OPEC’s production? Enterprise Subscribers

May 12, 2025
Primary Vision

Established in 2011, we are renowned for our expert frac data and analytics, providing a rich array of unique indicators and industry commentary.

CONTACT

+1-713-554-4977
info@primaryvision.co

SOCIAL NETWORKS

POLICIES

Privacy Policy
Terms of Use

PARTNERS

Amazon Web Services

TRUSTED SITES

Logo

Logo

RECENT NEWS

Halliburton’s Perspective in Q1: KEY Takeaways

Halliburton’s Perspective in Q1: KEY Takeaways

May 16, 2025
STEP Energy Services: Q1 TAKE THREE

STEP Energy Services: Q1 TAKE THREE

May 15, 2025
FREE READ: Oil Markets Trying to find direction

FREE READ: Oil Markets Trying to find direction

May 14, 2025
Market Sentiment Tracker: Demand Holds, Cracks Widen

Market Sentiment Tracker: Demand Holds, Cracks Widen

May 14, 2025
MMV: What is the connection between Frac Job Count and OPEC’s production? Enterprise Subscribers

MMV: What is the connection between Frac Job Count and OPEC’s production? Enterprise Subscribers

May 12, 2025
  • HOME
  • ABOUT US
  • RESEARCH
  • EVENTS
  • PRESS
  • SUPPORT
  • FAQ
  • LATEST NEWS
  • LOGIN
  • SIGN UP!

© 2025 Primary Vision. All rights reserved.

  • HOME
  • ABOUT US
    • ABOUT US
    • PRIMARY VISION AI INNOVATIONS
  • RESEARCH
    • INSIGHTS & ARTICLES
    • FREE ARTICLES
  • EVENTS
  • PRESS
  • SUPPORT
  • FAQ
  • LATEST NEWS
  • LOGIN
  • SIGN UP!
    • FRAC SPREAD COUNT SIGN-UP!
    • ENTERPRISE SUBSCRIPTION PLAN SIGN UP!

© 2025 Primary Vision. All rights reserved.