- The demand-supply gap in the energy industry will mostly favor the oilfield services industry, although the capex discipline will continue.
- The company expects demand for its e-fracking and smart fracking equipment to strengthen in the medium to long term.
- Cash flows improved compared to a quarter ago but still fell short of the previous year.
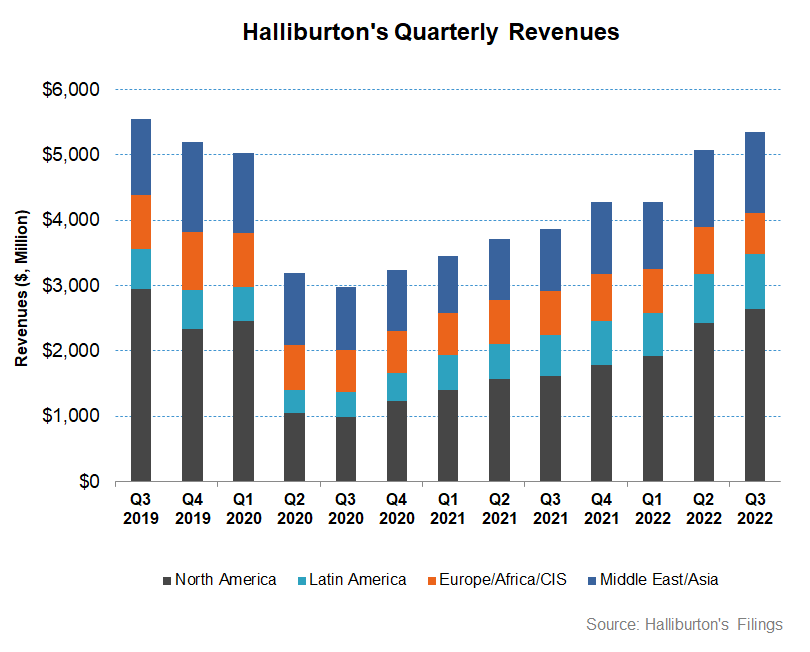
- Halliburton expects much of its upside potential to arise in the Middle East and some parts of Latin America in the short term
Explaining The Geographic Outlook

As we discussed in our articles on SLB (SLB) and Baker Hughes (BKR), the demand-supply imbalance in the energy market will continue in the near term, despite the crude oil price volatility in the current scenario. Halliburton’s (HAL) management believes that multiple years of increased investment will be required to regain equilibrium. Along with legacy energy production, unconventional energy and offshore vs. onshore production cycles will play a crucial role.
However, energy and service operators will remain disciplined in their approach to growth and investment. Oilfield service companies’ performances determine market consolidation, competition, capex constraints, and supply chain issues. Like its peer SLB, Halliburton sees strong growth potential in the Middle East, including Saudi Arabia, UAE, Qatar, Iraq, and Kuwait. In Latin America, the management sees upsides in Brazil and Guyana.
In 2023, the company’s sales are expected to increase due to stronger inbounds for calendar slots. The demand for specialized equipment sets will be high because the operators value technology and performance. These factors will push HAL’s sales in North America.
The Fracking Side Of The Story
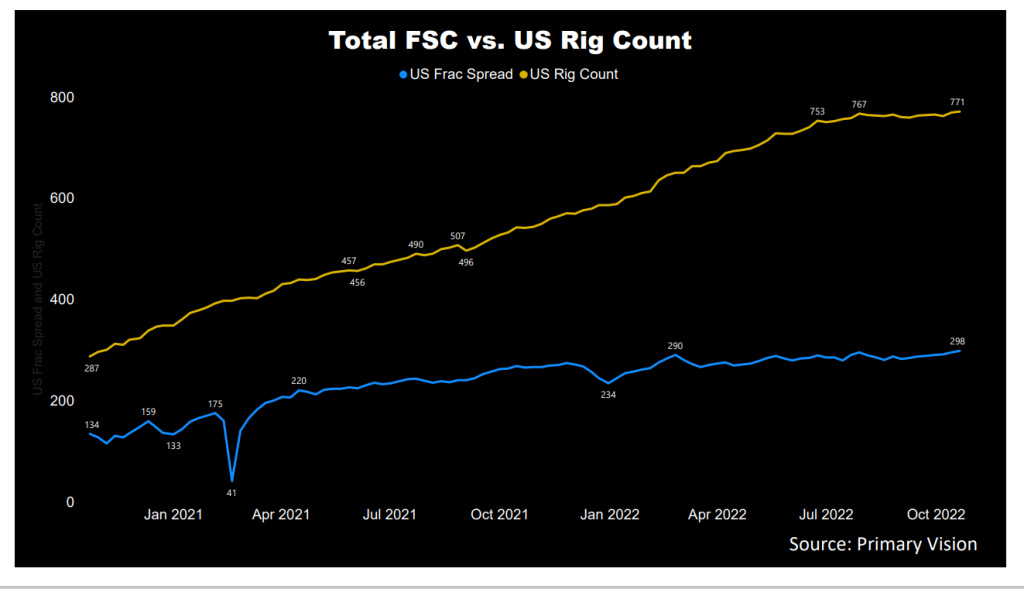
According to Primary Vision’s forecast, the frac spread count (or FSC) reached 298 by the third week of October and has increased by 27% since the end of 2021. Over the past month, we saw ten frac fleet additions in the US. A rising frac count is positive for HAL’s growth. The company’s Zeus eFleets allowed pumping over 20,000 hours for customers. On top of that, its SmartFleet intelligent fracturing system can see a nearly eight-fold increase in stages completed this year. It provides customers with data about how their fractures permeate and the potential for frac hits to improve completion designs.
Segment Forecast
In Q4, the management expects revenues in the Completion and Production division to grow by “the low-to-mid single digits” and margins to improve by 50-100 basis points. The Drilling and Evaluation division can see ” low-to-mid single digits” revenue growth, while margins can expand by 75-125 basis points in Q4.
What Do The Industry Indicators Suggest?
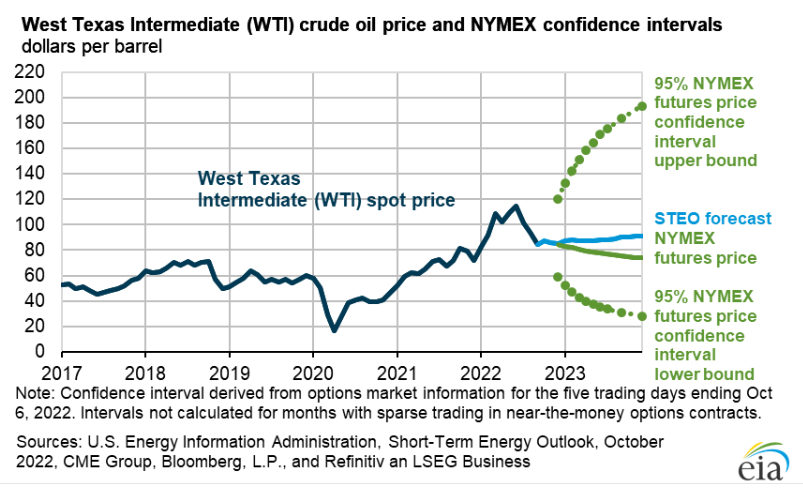
According to the EIA, crude oil prices can increase by ~9% in Q4 compared to the current level. By 2023, however, it can increase further (2% up) due to the petroleum supply disruptions and slow crude oil production growth. The EIA expects OPEC crude oil production will fall to 28.6 million barrels per day in Q1 2023.
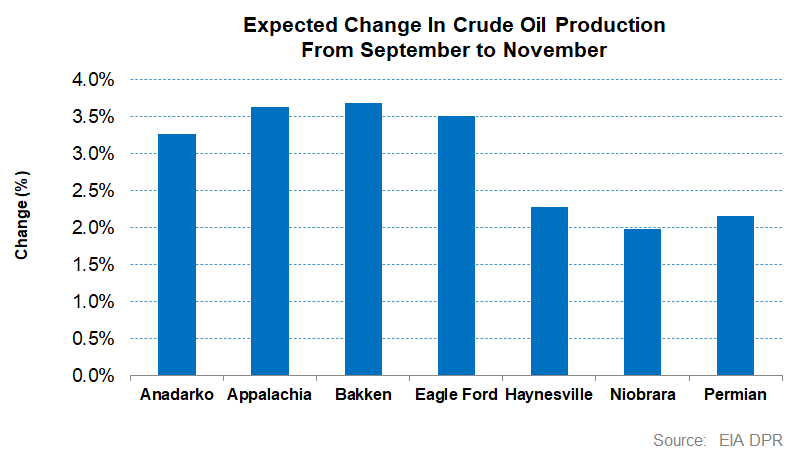
According to the EIA’s Drilling Productivity Report, US shale oil production can increase by 2.9% on average by November 2022. The drilled wells went up by 49% in the past year, while the drilled but uncompleted (or DUC) wells have declined by 23%. The continuous fall in the DUC backlog over the past several months points to reasonably steady energy production growth.
Analysing Division Performance
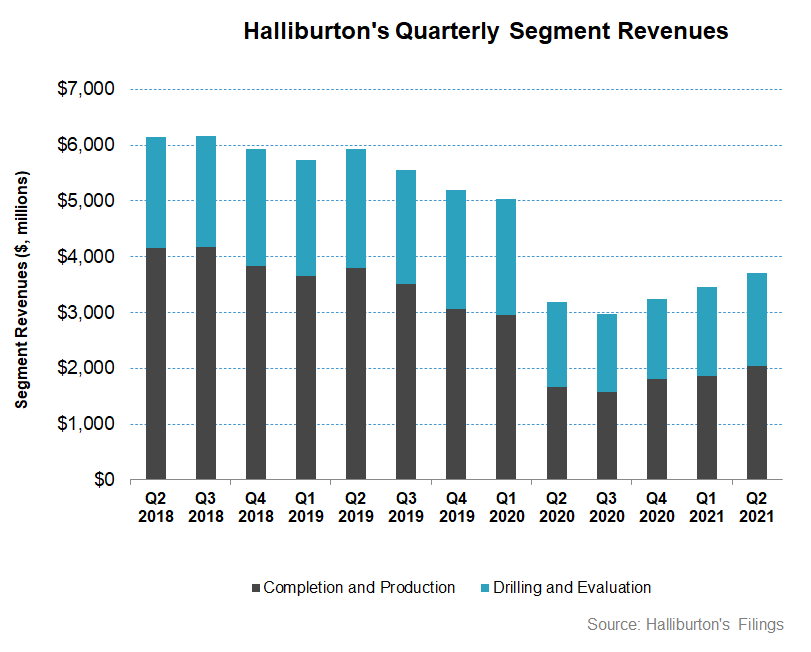
In Q3 2022, Halliburton’s Completion and Production division revenue increased by ~8% compared to Q2 2022. Increased pressure pumping services in North America and completion tool sales in Middle East/Asia led to the topline movement. As a result of this overall growth, its operating income margin also expanded by 150 basis points) in this segment. However, the closure of the activity in Russia lowered growth.
Quarter-over-quarter, HAL’s Drilling and Evaluation division revenue growth was 2.7% in Q3. During Q3, Western Hemisphere and Middle East/Asia saw improved drilling-related services, project management activity, and wireline services. The operating income margin also expanded. However, some geographic areas like Norway and the Gulf of Mexico saw sales headwinds in Q3.
Dividend And Dividend Yield
Halliburton pays an annual dividend of $0.48 per share, translating to a 1.39% forward dividend yield. Schlumberger (SLB) pays a yearly dividend of $0.70, which equals a forward dividend yield of 1.34%.
Free Cash Flow And Debt
HAL’s cash flow from operations (or CFO) decreased by 12% in 9M 2022 compared to a year ago. Although revenue increased in the past year, investment in working capital led to a cash flow decrease. On top of that, the capex increased (37% up). As a result, free cash flow declined. But, compared to a quarter ago, when FCF was negative, this was an impressive turnaround. The management expects to generate FCF similar to FY2021 in FY2022 (~$800 million).
Halliburton has strengthened its balance sheet and retired $600 million in Q3. As FCF improves, the company plans to increase its shareholders’ returns through dividends and share buybacks. HAL’s debt-to-equity is 1.04x, much higher than its peers (Schlumberger, TecnipFMC, and Baker Hughes) (BKR).
Learn about HAL’s revenue and EBITDA estimates, relative valuation, and target price in Part 2 of the article.


