Primary Vision
  • HOME
  • ABOUT US
    • ABOUT US
    • PRIMARY VISION AI INNOVATIONS
  • RESEARCH
    • INSIGHTS & ARTICLES
    • FREE ARTICLES
  • EVENTS
  • PRESS
  • SUPPORT
  • FAQ
  • LATEST NEWS
  • LOGIN
  • SIGN UP!
    • FRAC SPREAD COUNT SIGN-UP!
    • ENTERPRISE SUBSCRIPTION PLAN SIGN UP!
  • HOME
  • ABOUT US
    • ABOUT US
    • PRIMARY VISION AI INNOVATIONS
  • RESEARCH
    • INSIGHTS & ARTICLES
    • FREE ARTICLES
  • EVENTS
  • PRESS
  • SUPPORT
  • FAQ
  • LATEST NEWS
  • LOGIN
  • SIGN UP!
    • FRAC SPREAD COUNT SIGN-UP!
    • ENTERPRISE SUBSCRIPTION PLAN SIGN UP!
No Result
View All Result
Primary Vision
Home Market Trends

Halliburton Part 2: Estimates And Relative Valuation

Avik Chowdhury by Avik Chowdhury
October 28, 2022
in Market Trends
0
Halliburton Part 2: Estimates And Relative Valuation

  • Our regression model suggests an increase in revenues in NTM 2023 and a deceleration in NTM 2024.
  • EBITDA can increase sharply in NTM 2023 but will fall flat after that.
  • The stock is slightly undervalued at the current level.

Part 1 of this article discussed Halliburton’s (HAL) outlook, performance, and financial condition. In this part, we will discuss more.

Linear Regression Based Forecast

Based on a regression equation among the crude oil price, global rig count, and HAL’s reported revenues for the past seven years and the previous eight-quarters, revenues will increase by 14% in the next 12 months (or NTM 2023). However, the model suggests it may decelerate in NTM 2024 and decline in NTM 2025.

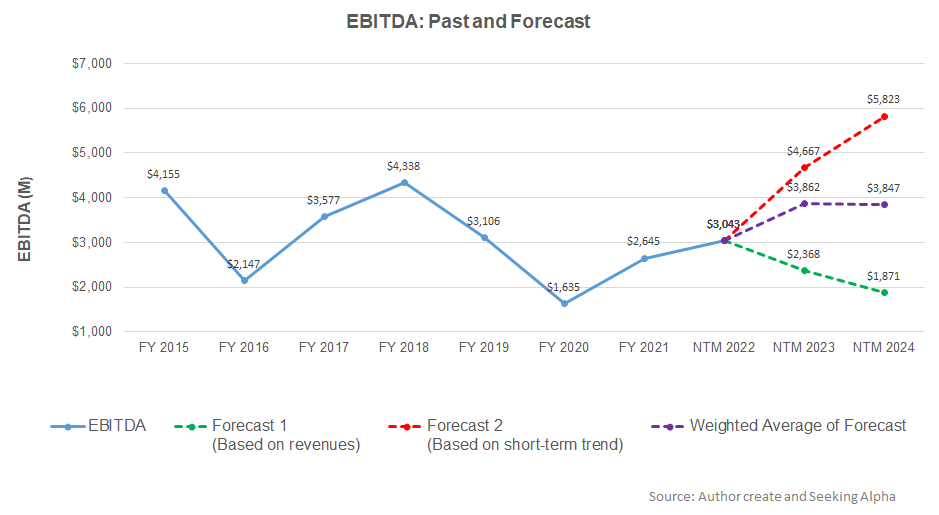
Based on the regression model using the average forecast revenues, the company’s EBITDA is expected to increase by 27% in NTM 2023. The growth rate can come to naught in NTM 2024.

Target Price And Relative Valuation

Returns potential using HAL’s forward EV/EBITDA multiple (10x) is higher (1% upside) than returns potential using the past average multiple (20% downside). The Wall Street analysts have considerably higher return expectations (21% upside).

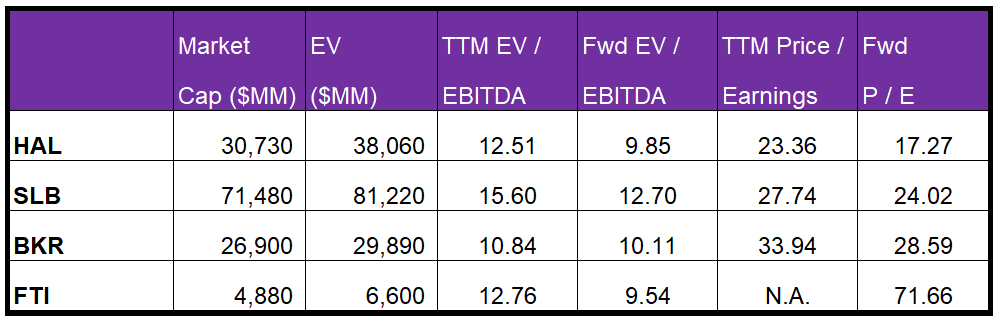
Halliburton’s forward EV-to-EBITDA multiple contraction versus the current EV/EBITDA is slightly steeper than peers because sell-side analysts expect HAL’s EBITDA to increase more sharply than its peers in the next four quarters. This typically results in a marginally higher EV/EBITDA multiple than peers. However, the stock’s EV/EBITDA multiple (12.5x) is lower than its peers’ (SLB, BKR, and FTI) average of 13.1x. So, the stock is undervalued versus its peers at this level.

Analyst Rating

According to data provided by Seeking Alpha, 22 sell-side analysts rated HAL a “Buy” or “Strong Buy” in the past 90 days, while three of them rated it a “Hold.” Only one rated a “Sell.” The consensus target price is $42.3, which yields 20% returns at the current price.

What’s The Take On HAL?

After Q3, Halliburton’s management conceded that its sales will increase in 2023 due to stronger inbounds for calendar slots while the demand for specialized equipment sets will be high. Along with legacy energy production, unconventional energy and offshore vs. onshore production cycles will play a crucial role. Outside North America, strong demand for HAL’s services in Saudi Arabia, UAE, Qatar, Iraq, and Kuwait in the Middle Ear and Brazil & Guyana in Latin America will drive its topline. Over the medium to long term, e-fracking and smart fracking equipment will become more prominent drivers in HAL’s portfolio.

The free cash flow improvement in 9M 2022 allowed Halliburton to deleverage its balance sheet further. However, more work is required in this aspect because the company’s leverage remains too high for comfort. The stock is marginally undervalued versus its peers at this level. Given the current energy supply dynamics, investors might want to hold the stock for medium to long-term gains.

Previous Post

Halliburton Part 1: HAL Rides On International Market Growth And A Cash Flow Recovery

Next Post

ENERGY OUTLOOK 2022

Related Posts

Market Sentiment Tracker: What the Latest Data Says: U.S. Steadies, Europe Slows, China Rebounds (Sort of)
Market Trends

Market Sentiment Tracker: What the Latest Data Says: U.S. Steadies, Europe Slows, China Rebounds (Sort of)

June 18, 2025
Monday Macro View: Top 5 Reasons Crude Prices Are Ascending – and the recent Middle East tension is only one of them!
Market Trends

Monday Macro View: Top 5 Reasons Crude Prices Are Ascending – and the recent Middle East tension is only one of them!

June 16, 2025
Nabors Industries’ Perspective in Q1: KEY Takeaways
Market Trends

Nabors Industries’ Perspective in Q1: KEY Takeaways

June 16, 2025
ProPetro’s Perspective in Q1: KEY Takeaways
Market Trends

ProPetro’s Perspective in Q1: KEY Takeaways

June 13, 2025
Market Sentiment Tracker: What If This Is as Good as It Gets?
Market Trends

Market Sentiment Tracker: What If This Is as Good as It Gets?

June 11, 2025
Monday Macro View: As OPEC+ Raises Output, Is U.S. Shale Prepared to Follow—or Fade?
Market Trends

Monday Macro View: As OPEC+ Raises Output, Is U.S. Shale Prepared to Follow—or Fade?

June 9, 2025
Next Post
ENERGY OUTLOOK 2022

ENERGY OUTLOOK 2022

Please login to join discussion

Recent News

Market Sentiment Tracker: What the Latest Data Says: U.S. Steadies, Europe Slows, China Rebounds (Sort of)

Market Sentiment Tracker: What the Latest Data Says: U.S. Steadies, Europe Slows, China Rebounds (Sort of)

June 18, 2025
Monday Macro View: Top 5 Reasons Crude Prices Are Ascending – and the recent Middle East tension is only one of them!

Monday Macro View: Top 5 Reasons Crude Prices Are Ascending – and the recent Middle East tension is only one of them!

June 16, 2025
Nabors Industries’ Perspective in Q1: KEY Takeaways

Nabors Industries’ Perspective in Q1: KEY Takeaways

June 16, 2025
ProPetro’s Perspective in Q1: KEY Takeaways

ProPetro’s Perspective in Q1: KEY Takeaways

June 13, 2025
Market Sentiment Tracker: What If This Is as Good as It Gets?

Market Sentiment Tracker: What If This Is as Good as It Gets?

June 11, 2025
Primary Vision

Established in 2011, we are renowned for our expert frac data and analytics, providing a rich array of unique indicators and industry commentary.

CONTACT

+1-713-554-4977
info@primaryvision.co

SOCIAL NETWORKS

POLICIES

Privacy Policy
Terms of Use

PARTNERS

Amazon Web Services

TRUSTED SITES

Logo

Logo

RECENT NEWS

Market Sentiment Tracker: What the Latest Data Says: U.S. Steadies, Europe Slows, China Rebounds (Sort of)

Market Sentiment Tracker: What the Latest Data Says: U.S. Steadies, Europe Slows, China Rebounds (Sort of)

June 18, 2025
Monday Macro View: Top 5 Reasons Crude Prices Are Ascending – and the recent Middle East tension is only one of them!

Monday Macro View: Top 5 Reasons Crude Prices Are Ascending – and the recent Middle East tension is only one of them!

June 16, 2025
Nabors Industries’ Perspective in Q1: KEY Takeaways

Nabors Industries’ Perspective in Q1: KEY Takeaways

June 16, 2025
ProPetro’s Perspective in Q1: KEY Takeaways

ProPetro’s Perspective in Q1: KEY Takeaways

June 13, 2025
Market Sentiment Tracker: What If This Is as Good as It Gets?

Market Sentiment Tracker: What If This Is as Good as It Gets?

June 11, 2025
  • HOME
  • ABOUT US
  • RESEARCH
  • EVENTS
  • PRESS
  • SUPPORT
  • FAQ
  • LATEST NEWS
  • LOGIN
  • SIGN UP!

© 2025 Primary Vision. All rights reserved.

  • HOME
  • ABOUT US
    • ABOUT US
    • PRIMARY VISION AI INNOVATIONS
  • RESEARCH
    • INSIGHTS & ARTICLES
    • FREE ARTICLES
  • EVENTS
  • PRESS
  • SUPPORT
  • FAQ
  • LATEST NEWS
  • LOGIN
  • SIGN UP!
    • FRAC SPREAD COUNT SIGN-UP!
    • ENTERPRISE SUBSCRIPTION PLAN SIGN UP!

© 2025 Primary Vision. All rights reserved.