The oil field service arena faced a slew of issues during COVID19, ranging from supply chain constraints down to labor costs and spiraling inflation. This resulted in direct impacts to the adoption of e-fracs, as well as the availability of new spreads. The supply chain has (finally) started to catch up, but there is still a long lead time for equipment, especially on the electric spread front. Increased labor costs are not something that will go away any time soon, but the ability to source steel and other components has improved. Even with these improvements, there is still about an 18-month wait period to take delivery of a new spread. The oil and gas industry has shifted their focus to cash flow and balance sheet management, so we aren’t going to see a company speculatively ordering new spreads. We have moved from the “If you build it, they will come” mantra to “If you want me to build it, you will give me a two-year guaranteed contract!” Most of the orders to date have been to replace old equipment as we aren’t seeing a new wave of supply in the horsepower world.
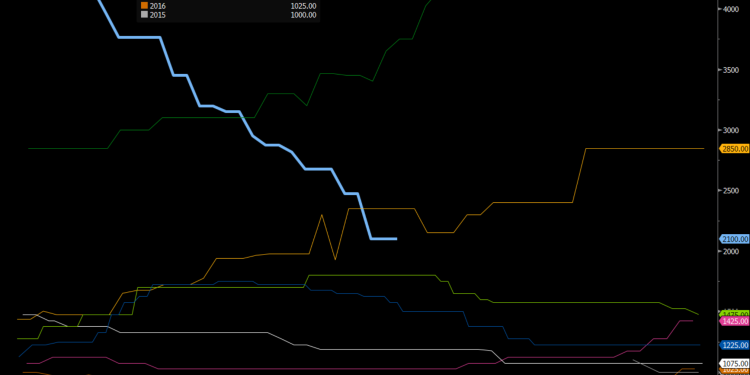
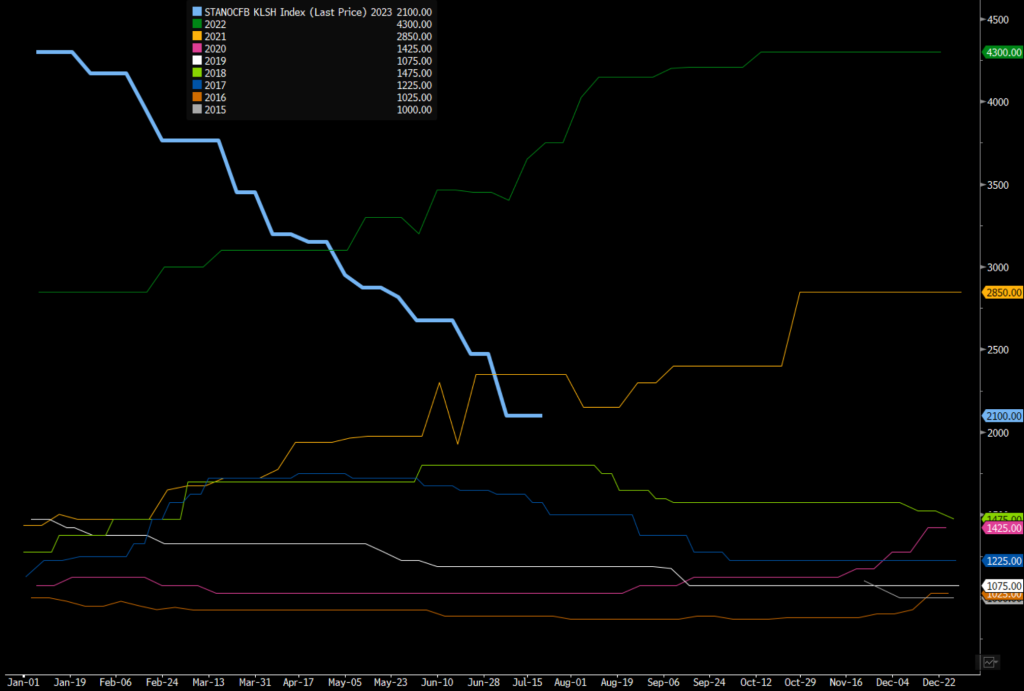
Even as some pricing metrics have improved, it’s important to “zoom out” and put everything into historical context. Sure, prices have gotten better, but we are far from a normal market. Just looking at a basic piece of equipment like steel pipe: prices have come down, but we are still at very elevated levels.
North America Steel OCTG P110 Pipe 5.5 inch Diameter Spot FOB- Source Bloomberg
Labor is another huge overhang as wages soared in the past few years, with no sign of receding in the near-term. The construction industry remains a strong area of employment with better hours and comparable pay, so the OFS community needs to incentivize people to go into their field. This is achieved through higher pay, overtime, stage bonuses, and other cash initiatives. It doesn’t matter how you splice the data, margins will remain a problem as costs stay elevated across the board.

You might be asking yourself, Given all of these hinderances, why would anyone order a new spread—especially a more expensive electric fleet? Some of the benefits were outlined above, but another big one is the underlying efficiency of O&M (operations and maintenance) and the ability to deliver dual frac (simulfrac) without any additional horsepower. A normal e-frac already has enough horsepower to fracture two wells at the same time without ordering additional capacity. The adoption of this method has accelerated throughout the Permian with more testing taking place in other basins as well. If widely adopted, their efficiency will reduce the total number of spreads to achieve growth and maintain current U.S. production levels. An electric fleet has fewer moving parts, allowing for a cheaper and easier maintenance schedule. These benefits have long-term cost savings but have a higher upfront cost across the full spread.
For those that read our last AOGR article, we believed the U.S. would have an exit rate of 12.7M barrels a day of crude production. We adjusted those expectations in May to a range of 12.5M-12.6M barrels a day as completion activity was lackluster. Even as prices would support more completions, there has been more discipline from the energy industry and some pivots within basins. Spreads have shifted from dry gas fields to areas producing crude oil and higher cuts of natural gas liquids (wet gas). We have seen some basins get more “gassy” or “lighter” as they mature, which also weighs on realized prices, slowing some growth over 2023.
On a positive note, the U.S. is well placed to supply light, sweet crude into the global market. Saudi Arabia gave the U.S. another gift by sending their official selling prices (OSPs) higher throughout the market. This has enabled our crude to remain competitive into Asia and Europe. There has always been an advantage flowing into Europe given our proximity and competitive pricing, but Asia is contingent on several key factors, including OSPs and shipping. As KSA (Kingdom of Saudi Arabia) sent prices higher into Asia, there has been another wave of purchasing from the U.S. now through October. This will keep our exports between 3.7M–3.8M barrels a day in the global markets. There is also the added benefit of WTI Midland being added to the brent benchmark contract beginning in June. This provided a volume bump for brent while also securing another continuous outlet for the U.S.
The liquids space is a tale of two cities when we evaluate domestic vs international markets. The U.S. has been building out export capacity since the shale revolution began, which enabled us to become a bigger player around the world. This has provided a positive bump in both volume and price as the international market has brought on more refining and petrochemical capacity. Domestically, prices have been under pressure due to limited demand, but our ability to export additional volumes has protected pricing, helping slow the decline. The petchem market has commissioned new assets across the Middle East, but more importantly China, requiring them to import more liquids to support their operations. Under “Made in China 2025” there was extensive investment across the industrial complex with a huge focus on the downstream markets. More than 20 petrochemical projects have been officially completed this year with more to follow. The world has added about 50M tons of new ethylene capacity between 2020–2024, with about 60% of it originating in China. Capacity is ramping up and we have even more coming online through 2037.

As OPEC cuts crude supply, they also reduce the amount of LPG (liquid petroleum gas) and naphtha that is available for export. This has kept U.S. exports of LPG, ethane, and naphtha competitive even as prices have fallen. The new international capacity has put pressure on local American and European margins, forcing them to reduce runs and total capacity. But this reduced price also makes U.S. volume more competitive in the international market. It’s no surprise to see our LPG and ethane exports flowing at record levels in 2023.
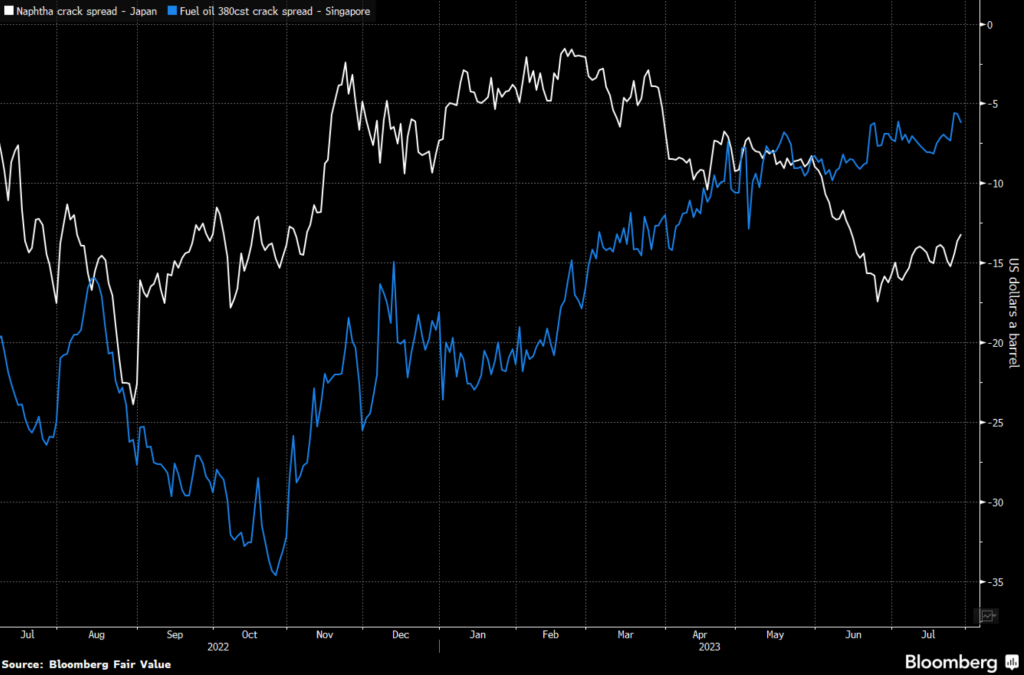
On the other hand, condensate (Naphtha) has seen a lot of pressure in the global markets. Demand at the refining and petrochemical levels has come under pressure as gasoline storage has risen globally and topping units are experiencing margin compression. The below chart shows the decline in the “naphtha” crack and highlights the divide in the underlying production suite of E&Ps in the U.S.
The U.S. natural gas market has been range bound as rising production, driven by associated gas in the southern part of the country, offsets any recent rising demand. This has pushed OFS companies to pivot some spreads from dry gas to wet gas and oily basins. The efficiency of operation at natural gas wells also enables the same level of production with much less equipment. As more LNG export capacity comes online, we will be able to debottleneck some of the current market. Natural gas E&Ps have also reduced activity, focused on cashflow, and managed their margins well to date. We don’t see a big pivot coming until the end of the year, which is seasonally normal for additional activity. The NG curve supports a more balanced realized price of $3.25–$3.75, which would support a balanced drilling program into 2024/2025.
Overall, we aren’t going to see 315 active spreads this year, and struggle to even crest over 300 in this market. The heat has impacted near term activity, but we see a bit of a make-up as we progress through Aug into Sept/Oct. The current pricing deck and underlying demand will keep activity stable at about 275–285 spreads throughout this period, but the pressure on margins and returns will keep OFS on the sidelines for new orders. The focus is to repair and maintain current horsepower, and if need be, order replacement spreads without new additions. The U.S. energy industry has moved firmly into manufacturing mode (as we outlined several years ago), requiring a lower DUC count and more efficient use of equipment in both drilling and completions. We won’t see a hard pivot to the e-frac, but as spreads age out and need to be replaced with newer technology, we’ll see a more gradual adoption over time. The sustainability push will help drive adoption as the energy space looks to “decarbonize” oil and gas extraction. We believe that hydrocarbons will be used for decades to come, but we live in a changing world on the political front. Luckily, the ingenuity of the energy space continues to make headway in creating a cost-effective way to bring sustainable solutions to the energy patch!
The crude markets have benefited from a shift in sentiment against Chinese expectations. Even as we have had slower draws in the U.S. and bigger builds in Europe, the market is expecting a sizeable increase in demand as speculation grows around the OPEC meeting, and if Saudi Arabia will maintain some of the voluntary cut into September. The market is looking for KSA to maintain the full 1M barrel cut into September with other views that they reduce the cut to 500k barrels. Either way- the market is expecting the voluntary cut to persist throughout September in some form.
When we look at underlying demand, the pivot lower continues across some key developed markets. While the DM markets see declines, there have been broad adjustments in some emerging markets on gasoline subsidizes. The most recent being Nigeria: “One of Europe’s main markets for gasoline has shrunk, threatening to squeeze European refiners, after Nigeria removed fuel subsidies, which destroyed much of the country’s domestic demand and a regional market for smuggled fuel. North America and West Africa (WAF), with Nigeria at the helm, historically have been the top two destinations for petrol exports from Europe, which produces more gasoline than it uses, meaning its refiners rely on exports to support profit margins.” This will slate more gasoline for the U.S. markets as Africa imports less from Europe, which is already sitting on a massive amount of gasoline in storage. The below chart shows gasoline in European storage, and now with another end market gone and slowing demand internally- more will be pushed into the export market. European refiners have already been reducing runs, and there is likely more downside pressure on operations as demand wanes.
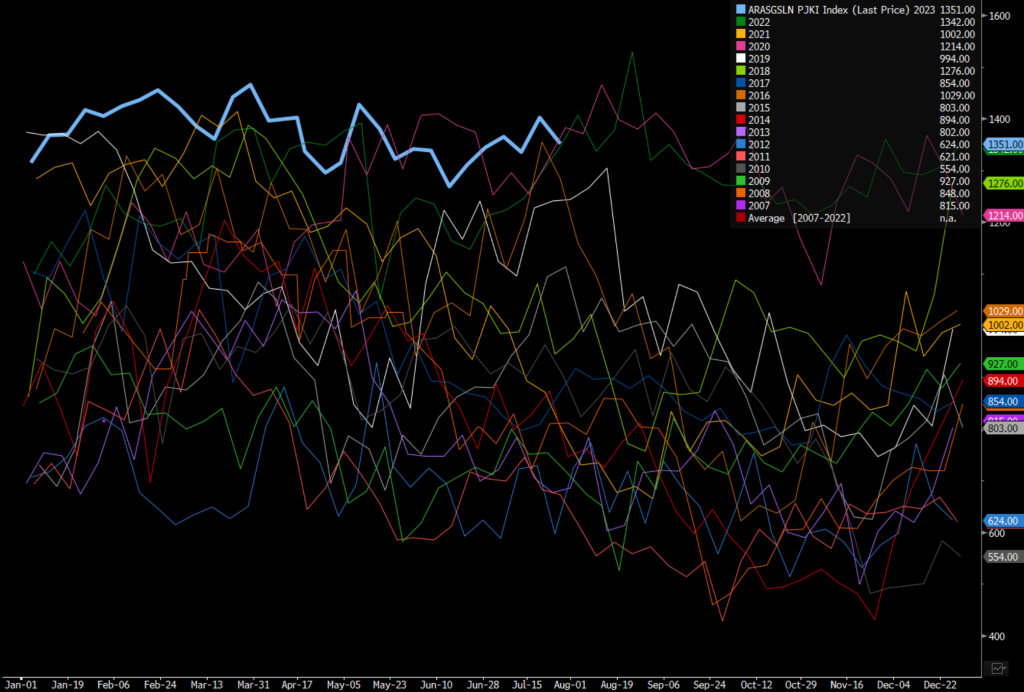
The data so far this week has shown another step down in gasoline demand, which is counter seasonal as we should still be moving higher. “According to GasBuddy data, week-to-date US gasoline demand (Sun-Wed) is down 1.1% from the same period last week.”

China is no different with another shift lower in underlying activity throughout the country.

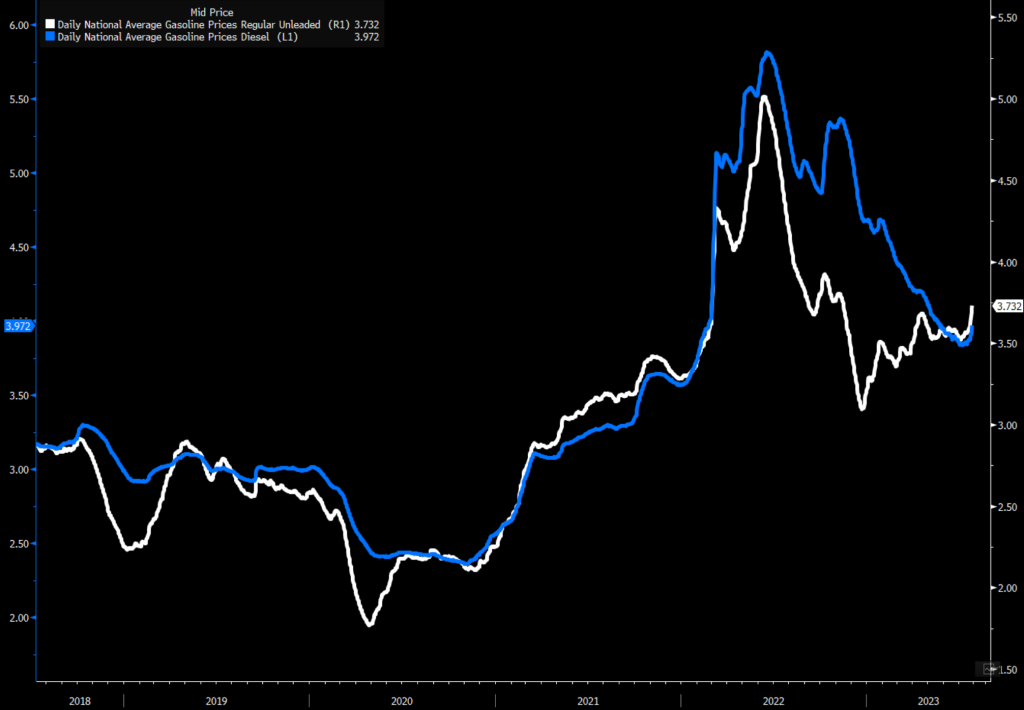
I know the market has taken futures higher on more demand, but through most metrics- we don’t see any sizeable shifts higher in the market. This slowdown in demand is also coming during peak driving/summer season, which I think points to broader problems on the consumer side of the equation. The recent pivot higher in retail gasoline and diesel prices will be BAD for future demand- things were already looking questionable and now this is just fanning the flames of inflation.
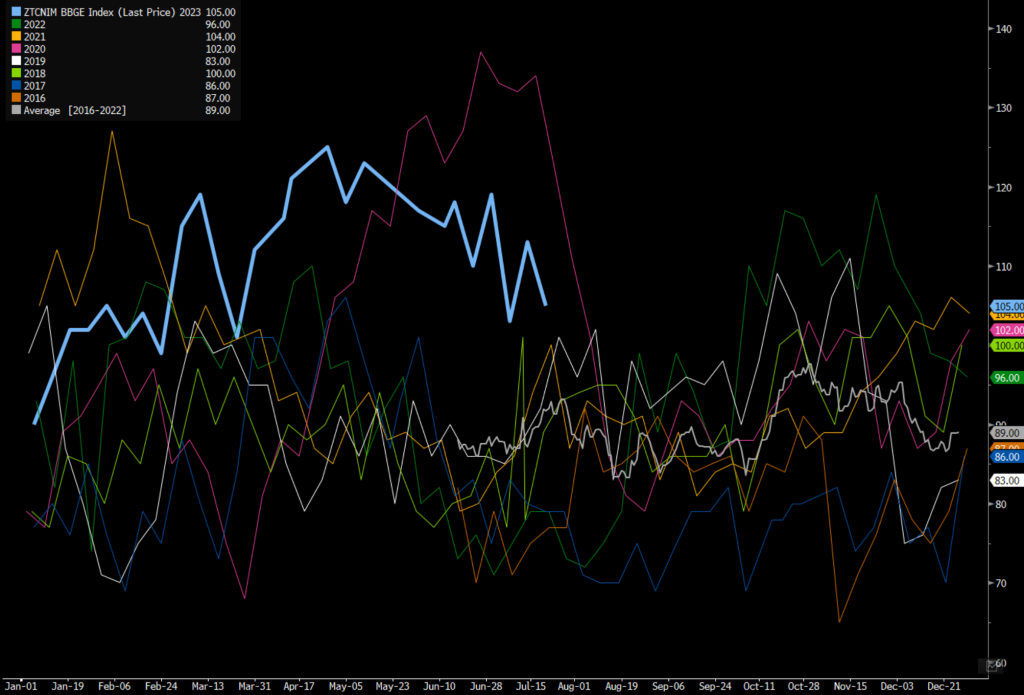
China purchases steadied at about 112 so a bounce keeping a decent chunk of crude flowing into the country even as their refiners operate well below seasonal norms.
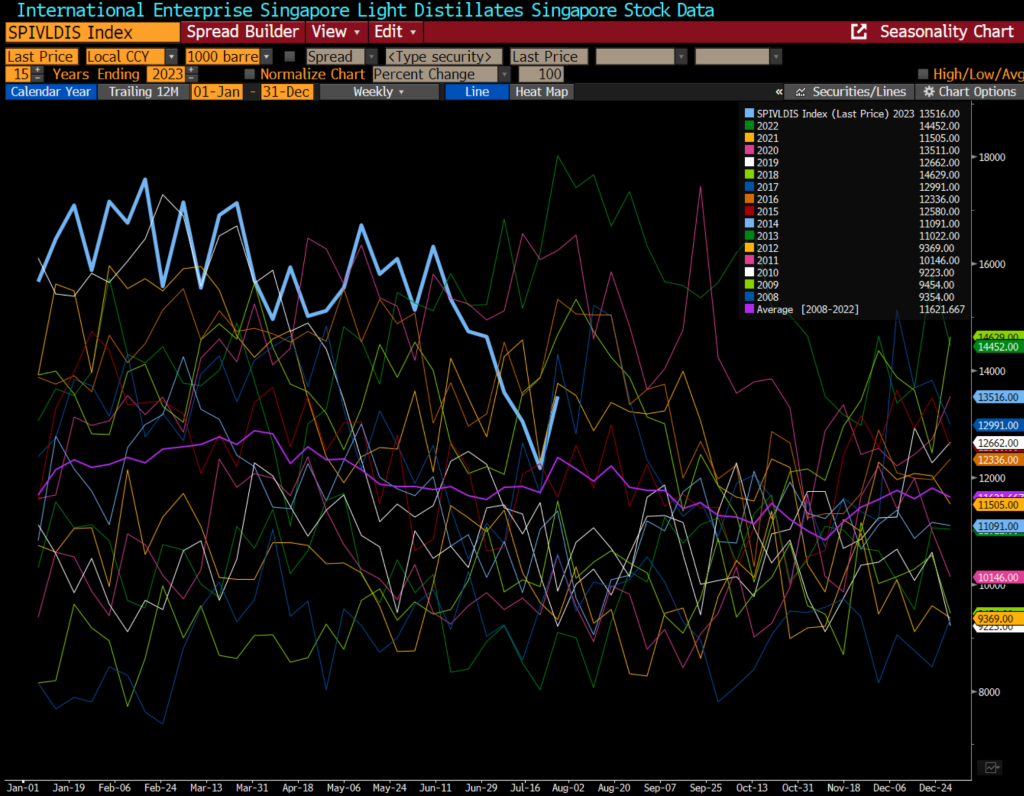
We discussed on the EIA show how we expected a sizeable movement higher in Singapore storage, and we now had a nice pick-up in volumes- specifically in Light distillates.
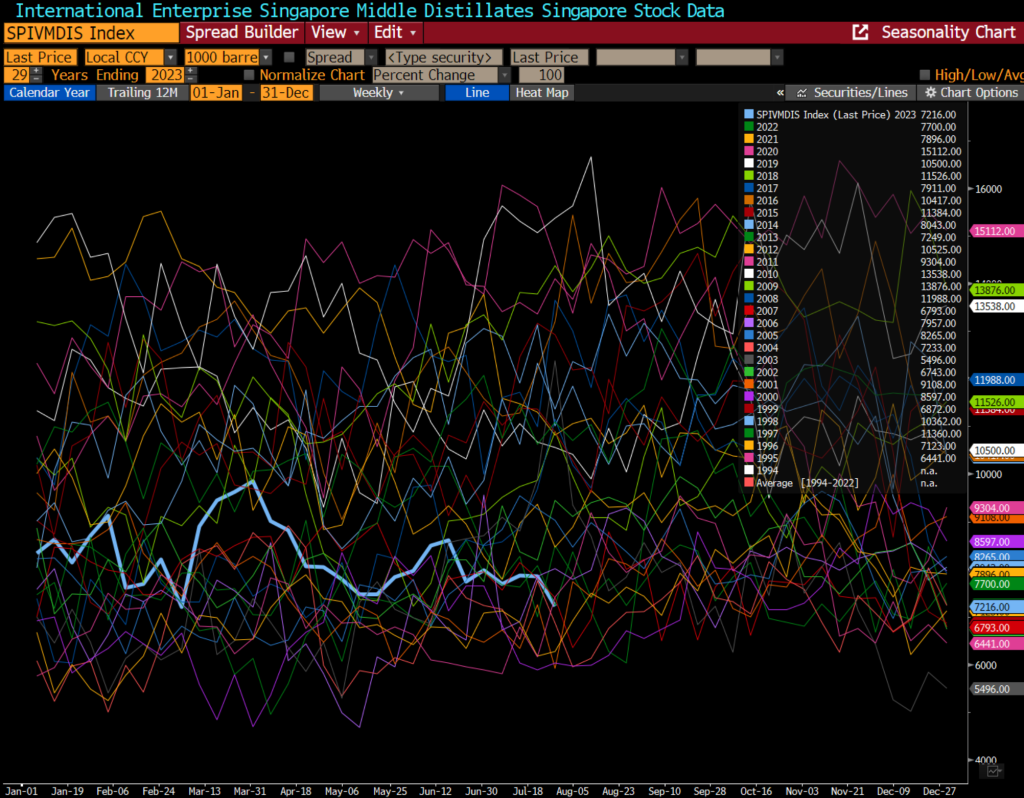
Even with a sizeable spike in light and heavy disty (resid), the middle distillate (diesel) side of the equation reached a new recent low. I had to extend the years back to 1995 to find a point where storage was lower. This will help support crack spreads on the disty front, and at some point, we will see additional volumes flowing from China.
At these disty crack spreads, China should be exporting as much as possible to close the gap. It will also keep the East to West arb closed.
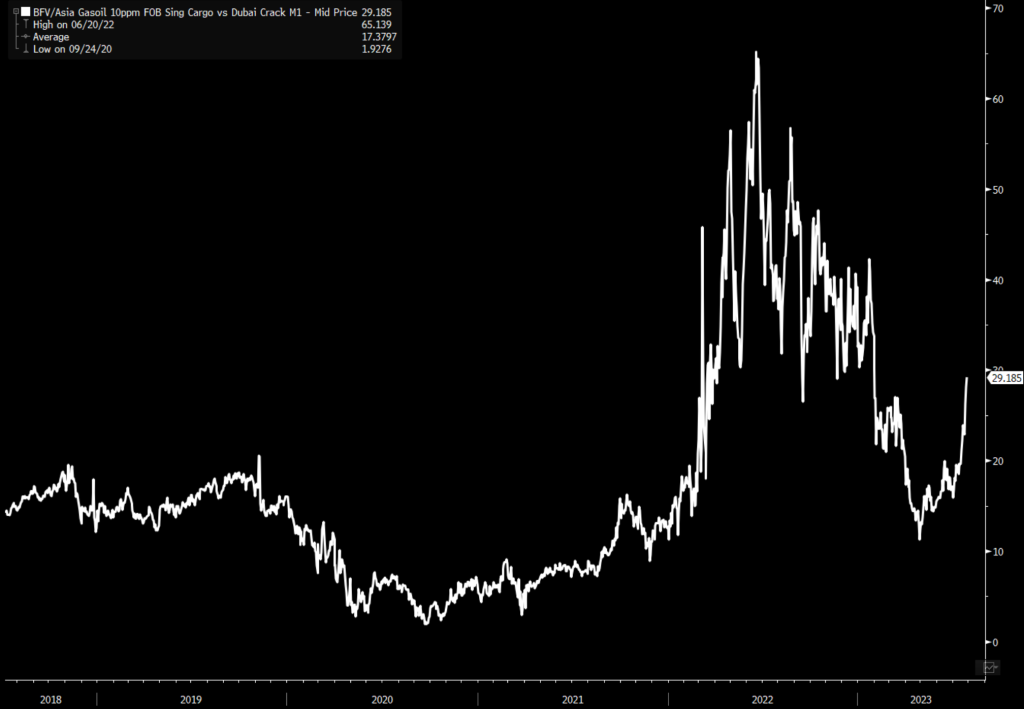
Russia is also set to increase their diesel exports and keep their very elevated flows moving into the market.. “Russia plans a small increase in daily diesel exports from its key western ports in August, taking advantage of strong demand and underscoring that its pledge to reduce overseas flows refers only to crude oil. Diesel loadings from Russian ports on the Black and Baltic Seas, including some cargoes from Belarus, are set at 2.49 million tons next month, the most since March, according to industry data seen by Bloomberg. That’s around 600,000 barrels a day, up 2.2% from July’s schedule, Bloomberg calculations show.” Russia is swapping out some of their crude exports with products because of the healthy margin that can be gained in the market for products.

As flows slow from the Middle East, the tanker surplus has widened that is unlikely to reverse in the near term. “The surplus of oil supertankers in the Persian Gulf widened over the past week, a Bloomberg survey shows.
- The excess of tankers compared with crude cargoes was at 30% on Friday, according to the median estimate of three people involved in the market
- Expanded from 24% last week
- YTD average is 27%
- Spot fixture activity has been subdued in the Middle East over the past week, causing the vessel surplus to expand and failing to provide enough action to support earnings, according to one of the respondents
- Daily earnings for ships on the benchmark Middle East-to-China route slid to $26,999 Friday, shedding 13% over the past week, Baltic Exchange data show
- The past week has been mundane in the Middle East VLCC market with a slow drip-feed of cargoes offered and “it may be a challenge to prevent rates from softening next week if this continues,” Gibson Shipbrokers says in a note”
Floating storage keeps moving higher in the Middle East and Asia, as flows have slowed and cargoes get deferred. The below chart shows total floating storage in the market.
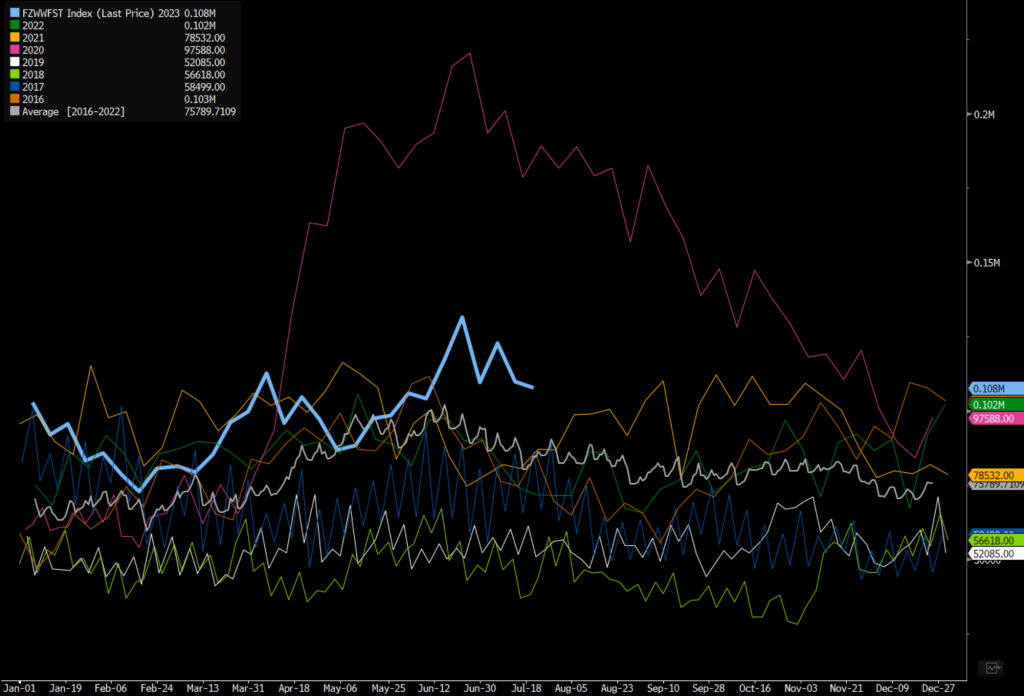
It will be important to see if China maintains their current rate of purchasing with so much going directly into storage.
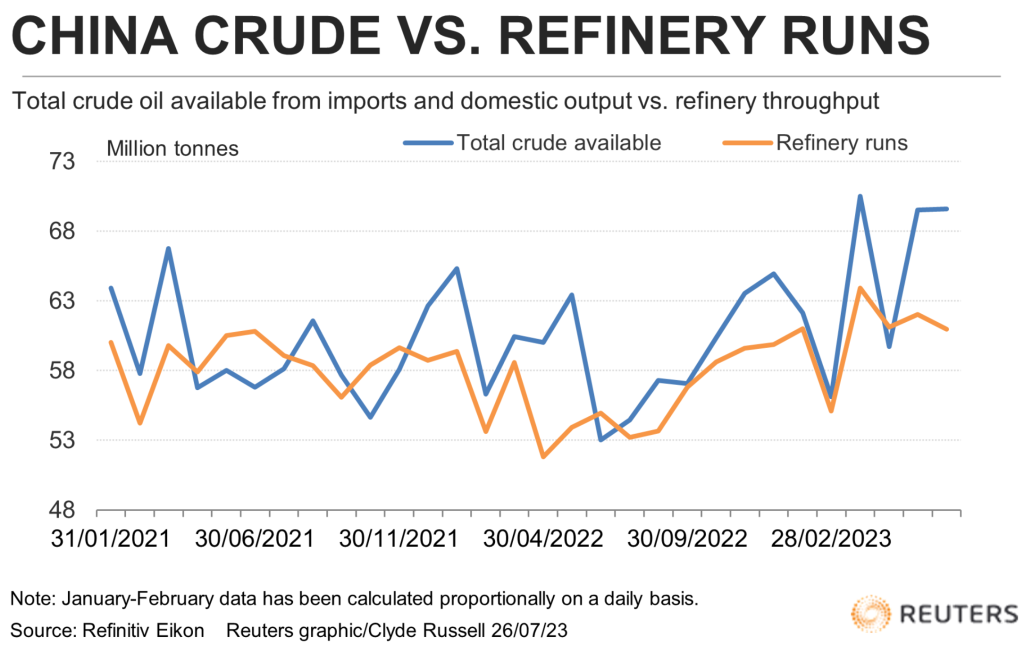
They have already started increasing their exports of refined products, which isn’t surprising given the margin currently in the market.

Here is an example of commentary from S&P Global: “Middle distillates, including diesel and jet fuel, fell by 19,000 barrels or 0.7% on the week to 2.811 million barrels. The East of Suez gasoil market backwardation steepened July 24 even though recent spot activity indicated weakness in the physical cargo market, which continued to be weighed by surplus barrels trapped in the region on unviable East-West economics. Demand for gasoil was weaker than usual even though consumption in Europe usually tapers over June-August in the absence of heating requirements, industry sources said. “European gasoil demand continues to feel pressure from economic headwinds, with the downturn in eurozone manufacturing reaching new lows in June,” said S&P Global Commodity Insights analysts in a July 21 outlook, adding that third-quarter demand is expected to fall 90,000 b/d year on year.
The physical front we are getting more cargoes deferred in WAF:
WAF SALES:
- Fewer Nigerian crude cargoes for August loading are still looking for buyers, largely because several have been deferred into the following month. Angola’s last remaining shipments for next month are proving slow to place
- For Nigeria, between eight and 12 shipments for August loading are still searching for purchasers out of 45 planned
- That compares with 16 unsold as of July 17 from a tally of 50 lots; more than 80% were unsold as of July 7
- The unsold tally has declined this week mostly due to multiple cargoes being pushed into September, traders said
- NOTE: Six cargoes combined of August crude from Erha, Bonga, Bonny Light and Qua Iboe were deferred from August into September this week
- About 2-3 cargoes of Angolan crude for loading next month are yet to find final buyers, out of 34 scheduled
- Declined from 4-5 on July 17
- Rate of sales is a little slower than normal given that the preliminary plan for September is out already
- Two consignments of the Republic of the Congo’s Djeno crude are still looking for purchasers, out of seven planned
- Compares with three on July 17
- The next Djeno program is due about July 24
We have talked significantly about how China doesn’t have the capacity nor understanding of their current issues to bring meaningful stimulus. Here are just some additional commentaries around those views- so you can see it isn’t just me being a crazy person.
These charts also help set the stage a bit given the underlying leverage of the Chinese populace.

Essentially people need home prices to appreciate and that is the EXACT OPPOSITVE of the proposal from the Chinese government. This is why we are starting to see more and more destocking

The reason this matters so much- China’s real estate sector and the knock on impacts drives a significant amount of growth for their GDP- to the measure of 21%- it’s going to be tough to drive that value.

Especially as their leverage remains TERRIBLE:

All the while retail sales continue to weaken significantly – “Retail Good Sales growth in China – online and offline. Interesting the pre-pandemic offline sales growth was far lower than online and yet, now they’re moving in tandem. What’s even more clear is that goods growth hasn’t picked up the way they were anticipated. Revenge spending is not playing out… at least for stuff.”
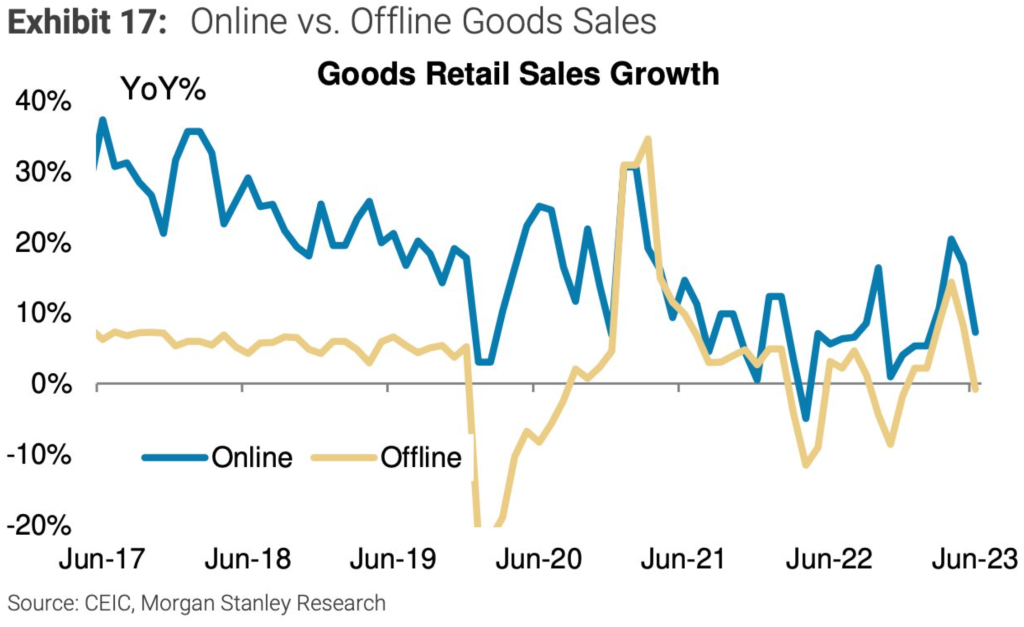
As growth decelerates and actually turns negative (into contraction) across manufacturing and services.


Anyone hoping China’s leaders were planning significant economic stimulus will be sorely disappointed by the readout of Monday’s econ-focused July Politburo meeting.
Some context: Every quarter Xi Jinping chairs a Politburo meeting to discuss the state of the economy and plan next moves.
Monday’s meeting promised to “strengthen countercyclical adjustments,” but offered nothing that’s up to the task of turning the economy’s fortunes in a hurry.
The Politburo diagnosed the economy’s problems by saying it is “facing new difficulties and challenges” due to:
- “Insufficient domestic demand”
- “Operating difficulties at some firms”
- “Many hidden risks in key areas”
- “A complex and serious external environment”
What’s to be done?
- Fiscal policy must be proactive and monetary policy prudent
- Fees and taxes must continue to be reduced
- The central bank (PBoC) must continue to deploy structural monetary tools (which include things like relending quotas)
Some context: The Politburo promised proactive fiscal and prudent monetary policies following its last meeting on the economy in April.
In short, the Politburo is cognizant of the pressures the economy is under, but it’s not freaking out. Rather, it sees:
- “Economic recovery as a process of waves and zigzags.”
Get smarter: The Politburo sees the path to recovery through reforms that reduce risk, help firms, boost confidence, and unleash domestic demand – not through stimulus.
- At best, that means a gradual increase in support on the margins – such as extended tax cuts and adjustments to the business environment.
The bottom line: There isn’t going to be a stimulus bazooka.
Here are some clues from #China politburo
To address local debt risks through a comprehensive debt resolution plan putting job stability at a strategic level.
#Realestate policy to be adjusted promptly, replacing the previous “not for speculation” rhetoric.
On Monday, the People’s Bank of China (PBoC) released draft security management measures for the financial sector.
- The regulations will impact industries including banking, payments, and fintech.
Big picture: These regs are a financial sector-specific implementation of China’s Data Security Law, the cyberspace administration’s (CAC) not-yet-finalized data security implementation rules, and other regulations.
What caught our eye: The PBoC’s rules require that sensitive data be classified in two different ways:
- First, by the nationwide standard three-tiered system defined by CAC – “general,” “important,” and “core” data.
- Second, by a five-tiered risk system of the PBoC’s own making.
Sigh.
Regular readers might recognize this: In March, a PBoC official complained that the financial sector’s data security regulations were in conflict with regulations put in place by the CAC, messing up cross-border data flows.
- Requiring financial companies to use both systems looks like a political compromise to us.
Our take: We keep saying it’s a mistake for national regulators to require each industry to separately formulate data security rules.
Our other take: We’d be surprised if these overcomplicated rules don’t require a cleanup in a few years.
Beijing wants local governments to stop cooking the books.
On Tuesday, the National Bureau of Statistics (NBS) announced that special inspection squads are headed to six provinces to crack down on statistical fraud.
The lucky provinces:
- Hebei, Heilongjiang, Henan, Hunan, Guizhou, and Shaanxi.
Some context: The NBS conducts inspections of all 31 mainland provinces every five years, looking at areas including statistical policy implementation, statistical work performance, and preventing statistical fraud.
- The bureau also organizes “special statistical inspections” for outstanding issues.
More context: Earlier this year, following Xi Jinping’s warning about data fraud, many local governments held campaigns to “self-examine” and “self-correct” their problems.
The latest inspections start in late July and will seek to ensure that Xi’s instructions on preventing data fraud are being implemented.
- In particular, we expect the inspections to focus on misreporting of industrial data, like industrial output.
Get smart: Chinese officials report false data because they are under pressure to meet certain targets.
- As long as that pressure remains, dodgy data will continue to be a problem.
Don’t expect much more support for the flagging property sector.
- That’s one of our key takeaways from Monday’s econ-focused July Politburo meeting.
ICYMI: Last week’s macro numbers revealed a stalling property market recovery.
- Average home prices across 70 large cities dropped for the first time in six months.
- Floor space under construction fell 26.8% y/y.
But despite this bleak backdrop, the cavalry isn’t coming to support the sector. Indeed, the meeting readout called to (Gov.cn):
- “Adapt to major changes in the supply-demand relationship in the real estate market.”
Translation: The high-flying days of breakneck property growth are (still) over.
The readout then enumerated a host of now-familiar policy prescriptions, including:
- “Optimizing” real estate policies
- Ensuring policy differentiation based on local conditions
- Better meeting residents’ needs for first home purchases and home improvements
Other plans include:
- Increasing the supply of affordable housing
- Promoting urban renewal
- Revitalizing idle properties
Our take: Despite the omission of Xi Jinping’s signature phrase “Housing is for living in, not speculation” – which appeared in the last three mid-year Politburo meeting readouts – we see no indication that significant loosening may be on the horizon.
- The readout clearly prioritizes real estate market stability and “rigid” demand, namely new home purchases and home upgrading.
Our other take: Reflating the property market flies in the face of bigger goals.
- One key long-term priority, for example, is to achieve high-tech self-sufficiency, which will require massive increases in tech investment.
- Given such goals, the last thing policymakers want is boatloads of RMB flooding into unproductive real estate speculation.

