Brent is gyrating around the $93-$94 level, and we don’t see much to break it up or down out of the broader range $88-$96. The market keeps expecting a big push to over $100, but the problem remains demand. The cracks are growing on the demand front as elevated prices hit the global market hard- especially when it comes to inflationary pressure. The economic backdrop was already struggling BEFORE we had a big jump in crude pricing, and this won’t help the cause.
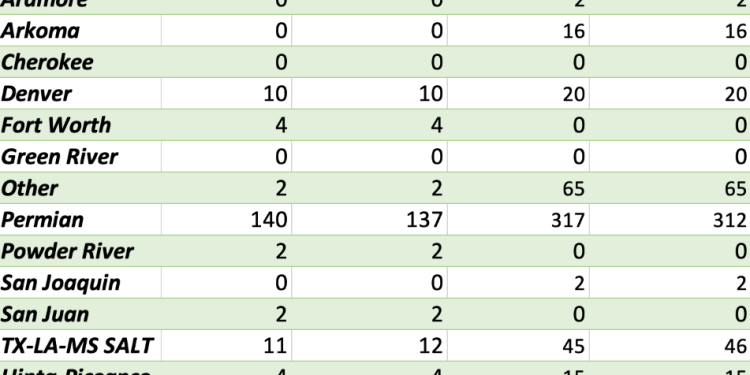
Completion crews took another step down this week with the Permian the main driver of the reduction. We did see some additional activity in the Bakken in line with expectations, but the Permian shift is an important one to watch. There should still be an increase of 20 or so spreads over the next month, but this move lower is definitely counter-seasonal. There has been another round of simulfrac adoption, but without more crews at work- the recent rise in crude production will fade. There is definitely room for the Permian to hit 150 based on the location of crews, so we should see the lion share of the increase still focused in the Permian and Western Gulf.

The bigger issue will be the shift in Russia as they export more crude as diesel flows fade rapidly. Refiners in Russia are struggling with maintenance because companies can’t get needed equipment. This reduction in throughput is pushing more crude on the water. Russia crude exports have had a big spike and are back to June levels- which is currently above the agreement made with OPEC+ or really KSA. Russia can’t afford to shut in wells especially as we head into the winter months. There has always been a fear that if they reduce production too much some of these wells will never come back online without western equipment and engineering.
The below two charts confirm the reduction in refined product exports from Russia, and the dip in refining activity.


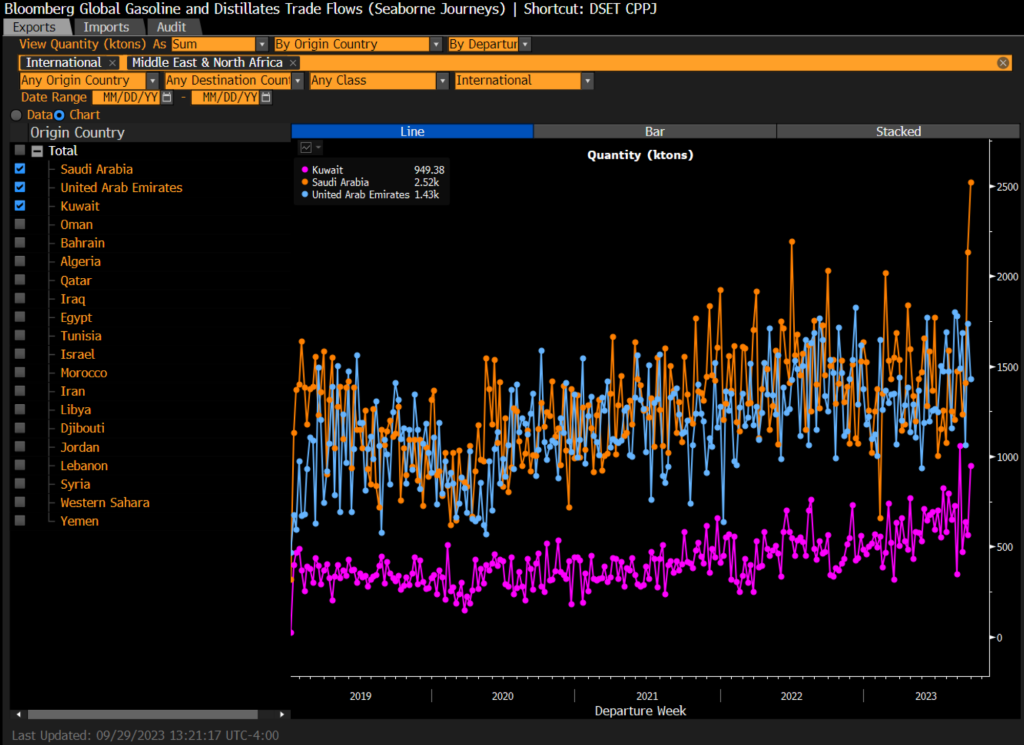
While the Middle East continues to hold to a reduced crude export- they are PUMPING out product. KSa has seen a record amount of refined product exports with Kuwait coming in a close second. We expect to see this remain the case given the current margin in diesel vs crude.

While KSA/ UAE/ Kuwait hold the course, Iraq is the big winter as their flows remain elevated. They can provide meaningful medium/heavy crude at strong prices while still undercutting KSA. We expect this dynamic to continue at least through year end, as the market struggles to fill the heavier end of the crude slate.

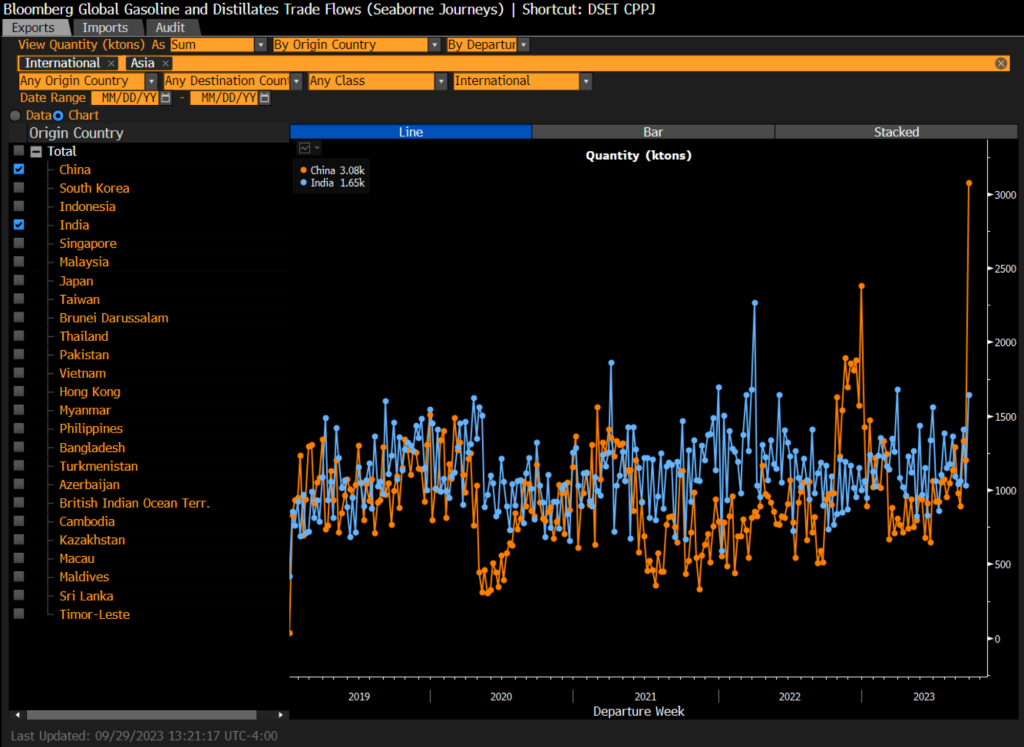
In the meantime, India and China have been exporting a significant amount of product (especially China) given the margin in Asia. China will continue to balance their storage, and maintain some steady crude imports but at broadly reduced rates vs previous levels. Seasonally speaking they normally reduce some flows, but there has been a big pick-up of crude on the water/ floating storage that has capped some of the physical crude prices in the market.
We expect some heaviness in physical crude prices, but not enough to pull down crude future pricing- instead enough to keep them range bound. The demand side of the crude question will weaken seasonally as maintenance season picks up in the U.S. and gasoline storage spikes. As we have highlighted for months, we expected a counter seasonal bump in gasoline storage followed by a “flat lining” of storage. We described this as the “comps getting easier” as gasoline storage didn’t follow the normal drop as demand stayed lackluster.
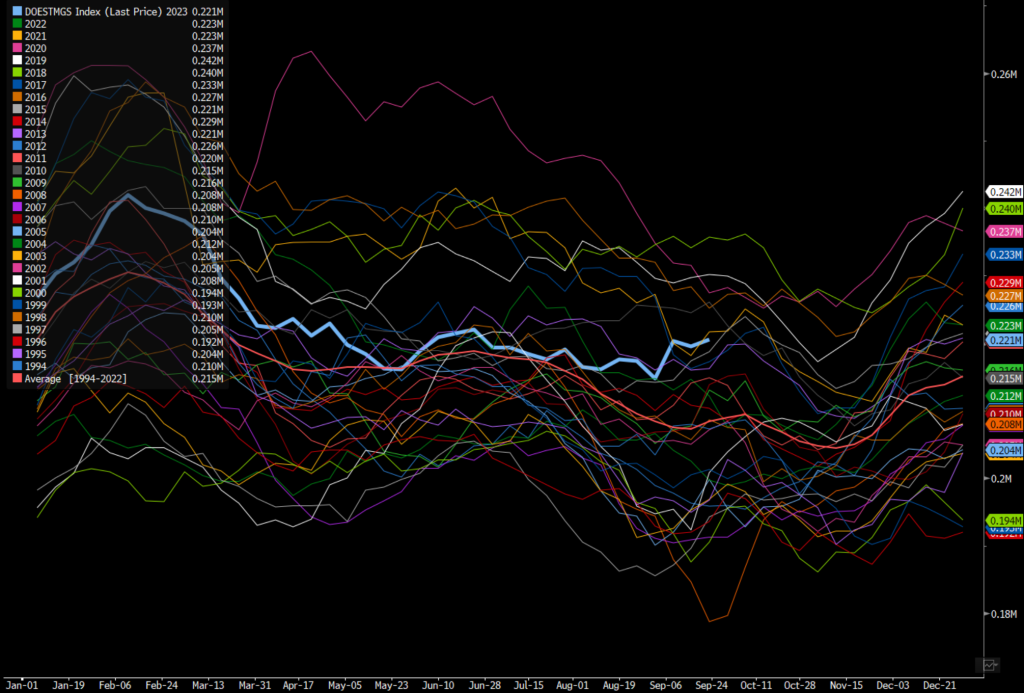
Demand as we see below has remained well off the normal pace- especially as the consumer weakens further.
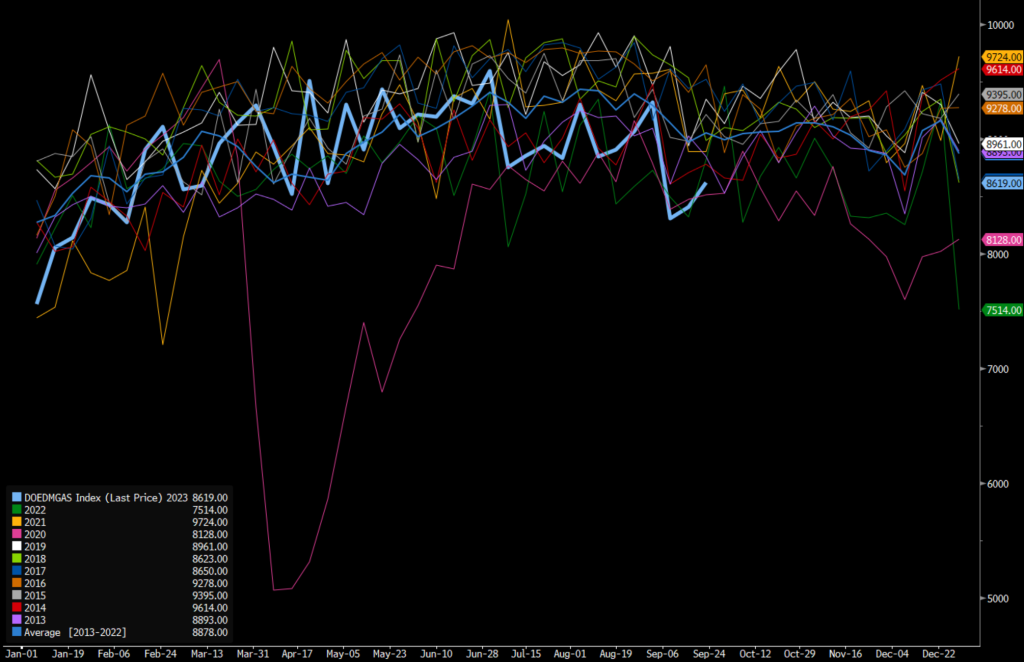
As crude prices hang around this area, the pressure will mount on the consumer as well as corporations. We expect another leg down in global economic activity as we describe below.
When we look at the backlog of orders, there has been a steep drop off after a shallow bounce falling the big drawdown in 2022. We expected to see a bit of a bounce as companies took advantage of discounted shipping to build inventory, but now that we are passed “back to school” shopping things have slowed further. Based on the data, backlogs have already moved into contraction, and we don’t see a turn around in the near future. As companies manage inventory, it will bounce around a bit- but as global trade remains in contraction- the backlog shortfall will only worse.

We have confidence in this view as PMIs remain in contraction with additional pressure coming from the service sector. Manufacturing was already struggling on all fronts, but the service sector was keeping many data points afloat. Now we have service data flipping negative as the manufacturing front “flatlines” in contraction. The rise in energy prices and slowdown in consumer activity will hit harder as spending falls and the “prices paid”/ “prices received” side of the equation in PMI accelerates.

The movement lower is coming on the back of another drop in trade as volumes stagnate. We believe there will be a bigger “rollover” in the coming months as the consumer (finally!) pulls back their spending. The trend for consumer spending has been lower, but it has remained positive in many locations- which has now given way to some negative trends. “Level of World Trade Volume Index (blue) has fallen to lowest since October 2021 … index has fallen by more than 4% year/year (orange), which is consistent with prior recessions.”

I think it also helps to see this put into perspective when tracking the net change. As rates remain elevated around the world, we expect another round of contracting liquidity and loans that will slow the economy further.

The least surprising news is the sizeable drop in excess savings, which were revised down last week. We have been saying for a long time now that savings for the bottom 50% crossed into “negative” territory Q2’22 which is reflected below. Our belief is that the 40%-90% turned lower at the end of Q2 with the last surge being for the back-to-school shopping period. We expect to see a stronger pullback in spend from this important bracket as we head into the lull of Sept/Oct. The top 10% are the remaining individuals with the highest amount of savings, which we think will remain the case. We don’t see this bracket increasing savings.
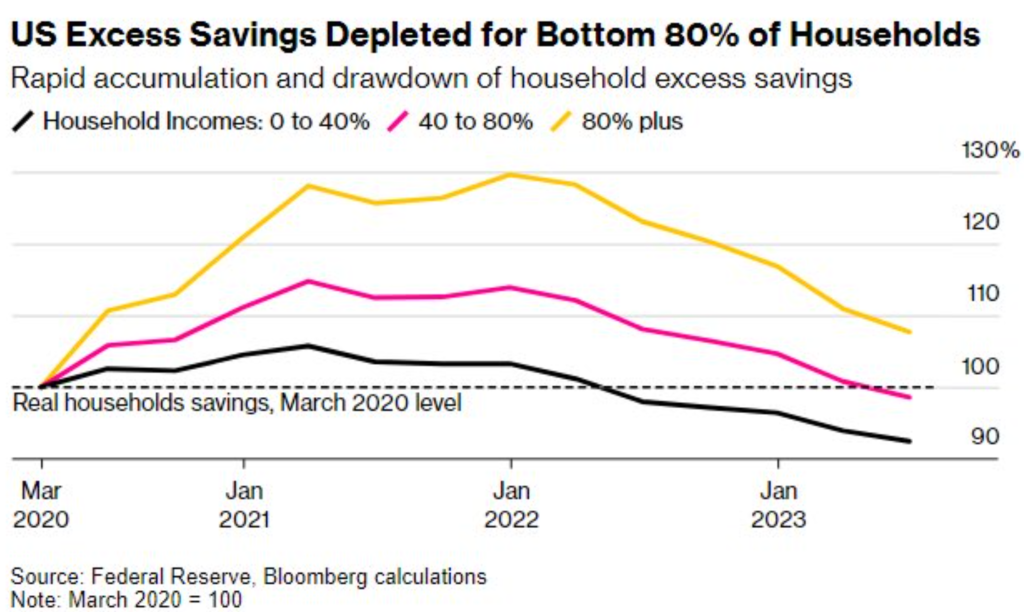
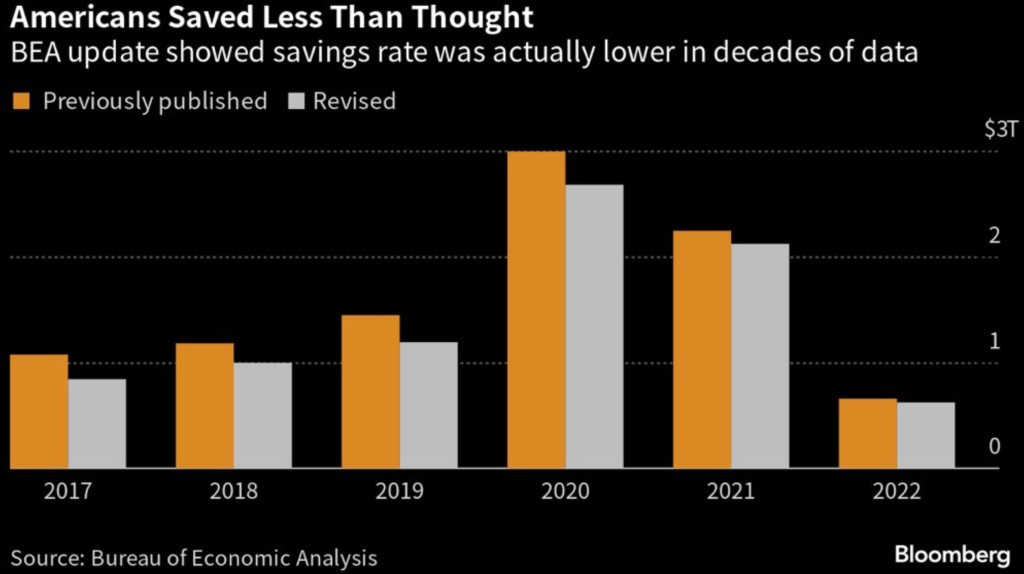
The more important point is the revision on previous savings. Our view was that the savings levels was overstated throughout the pandemic, which turns out to have been a correct view.
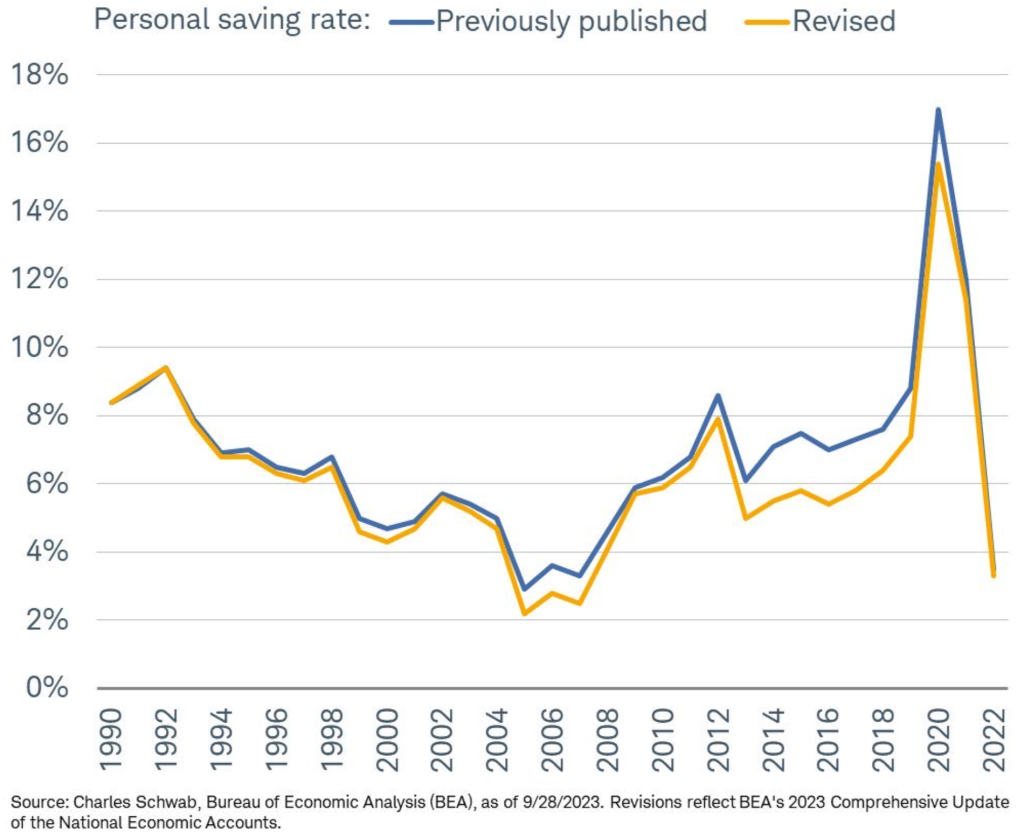
I think this chart shows it in a bit better detail in terms of the revision. It’s important to note the level in 2022 is greatly (if not completely) weighted to the top 20%. “Americans Saved $1.1 Trillion Less Than Thought” “Americans stashed away an average 8.3% of their disposable income annually from 2017 through 2022, down from a previously estimated 9.4%.”
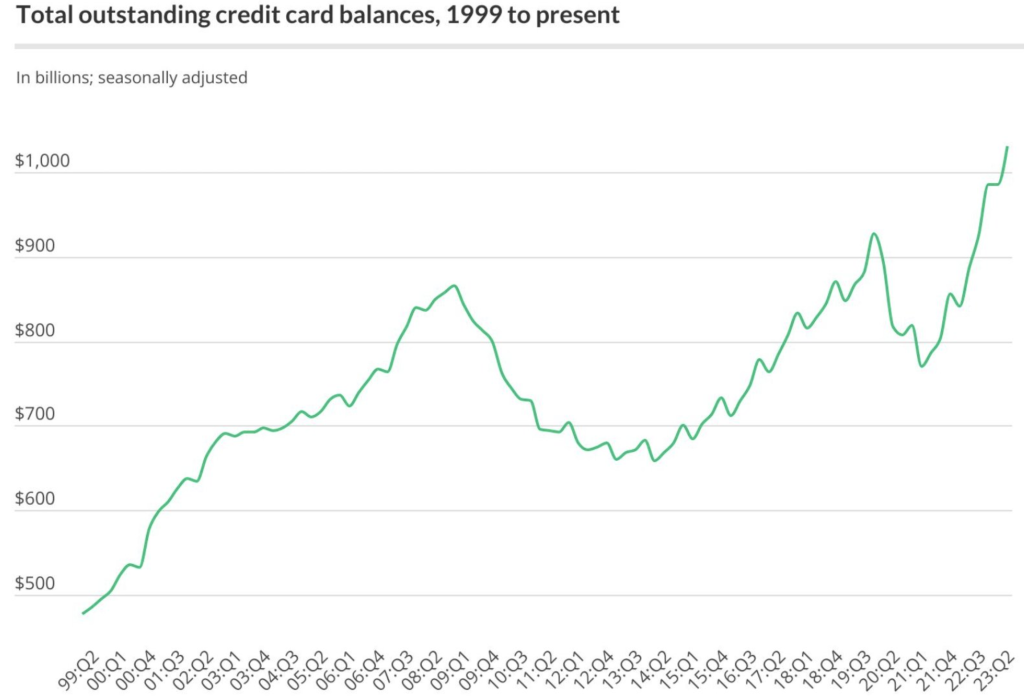
One of the key reasons we believed savings was overstated was the insane pace of credit card balance growth over the same time frame. The massive shift happened in what seemed to be overnight, and the compounding impacts of it are huge. There were also 39k Americans that filed for bankruptcy in August, which is something that will likely get worse over the coming months. Student debt repayments have begun as the level of interest accruing on credit card debt explodes.
There is another round of startups that are shutting down, which in the long run will be a good thing as capital is reallocated. But, that won’t happen overnight and the near term hardships will result in additional economic slowdowns.

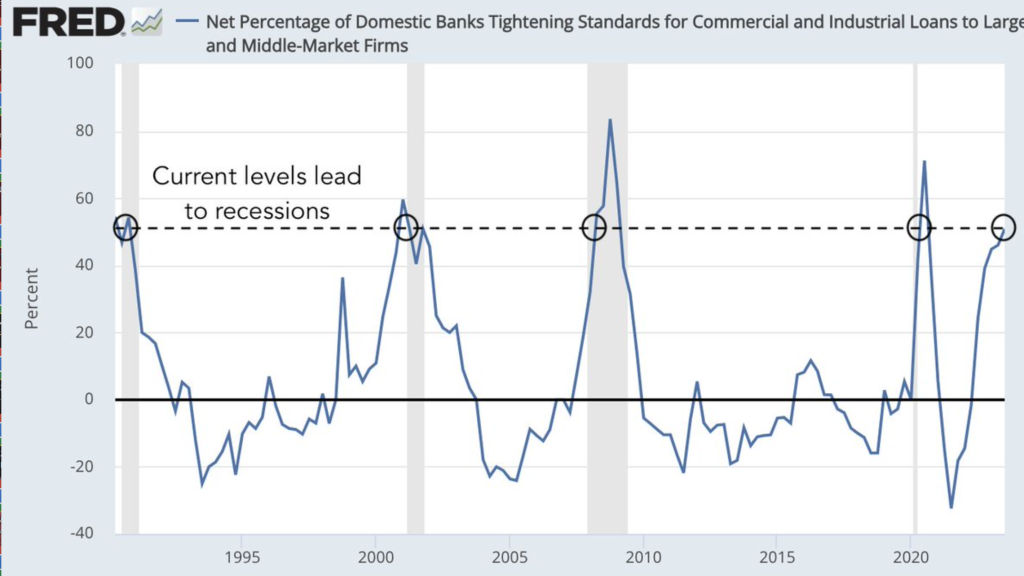
It shouldn’t be a surprise to see this rise in bankruptcies as banks tighten their credit standards. We are seeing investors pulling back on deploying capital while banks also reduce lending. Banks (especially small/medium banks) are grossly over levered to the commercial and residential real estate markets. The rapid increase in rates caught them “flat footed” causing many of them to become insolvent or at least cash strapped reducing their lending capacity.
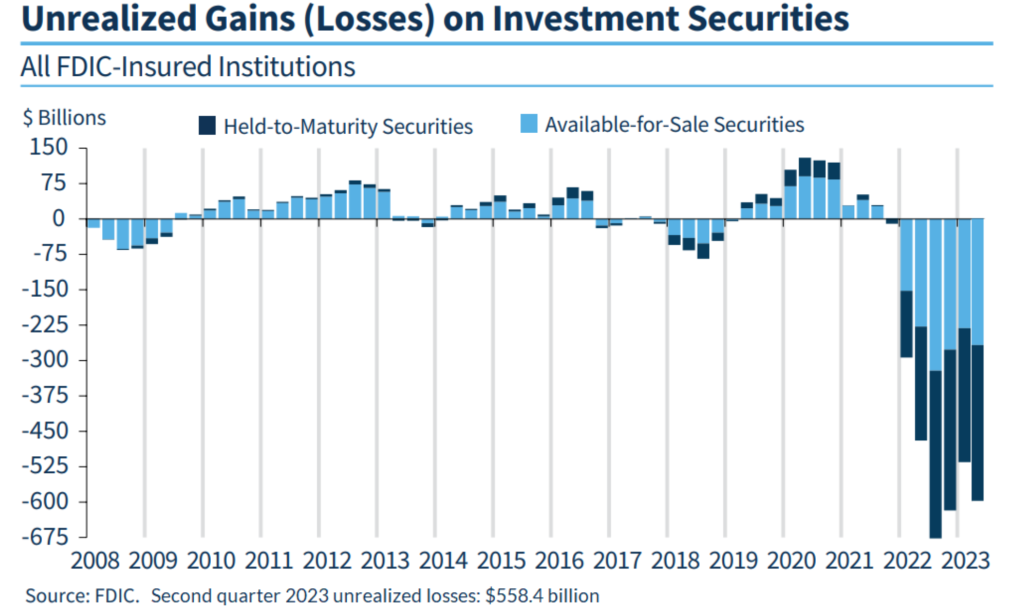
When we turn to the unrealized gains/losses at the FDIC- you get a sense of the underlying stress within the system. I think the below chart helps put into perspective the issues when comparing it to other recessions and slowdowns. This has all been driven by a rise in rates, which the Fed never stress tested over the last 15+ years.
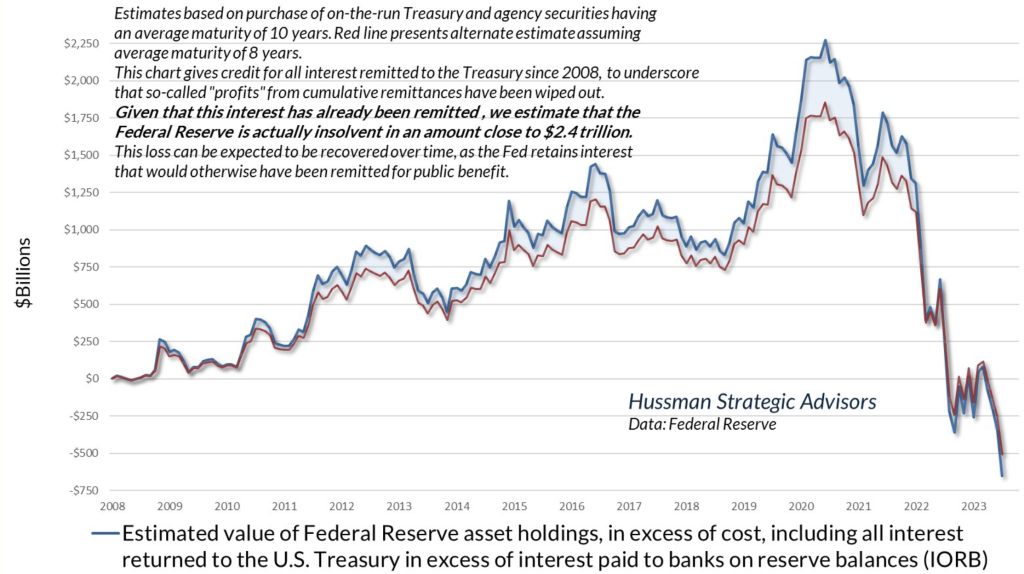
It should be no surprise to see a similar issue happening now at the Federal Reserve. Their asset holdings have shifted to being MASSIVELY negative, which means that the interest is paid by printing. It’s a backhanded way to keep a certain amount of QE (quantitative easing) in the system while they “claim” QT. “Bank unrealized losses have a similar profile (per FDIC). Now consider that over 40% of deposits are now uninsured, because someone has to hold the reserves the Fed forced into the system.”
Rates moving higher is something that should have started at the beginning of 2022 with the stop in QE easily by the end of 2021. MBS should NEVER have happened, but at least should have come to a complete stop by the end of ’21 as well. The Fed now finds itself in a position where only rising rates can help bring the market back into balance. We still expect one more rate hike in November, and the Fed funds target rate is showing something very similar.

Another “shock” to the market is the likelihood that the Fed keeps those rates much longer than initially expected. This was our base case scenario, but a shock to the rest of the market. The pressure in the near term will keep the short end yields elevated, which will eventually bleed further down the curve to the longer duration assets.

The drive higher in rates in the U.S. will have a big impact on a global level as we see more pressure moving into the Emerging Markets. Bank lending is dropping in developed markets, but we expect the EM side to close the gap quickly and fall faster than the developed world.

Many of the emerging markets rely significantly on exports, and the recent bump has now completely faded with more downside coming over the next several quarters. The below pricing chart for shipping puts into perspective some of that slowdown.

The reason it will be several quarters is driven by the length of time it takes for the central bank tightening to impact underlying economies. The U.S. will see the “maximum” impact as we head into Q4 of this year and throughout at least the 1st half of 2024.

We have been saying that the Fed can’t let off the pressure as CPI and underlying inflation pressures shift higher once again. When you compare it to the 70’s- they started to lift the pressure at this point and brought about a massive wage price spiral. This spiral resulted in the need for a huge spike in rates, which is something the Fed wants to avoid. The acceleration of CPI and backdrop of rising energy prices and other input costs is going to complicate their endeavors. It will keep rates elevated and tight for much longer than the market believes.

One of the biggest issues the Fed faces is trying to break home prices. Home prices and rent account for almost 40% of CPI, and the increase is going to complicate their long term goals of capping inflationary pressures. The only solution to the below chart is to either break home prices or let wages rise considerably.

The Fed is trying to create a controlled QT by paying their interest with “printed” money and push rates higher that can help people pivot from the RRP back into Treasuries. We will keep seeing the pivot over the coming months, which is actually a good thing for the market- in the long run.

The important impact points is the rise in prices paid as new orders remain in contraction.
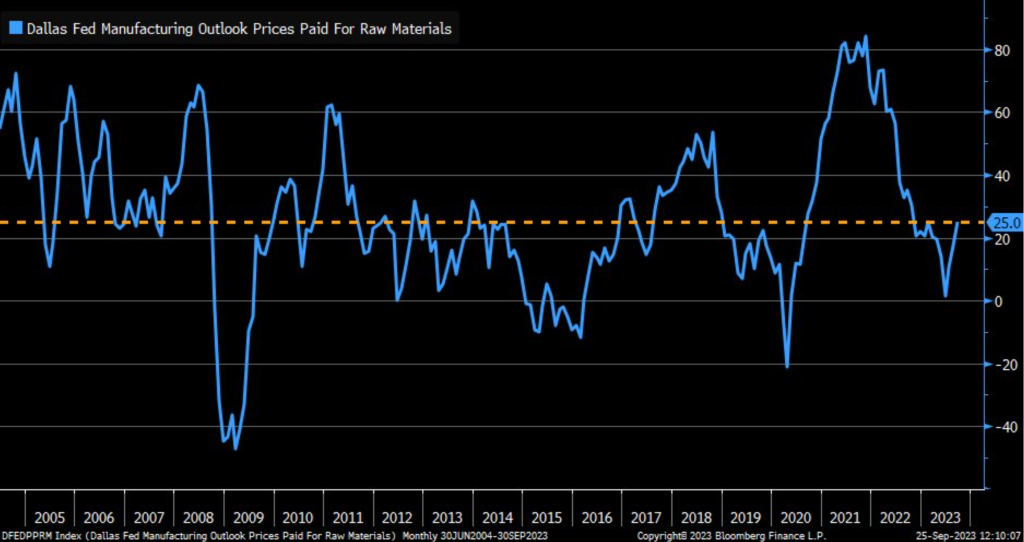

New business is falling again- but the bigger impact this time around is it happening across the service sector. The service side of the economy has been supporting activity, but as that rolls over- we get a much bigger correction on an economic level.

China has a bunch of holidays this week- Autum festival and golden week, which has driven up some near term demand. We see some of that pulling back over the next few weeks, but it will provide a needed bump in the near term. “More Chinese travelers are delaying outbound plans amid economic uncertainty, according to a new survey, potentially rough news for countries depending on one of the world’s biggest source of tourists. A September survey by consultancy Oliver Wyman found that 54% of respondents — all experienced travelers who had been abroad before the pandemic shut Chinese borders — said they planned to travel in 2023, down from 62% polled in June. Some 22% said they didn’t have plans to venture overseas for the next three years, up from just 6% in June.”

The issues are going to remain in the Chinese system as savings stay very high. The problem is the net losses many of the consumers have taken from real estate. So even though the Chinese savings looks elevated, it doesn’t mean there is a lot available for investment or consumption.


“Even with its excessively high investment rate, China suffers from weak domestic demand mainly because the consumption share of GDP is so extraordinarily low, and this will be made all the more difficult as China is forced by debt to bring down the growth rate of investment.
China must bring down its savings rate by 10-15 percentage points of GDP, Wolf points out, and it has no choice: one way or another it will. But there are broadly two ways this can happen. The bad way is with a sharp drop in GDP growth.
In that case GDP growth would fall more sharply than consumption growth, with the result being a reduction in the savings share of GDP. This could happen quickly, as with the US in the early 1930s, or slowly, as with Japan in the 2-3 decades after 1990.
The good way is with a sharp rise in consumption growth. But, as Wolf pints out, what drives such low consumption is mainly the low household income share of GDP. So more rapid consumption growth requires more rapid household income growth.
But how to raise growth in household income while reducing growth in the very investment that has so substantially underpinned economic activity? The only way is through transfers. China must transfer roughly 1.5% of GDP every year from local governments to households.
That’s why it is so difficult. For decades China has built its economy around hidden transfers from households – in the form of weak wage growth, low real interest rates, undervalued currencies, etc. – that subsidized Chinese investment and its manufacturing competitiveness.
Not only must these transfers be eliminated, they must be reversed. That almost certainly requires a major restructuring of the economy, along with the political, business, legal and financial institutions that were built around 2-3 decades of these transfers.”
The pressure remains from the over exposure to the housing collapse, and the fact the “consumption push” in China never really materialized. There was a lot of promises made from 2010-2020 on how the Chinese consumer would be unlocked… instead it died before it ever came out. All the while- investments from the government are piling into “dead projects” that aren’t actually covering interest or principal.


Debt is too high and growing too rapidly, he notes, but the risk for China, is not that it might suffer a financial crisis.
“China is a creditor country; its debts are overwhelmingly in its own currency; and its government owns all the important banks. A policy of financial repression would work quite well.” Beijing, in other words, can always manage to service debt through hidden transfers.
“The danger is rather one of chronically weak demand. The investment rate is already spectacularly high, while growth is slowing. Still higher non-property investment cannot be justified.” That’s the key point. Weak demand is at the heart of China’s many economic problems.
Governments are already supporting local banks, while they struggle with their own over levered balance sheets. The steep drop in real estate sales has limited their cashflow resulting in their reliance on LGFVs and special purpose bonds.


These assets are already grossly overused and resulting in new issuance of LGFVs with shorter durations and higher rates. So even though the “peak” is coming of maturaties- the issues are far from over. Governments are unable to extend that maturity wall or reduce their debt expense- instead- the exact opposite is happening.


A large amount of local government financing vehicle (LGFV) debt is scheduled to mature this year. According to Gavekal, many LGFV projects generate low or no returns, which means officials will probably roll over maturing debt in the coming months.
The property slump has lowered local government income from land-use rights sales.
These pressures are creating a lasting impact that will take time to fix, and likely result in a “lost decade” as the Chinese economy restructures itself. While that sounds easy, the CCP is pushing hard against the meaningful adjustments that must be done, and we fear there is another shoe to drop.

As foreign investment (FDI) shifts elsewhere and companies leave China- the problems will get compounded as revenue generating assets leave. The new loss of tax revenue will be another slam to government balance sheets that are already struggling to survive.

The issues are compounding as more pressure comes again from the real estate/housing market. More on that fun topic next week!

