Industry Outlook
In our recent article, we have already discussed Halliburton’s (HAL) Q3 2023 financial performance. Here is an outline of its strategies and outlook. HAL’s management appears to be banking on the long-term investment in energy production following OPEC’s latest outlook. OPEC now anticipates global crude oil demand to grow by 10 million barrels by 2030 and expects further demand growth through 2045. As a result, demand for oilfield services will continue in the short-to-medium term.
HAL’s North America Strategies
Halliburton’s North American business has become more resilient despite a 20% rig count reduction since the start of the year. HAL’s quarter-over-quarter revenues decreased by 3.3% in Q3. So, HAL bucked the trend as compared to the prior cycles or to its competitors. The exploration & production industry, over the past few years, has consolidated and become more focused on returns. Since 2015, the company has been working on changing its business model and strategy to maximize value. It has retired old equipment that does not meet the minimum returns criterion. It does not proactively seek to pursue market share. It now builds fracturing equipment under long-term contracts.
The process changes resulted in a 68% improvement in hours pumped per crew in the past four years. The company also invests in differentiated technologies, such as Zeus electric fleets, automation, and fiber optic downhole fracturing diagnostics. Following this business model, the company de-risked its returns and removed $1 billion of fixed costs.
International Market Strategies
Internationally, HAL’s management expects the oilfield services to tighten as asset-intensive offshore activity increases. It pivots pricing returns to serve as the mechanism to allocate scarce equipment. It plans on delivering “high teen” growth in 2023 compared to 2022. In 2024, the company expects market growth in the “double-digit range.”
The offshore market has become a decisive part of the company’s strategy. Currently, offshore accounts for 50% of its business outside of North America onshore. HAL generated 25% of the Completion & Production (or C&P) segment revenue from offshore, while 40% of its Drilling & Evaluation (or D&E) segment revenue was generated offshore.
Some prime offshore initiatives include the Aker BP Alliance, where Halliburton provides well construction services. It also serves technically complex wells, including high-pressure, deepwater completions, ultra-deep reading LWD tools, drilling fluids, and tailored lightweight cement.
HAL’s Q4 forecast
In Q4, Halliburton expects its Drilling & Evaluation division to increase by 4%-6% while its operating margin can improve by 75 to 125 basis points. The Completion & Production division revenue can decrease by 3%-5% in Q4 compared to Q3. Operating margins in this segment can also decrease by 25 to 75 basis points. A fall in North American onshore activity due to the typical seasonality can cause the C&P segment performance to deteriorate in Q4.
Key Q3 Drivers
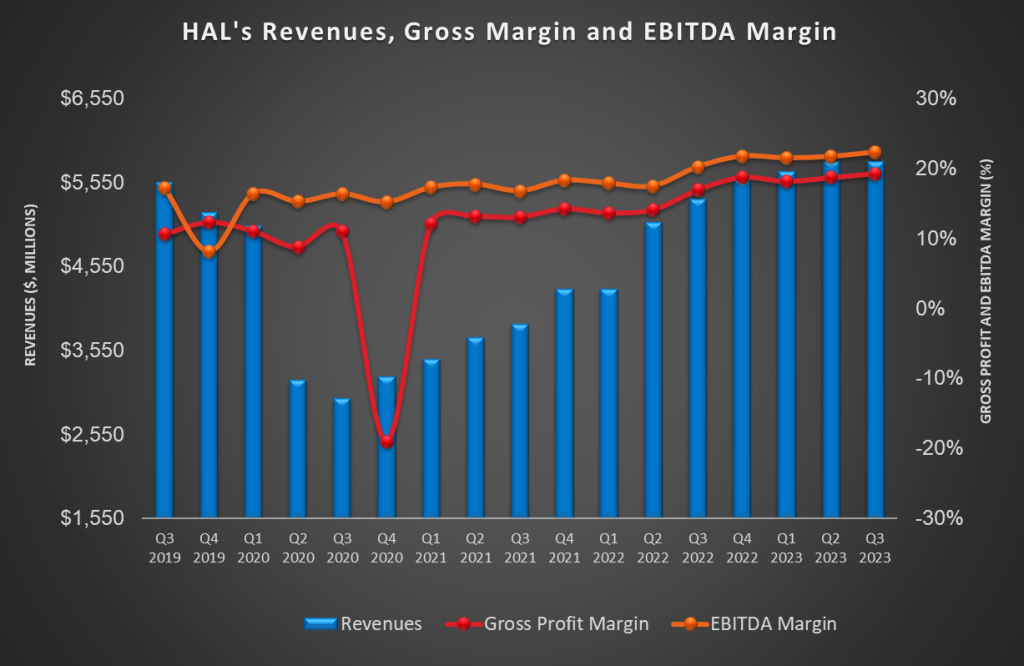
Quarter-over-quarter, HAL’s revenues remained nearly unchanged in Q3. Its gross profit margin and adjusted EBITDA margin expanded modestly during this period. Region-wise, lower revenues from North America were offset by better performance in international operations. A better offshore market primarily benefited the completion and production division operating margin in Q3. Read more on this in our Halliburton: Take Three article.
Cash Flow & Balance Sheet
HAL’s cash flow from operations improved remarkably (90% up) in 9M 2023 compared to a year ago. As a result, its FCF turned increased by 156% in 9M 2023. Although capex was 7% of its Q3 revenues, it can decline to 6% in FY2023. Lower capex can result in higher free cash flow (or FCF). It plans to generate ~$2 billion of free cash flow in FY2023.
HAL’s debt-to-equity decreased from 0.91x in Q2 to 0.85x in Q3. However, it remains higher than many of its peers (SLB, BKR, and FTI). During Q3, it repurchased $150 million of debt. As part of its policy of returning at least 50% of free cash flow to shareholders, the company repurchased $200 million of its common stock during Q3.
Relative Valuation
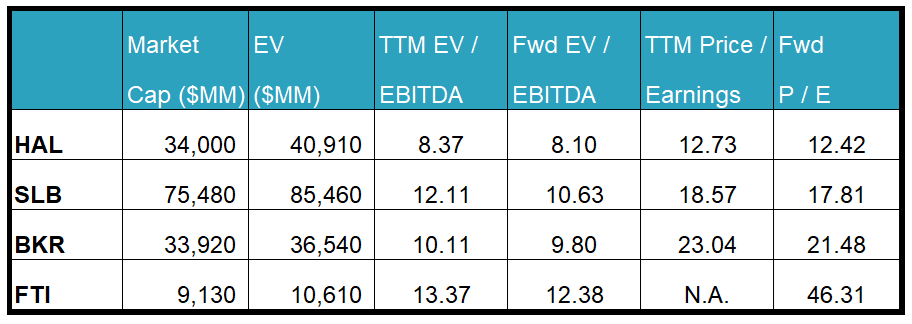
Halliburton is currently trading at an EV/EBITDA multiple of 8.4x. Based on sell-side analysts’ EBITDA estimates, the forward EV/EBITDA multiple is 8.1x. The current multiple is lower than its five-year average EV/EBITDA multiple of 11.2x.
HAL’s forward EV/EBITDA multiple contraction versus the adjusted EV/EBITDA is less steep than peers because the company’s EBITDA is expected to increase less sharply in the next four quarters. This typically results in a lower EV/EBITDA multiple than peers. The stock’s EV/EBITDA multiple is lower than its peers’ (SLB, BKR, and FTI) average. So, the stock is reasonably valued versus its peers.
Final Commentary
Based on a long-term recovery cycle, HAL’s management expects demand for oilfield services to improve in the short-to-medium term. Over several years, it has changed its business model, focusing more on value maximization. The company outperformed the US drilling activity in Q3. It builds fracturing equipment under long-term contracts and invests in differentiated technologies like electric fleets, automation, and downhole fracturing diagnostics.
Offshore has become a key focus area because of increased asset-intensive offshore activity. It looks to tap opportunities in high-pressure, deepwater completions and ultra-deep reading LWD tools. The performance of the Aker BP HAL alliance is a point in this case. However, the US onshore activity drop and the adverse effects of fourth quarter seasonality will affect its Completion & Production division in Q4. On the other hand, the Drilling & Evaluation division will likely grow in the near term. Expect free cash flow to improve with steady cash flow from operations and lower capex. This, plus improved shareholder returns through share repurchase, should increase returns from investing in the stock. The stock is reasonably valued versus its peers at this level.