The crude markets have found a footing with an increase in geopolitical risk and strength in the physical market. Yemen successfully crippled a U.K vessel that was earlier reported to have sunk, which is actually listing on her side. It received two catastrophic hits disabling her engine room, and the other impacting the deck of the ship. The sailors were moved to safety, but an attempt to tow the boat to the nearest boat hasn’t been done yet. This is a serious escalation as a flagged vessel is under the sovereign protection of the flag state. So by striking a U.K flagged vessel is similar to striking U.K. sovereignty. To date, the U.K hasn’t responded while there have been additional interceptions of one-way suicide drones, boat drones, and ballistic missiles.
The longer this goes on- the more likely the U.S. and her allies will be to sink the MV Behshad , which has been deemed a spy ship for the Houthis. When the U.S. launched attacks following the death of several soldiers, the Behshad moved to the Chinese naval base in Doraleh- near Dijibouti. During the time of Behshad’s absence, there were no attempts to hit passing vessels. The U.S. followed this with a cyber attack on the Behshad providing false information, which the Houthis utilized to fire missiles to the coordinates.
It appears the U.S. is gaining enough evidence to prove this is a spy ship impacting global trade before taking decisive action. This will be a big escalation because Iran will claim it was an attack on their sovereignty, which could ratchet up tensions in the region depending on how Iran responds. In the meantime, Israel and U.S. have hit high ranking operatives in Iraq (Baghdad). The strikes in Baghdad resulted in protests and renewed pressure to push the U.S. out of the region. Even though the U.S. talked about plans to reduce their presence, it was purely to appease the media and politicians, which has quickly died down.
An important one to also watch is Guyana and Venezuela because Latin America (especially Guyana) is one of the main production growth hubs. I don’t believe Venezuela will risk a military clash, but we are living in special times so nothing can be ruled out. The U.S. already has military assets in the region, which will help support any military activity for Guyana.
The shift in geopolitical activity has provided another boost in premiums that will likely hold for the next several weeks. The reason the premiums will hold is because of the amount of front-loaded physical buying that’s taking place. There have been some concerns about the length of time it would take for the crude to reach its destination. This has resulted in tightening of spreads/ differentials across multiple crude grades. It has also pushed up the crack spreads for diesel and gasoline globally, but this should slow down as demand for refined products remains limited.
The shift in crude flows and rising geopolitical risk has pushed our Brent range to $78-$84 over the near term. We should probably live in the $80-$82 range until refiners complete their purchases for the spring refinery run push following winter turnaround season. Turn arounds started earlier than normal in the U.S., which has put more crude in storage. We should see more crude getting put into storage as refiners go into turn around early and the lagging crude flows show up onshore.

The above chart highlights just how slow the gasoline market is going back throughout the last few years. We are well below the 5-year average and 2023. The number is likely a bit too low as GasBuddy has something a bit stronger, but nothing that would put us anywhere near the 5-year average.
Trucking in the U.S. looked like it was going to continue to recover after January was a strong month for the logistics market. One of the things I have discussed was the importance of follow through in the trucking/logistics market. Companies still need to have products and inventory, and they can only delay shipments for so long. During recessions, the trucking market tends to be “lumpy” as you get bulk buying, and this January was no different. I think these are great comments from Craig Fuller of FreightWaves: “I’ve heard from multiple CEOs with large transaction portfolios connected to the trucking spot market about how abysmal February has been. One described it as the beginning of the end of the “great flush out” for small carriers. “January was a head fake” said another.” I described it as a “head-fake” and the comments above put into perspective just how deep the drop has become. Between a very underwhelming winter for heating demand and another drop in trucking demand, it will be difficult to see distillate demand climb higher.
As we evaluate the global crude market, we have seen a strong bump in exports, which is (at times) more important than production. A country can reduce production while either maintaining or increasing exports. When we look at total barrels on the water- everything is showing to be flat. The deviation is “how long” its taking crude to reach their end destination.

China was a big buyer over the last two or so weeks to make sure there is sufficient crude for the run up in April. “Chinese refiners have step up crude oil buying for April delivery in anticipation of a surge in demand during the second quarter. Refinery output between April and June last year saw a significant rise of 600kbd compared to the previous quarter.” This is very much seasonally normal as you look at the run up that happens in April and June on a normal basis. Normally Chinese diesel demand rises from March on as construction and agriculture activity picks up seasonally. I believe that this will fall flat again this year as lending has slowed and underlying economic weakness remains in the Chinese markets.

Here is some of the support for rates spiking as we saw China as a bigger buyer: “VLCC rates from the Middle East to China hit an 8-month high of $2.90/bbl at the end of last week, up more than $1/bbl since the start of the month, (+60%). The surge in rates was predominantly driven by vessel demand in the Middle East, with rates from the Atlantic, up just 15%.”

But even as China bought more, we saw more supply come to market- especially from KSA. Saudi has already made comments regarding their “frustration” when it came from cheating or countries pumping above their allotted quantities.

Russia and Iraq are just two examples as you can see in the below figures.
Russia’s seaborne crude shipments rebounded strongly from two weeks of disruptions. Libya to increase its crude exports to 16-month high of 1.08m b/d in February.
- Russia’s Seaborne Crude Exports Surge After Disruptions End
- Flows jump by 900,000 barrels a day on recovery from storms and maintenance.
The below chart shows the amount of products that are avoiding the suez canal with a large part of it being goods.

On the crude and product front, it’s mostly Arab, Russian, and Chinese cargoes that are flowing through the Red Sea. Since Europe isn’t buying Russian product, these volumes are going directly into the Asian markets.

Products are the ones that are seeing more travel time, which will help support the diesel cracks in the near term- especially in Asia. This will be an important one to watch over the next few weeks as diesel cracks support current runs. Given the issues in the Red Sea, we don’t see any improvement on sailing times that will help support distillate cracks in the near term.

Even though physical prices spiked, we are seeing them cool off a bit. It isn’t huge, but we are seeing some slowdown in premiums.
PLATTS:
- Totsa sold 90k tons of CPC Blend for March 13-17 delivery to BP at Dated -$4.10/bbl, CIF Augusta: traders monitoring Platts window
- BP also bought 650k bbl of Azeri Light from Socar for March 14-18 at +$3.80/bbl
- Compares with +$3.95 for previous deal on Feb. 9
The U.S. is also exporting at record levels as U.S. refiners going into maintenance earlier than normal. The U.S. will likely maintain the current run rates, which will fall closer to seasonal norms as we progress into March. You can see from the chart below how early we entered into turn around season. The first drop occurred because of weather, but it was quickly followed by economic reasons to go into turn around sooner.

I think these are good charts putting into perspective the weakness in the distillate and gasoline markets.

The upcoming OPEC+ meeting is going to be interesting as KSA has already made comments about overproduction, which has persisted given the below data. It’s also important to remember that this is based on reported volumes, which means it could be higher. As I described above, it’s important to remember that exports can still move higher even as production stays flat or falls. This will be a point of contention as we head into March/April.
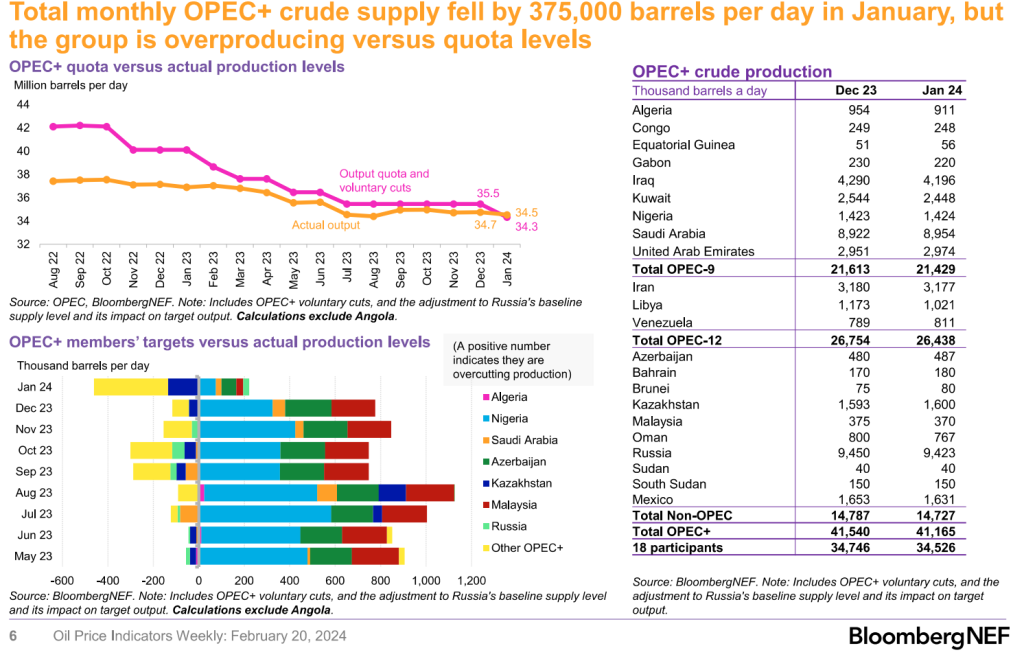
The reason this will be discussed heavily is driven by the fairly balanced crude market we sit in at the moment. As the global economy faces more pressure, there is a growing concern about a surplus in the market. Geopolitical risks still remain that is going to help keep us elevated, but you get an idea of the risks from an economic perspective. Japan “unexpectedly” entered into a recession as Europe and other regions aren’t far behind. This puts the “demand” side of the equation under way more pressure.
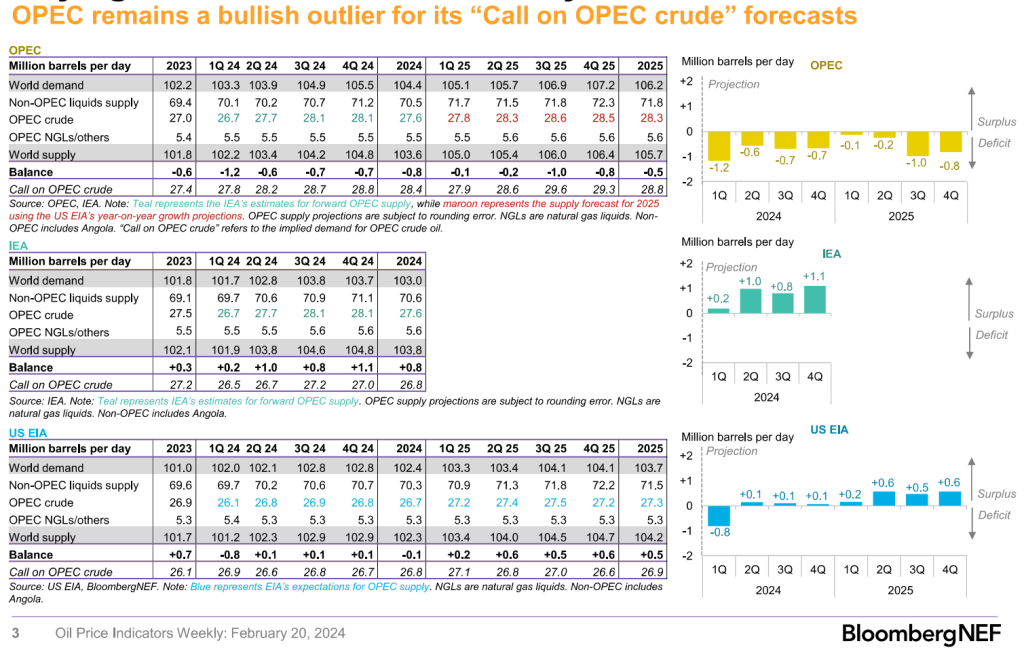
The market is ignoring the amount of crude that is “delayed” getting to their ending location. We had a big “make-up” number this past week, which is inline with my comments at the beginning of February. There was an expectation that this was more permanent, but instead, you had crude that took longer to get into the land storage market.

You could see this shift from the floating market as more crude went into “transit” and is taking longer to get to the floating or land storage final destination. This will continue to adjust over the next few weeks that will help “soften” some of the bigger spreads/differentials. They will still remain “stronger” because of the additional costs for shipping based on day rates, distance, insurance, and other variables.

When we look at the market at the moment: Dated Brent, benchmark used for Russian oil, is at $85, minus $19 quality discount adds to $66. Cap is $60 so their math proves it doesn’t work. Quality diff is actually around -$13 to -$15 not -$19 so higher. India has started to pick-up some additional barrels in the near term, as they have avoided Iranian volumes over the last several weeks.
On an economic footing, the world is facing a massive debt bubble that grew to a new record in 2023. IF Global Debt Monitor: World debt reaches new record high of $313 trillion in 2023, adding a fresh $15 trillion to the global debt mountain. Debt-to-GDP ratio in emerging markets reached new highs. The market continues to ignore the emerging market pressure that exists on a debt level, which only gets worse as GDP slows further.

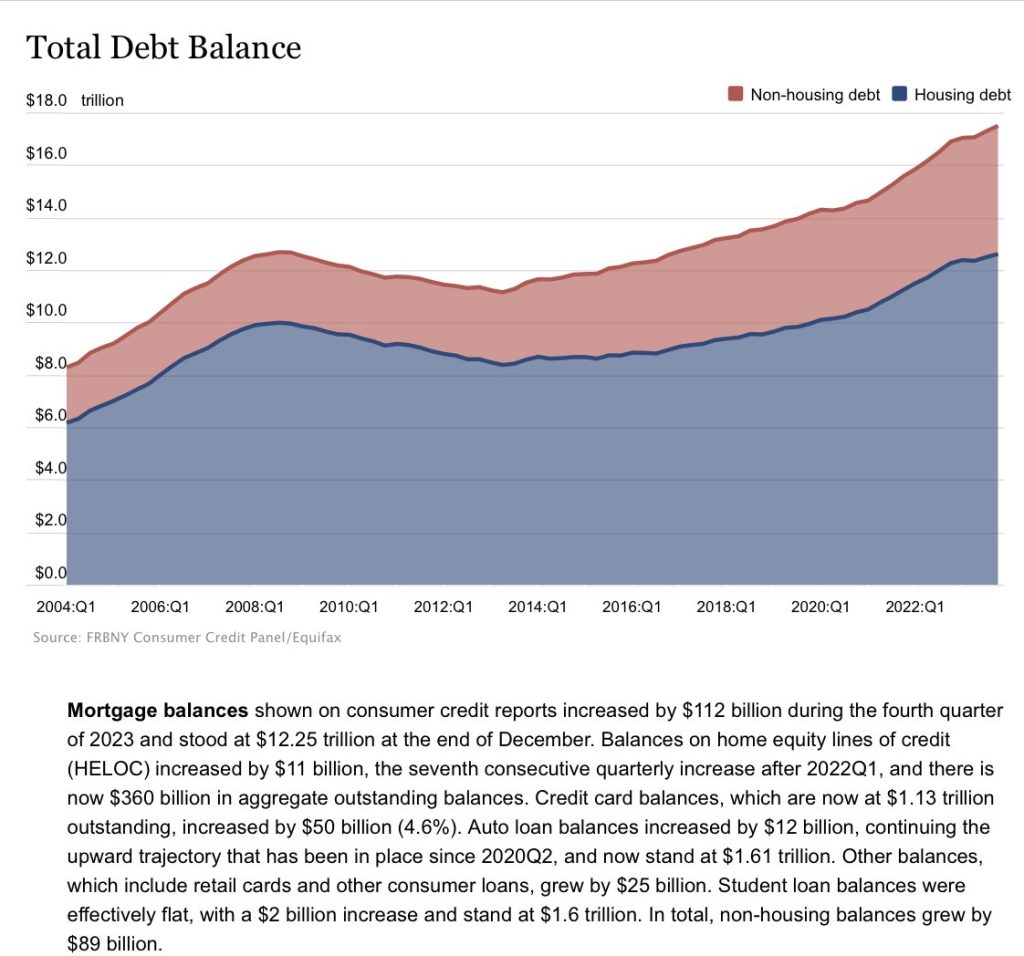
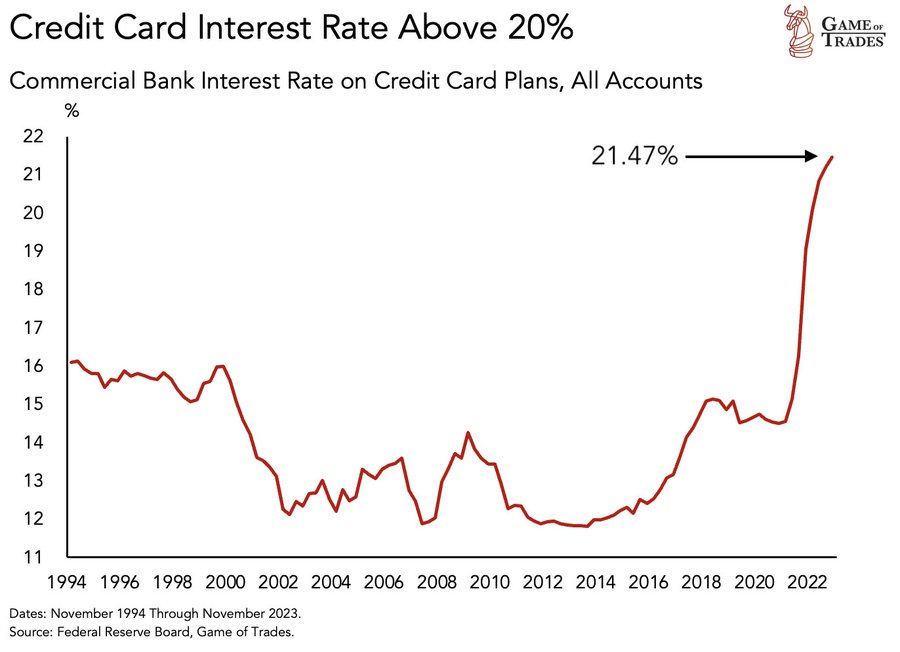
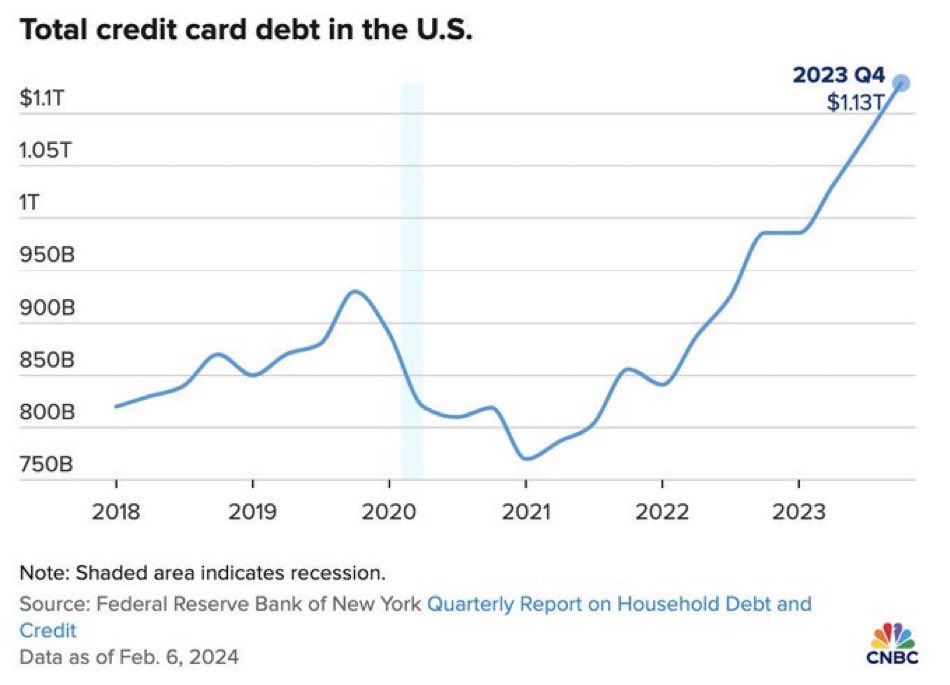
The U.S. is also front and center when we look at the amount of debt sitting on balance sheets. This is only made worse as credit card debt compounds north of 20% APRs. Consumer debt swelled by $212 billion in the last quarter of 2023, which just keeps layering in more pressure on spending. “Credit card annual percentage rate margin cost is at an all-time high, about $25 billion extra each year, per Reuters.”
Here is a breakdown of the credit card interest rates, which will clearly lead to additional delinquincies. They have already hit huge levels, but it will continue to get worse- Delinquency rates on credit cards and auto loans spiked to their highest since the Great Recession, per Reuters.
When we turn to China, the data doesn’t improve as businesses and indivudals try to sell off assets abroad in order to pull money back into China. From the perspective of housing prices, they continue to weaken, but at a much slower pace: China’s January home prices dropped by 0.37% m/m, the decline expanded compared to -0.45% in December.

There has been a considerable push by China to bring back foreign investment. In 2023, it fell to the lowest level since 1993. FI has picked up a bit in 2024, but I don’t expect to see a huge increase as we progress through the year.


The last piece to touch on is the spending in China following the Lunar New year. One of the key pieces I have spoken about is more people are traveling BUT spending less. The key metric to look at is: “What’s more, expenditure per capita remains below 2019 levels, meaning more folk are traveling but not necessarily spending.”
Lunar New Year (LNY) travel and spending surpassed pre-pandemic levels.
Data from the Ministry of Culture and Tourism showed that between Feb 10-17:
- 474 million people traveled domestically, up 19.0% compared to 2019
- Domestic tourism revenue hit RMB 632.7 billion, up 7.7% compared to 2019
The numbers were up massively compared to 2023, when the economy was reeling from the abrupt reversal of zero-COVID controls.
- Domestic trips and spending increased 34.3% and 47.3%, respectively, from 2023 levels.
Get smart: It’s certainly good news that holiday travel continues to outstrip pre-pandemic levels.
Get smarter: However, the data doesn’t signal a broader recovery in consumer sentiment.
- This year’s increase in travel is partially a manifestation of “revenge traveling,” as many consumers have not traveled over the past four LNY holidays.
- What’s more, expenditure per capita remains below 2019 levels, meaning more folk are traveling but not necessarily spending.
The below data shows that on a seasonal level- travel followed very closely to last year. The bigger issues remain the level of consumer spending. More people traveled, but the consumer remains skiddish on actually buying goods.

As the debt pressure mounts globally, there will be “less” money to push back into the Chinese markets. Many investors have been hit hard with refinancing costs, and as CAPEX spending slows and nearshoring/onshoring become core- there won’t be a huge amount of money flowing into China. The below chart on trade flows help to highlight how “Globalization” has capped off with little chance of a new push higher.

Global financing conditions have loosened, which is going to be a problem for central banks. They are looking to slowdown inflation, but we have seen it accelerate- especially in the U.S.


On a global manufacturing basis, we are seeing stagnation reign supreme, and there is little to show the global economy is going to shake out of these current levels.

All of the leading indicators continue to point to broader slowdowns and trends holding in a contractionary footprint. “January decline was 23rd consecutive fall for Leading Economic Index from Conference Board having surpassed streak in early/mid-1970s; only other comparable streak was during GFC”. The below data is interesting because we have NEVER seen this level of negative LEI data without already being in a recession.

Even as the data fails to show the pressure, it’s being felt fully at the consumer level. When that translates to a bigger slowdown in spending is anyone’s guess- but we are definitely closer to the end than the beginning.

January retail sales were negative, and I expect to see that trend continue putting more pressure on the U.S. economy. As the U.S. consumer weakens, I expect to see more focus on banks- especially SMID caps as CRE data and coverage ratios worsen considerably. US banks now hold $1.40 in reserves for every dollar of delinquent commercial real estate loans, down from $2.20 a year ago, according to the FDIC data, and the lowest cover banks have had to absorb potential commercial real estate loan losses in more than seven years, per FT:

The U.S. monetary bases continues to expand, which will put more pressure on the Fed to hold firm at current levels.

I remain firm in my beliefs that we will see far fewer rate cuts from the Fed this year, and it’s unlikely we see one prior to the U.S. election.


