
The energy markets continued with their gyrations, and Brent has been sitting at the top of the range we’ve outlined heading into year end. We believe $68-$74 is where brent will live over the next several months, but it doesn’t mean we can’t get shifts higher depending on the broad geopolitical backdrop. We believe that it will settle between $71-$73 in the tighter range as we head into the new year. The overhang heading into next year remains the economic fundamentals facing the consumer, federal governments, and general economic activity. U.S. inflation data all points to a large acceleration into year end, which we believe will gain pace in Q1’25. This won’t help U.S. TSY bonds as inflation fears have already driven the back-end of the curve higher, but the budget deficit is now accelerating at the fastest rate on record. The Treasury will have to issue MORE debt to cover the shortfall- so not only do we have inflation driving up yields, but we now have MORE paper coming to market that has to be absorbed and find a “clearing” price.
The shift has been rapid following the unnecessary cut from the Fed reducing the Fed Funds Rate by .25%. As we’ve been saying, the Fed has lost control of rates, and any shift in the policy will result in the yield curve moving higher. The 10yr will be the pivotal driver, and we are starting the grind higher. There might be some “hopium” that slows the progress in Q1, but the basic assumption is for the 10yr to close 2025 between 5%-5.15%.
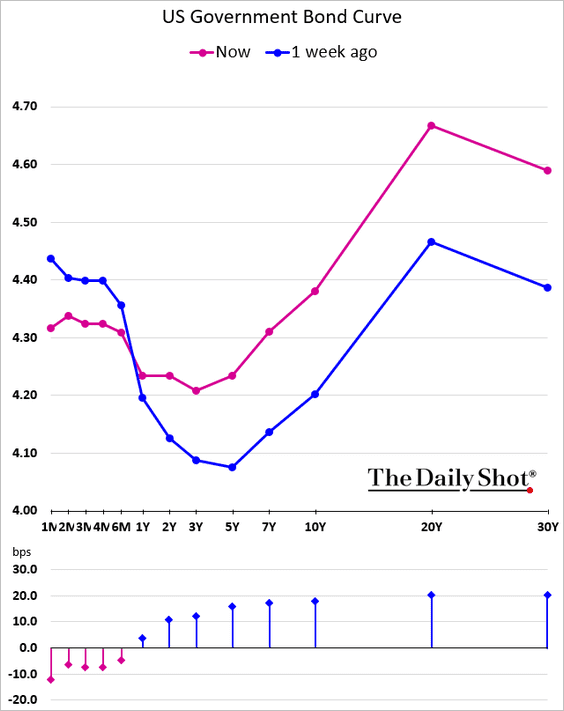
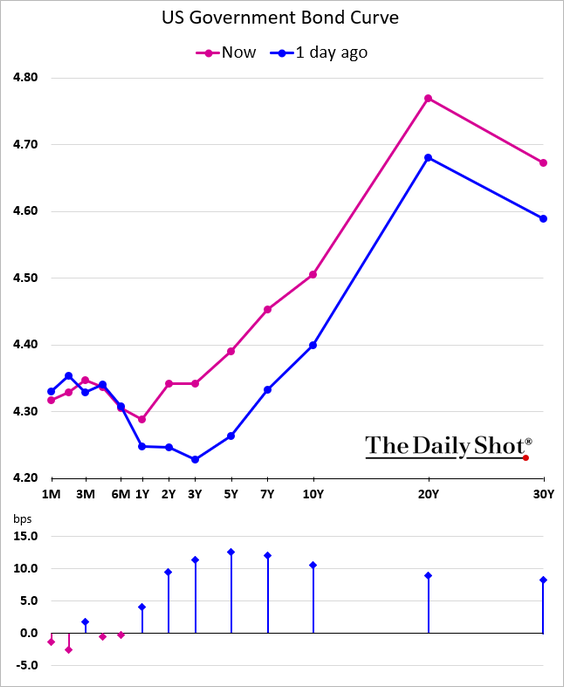
We expect to see the curve shifting higher, and given the broad dynamics- it’s becoming more likely the 10yr TSY will hit 5% by February. The pressure is only going to mount as the budget deficit accelerates and inflation kicks up in Q1’25.

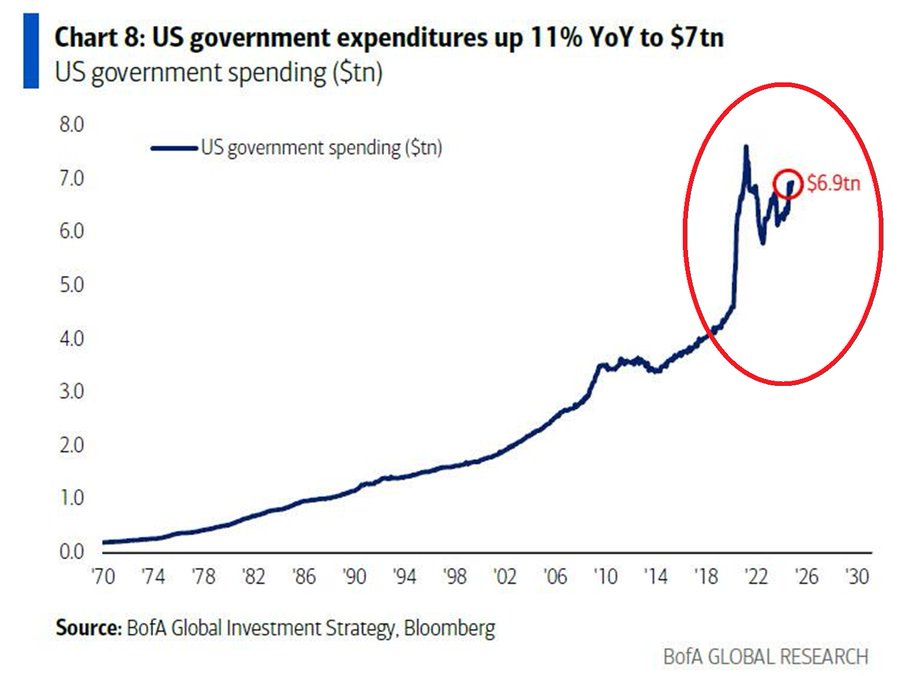
Government expenditures have surged again this year with additional spending happening like we are in a huge recession.
- US government expenditures hit a shocking $6.9 TRILLION, the most since the pandemic CRISIS.
- Since the Financial Crisis government spending has DOUBLED with the largest increase posted in the last 5 years.
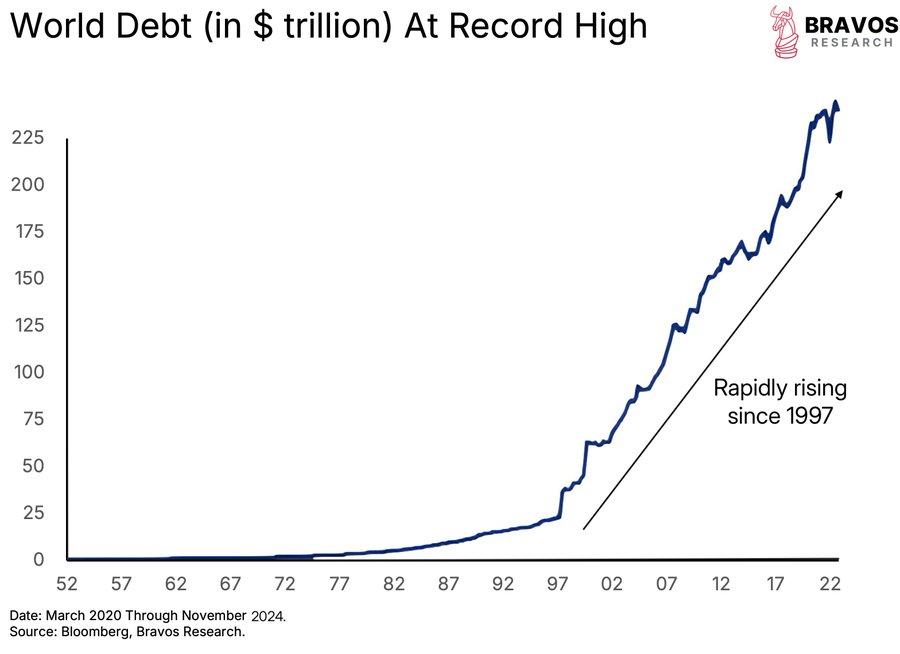
As we discussed in our previous insights, the debt bubble isn’t just a U.S. issue, but one that spans the globe. “Developing nations, already set for a turbulent 2025, are having to cope with ballooning interest payments on $29 trillion of debt that built up over the last decade. A record 54 countries are spending more than 10% of their revenues on interest payments, according to the United Nations. Some, including Pakistan and Nigeria, are using more than 30% of revenue just to pay coupons.”[1] The below chart puts into perspective just how much debt is being deployed just to cover interest, and as rates shift higher, the spiral accelerates where more debt is issued just to cover interest.
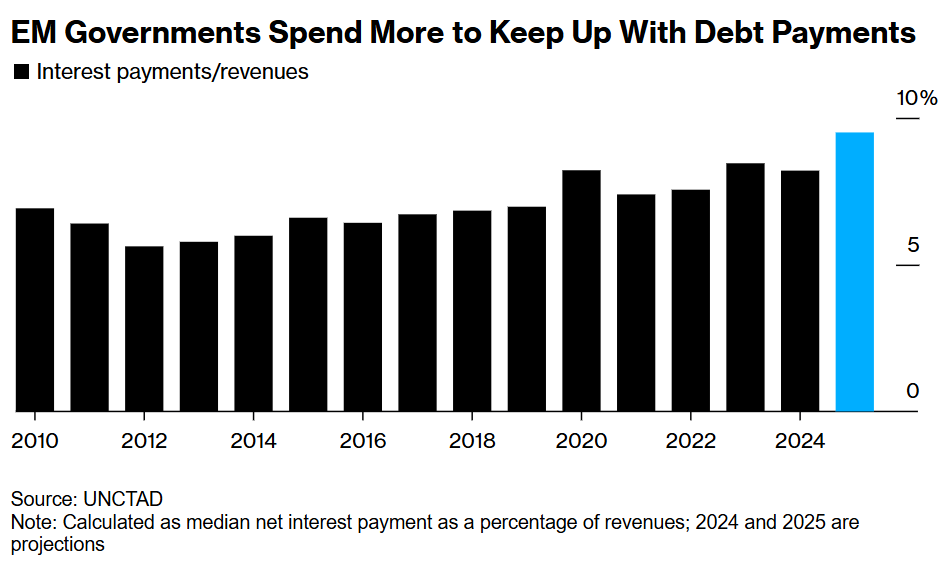
The world went into overdrive borrowing as we went through the mid-90’s, and the “experts” tried to say how “ZIRP” or Zero Interest Rate Policy would lead to success. Instead, it’s created a cycle that is running off the rails with inflation moving higher across the board and driving a debt spiral. All the debt below needs to be rolled and financed- especially as the developed markets continue to run extensive deficits.
The Fed cutting rates with a rapidly easing M2/M3 will help drive inflation higher, while the government continues to run an extensive deficit. U.S. GDP (just as China’s) is fueled by consumer and government borrowing with very little “productive” capital being spent.

Powell quoted how the economy grew faster than expected in the 2H’24, but you can see how most of the growth was created. GDP is calculated simply as C (consumer) + I (investment) + G (Government) + (X-M) or (Exports-Imports), and the C and G are being driven by debt. The government has been pouring money into the market at an accelerating pace to keep the merry-go-round greased. We now have additional easing on monetary policy while we never had ANY sort of tightening on the fiscal level.

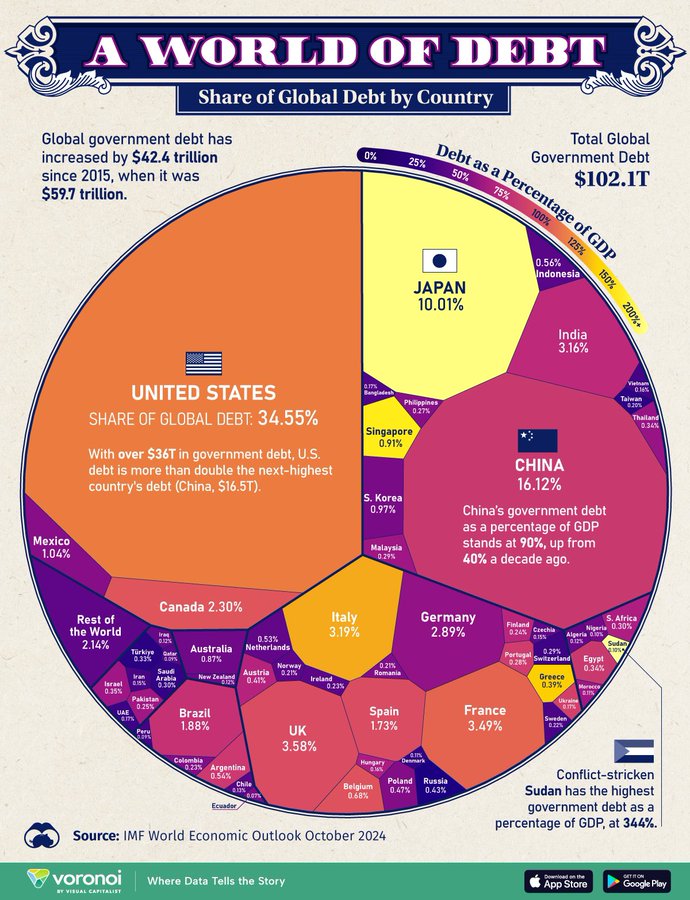
The U.S. is going to struggle to keep papering the market, especially as the global market is already saturated with U.S. holdings. In 2024, global public debt is forecast to reach $102 trillion, with U.S. and China largely contributing to rising levels of debt, marking a $5 trillion increase since 2023 alone; this Visual Cap graphic shows government debt by country in 2024, based on data from IMF News’ October 2024 World Economic Outlook. The U.S. remains a relative “safe haven” when it comes to USD, but the appetite for additional TSY is waning, which will keep pushing TSY rates higher.
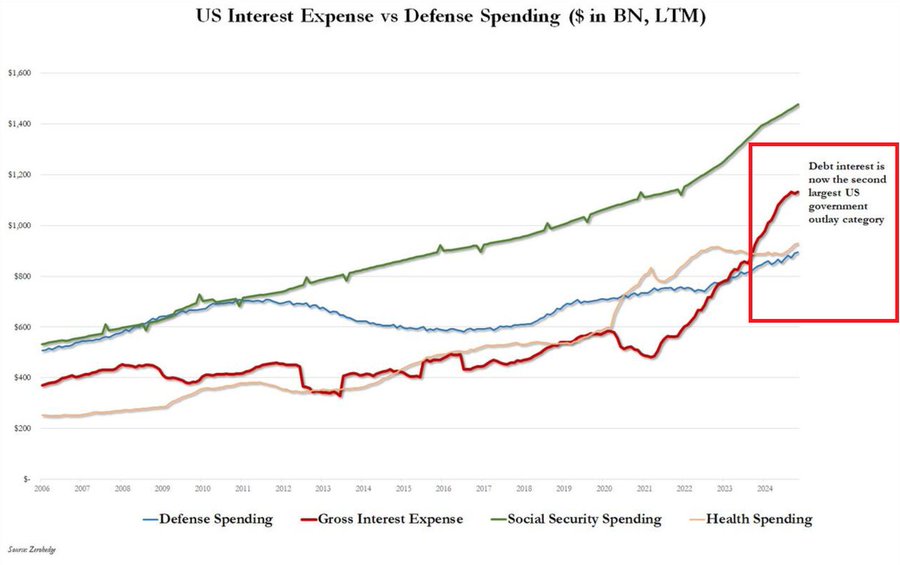
The level of U.S. debt creates a huge interest payment that will only grow over the next few quarters. Interest payments on US public debt hit a record of $1.15 TRILLION in the last 12 months. Interest is now ~$300 BILLION higher than defense and healthcare spending and accounts for the 2nd-largest outlay for the government after Social Security.
The carry trade has been a huge benefit by bringing investors into the U.S.- especially U.S. equities.
- Foreign holdings allocation to US stocks hit nearly 60%, a record.
- This share has more than DOUBLED over the last 15 years.
- Allocation to equities exceeds the levels seen at the 2000 Dot-Com Bubble peak Foreigners are all-in on US stocks.
As investors re-adjust their holdings, how much pressure will come into the equity markets? The carry-trade is getting more expensive- especially as the BoJ looks to increase rates next year. There was concern they would raise rates this week, but they kept everything flat while guiding to increases next year. Investors may try to get ahead of the increase and lock in profits.

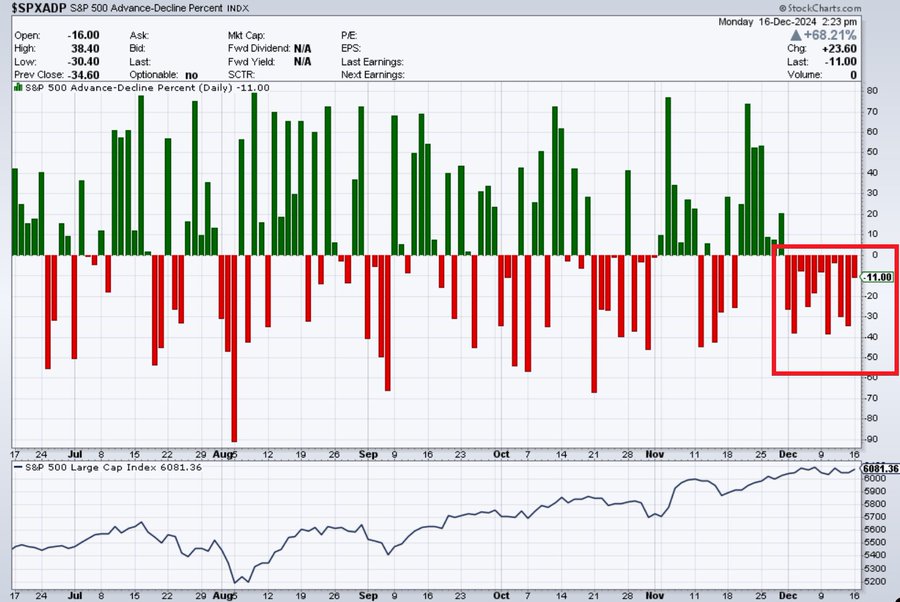
The breadth in the market is coming under more pressure, which usually indicates a broader pullback. There could easily be some performance harvesting into YE, and broad exhaustion on this recent run up in the stock market.

As the government pumps money into the market, the liquidity needs to find a place to go- leading to bubbles and pockets of surging prices. The tech sector has been the main benefactor from the increase in liquidity, but it also means that multiple compression could strike at any time. The driving factor of the reduction will likely be a change in the BoJ stance on inflation and rates. Inflation has kicked back up in Japan with the Yen hanging around the weakest levels since the early 90’s.
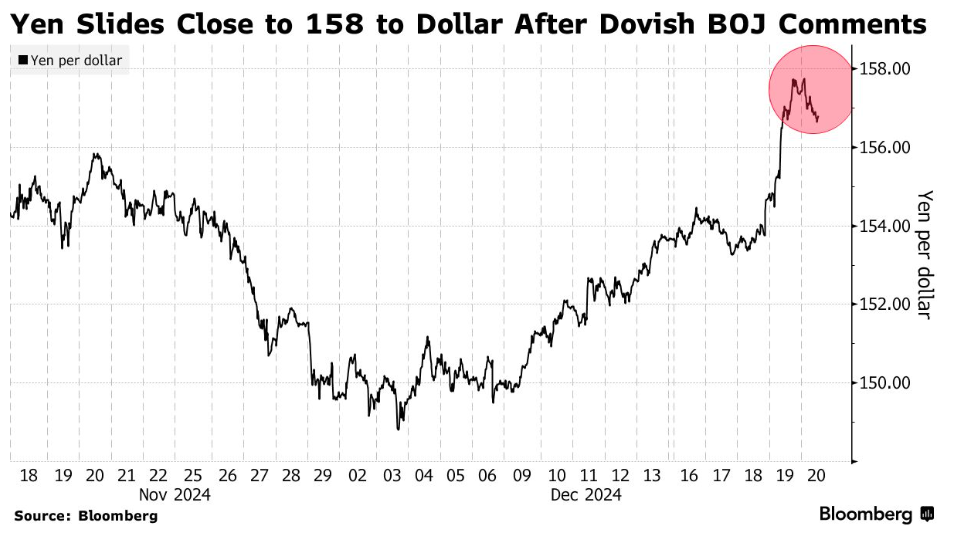
The BoJ has said that rate hikes are likely over the next few months: “On Friday finance minister Katsunobu Kato said that the government was “deeply concerned about recent currency moves, including those driven by speculators.” He warned that “we will take appropriate action if there are excessive moves in the currency market.”[2] There is growing concern around the inflation/ USD-JPY exchange rates, and any change in their policy will accelerate an unwind in U.S. tech stocks.
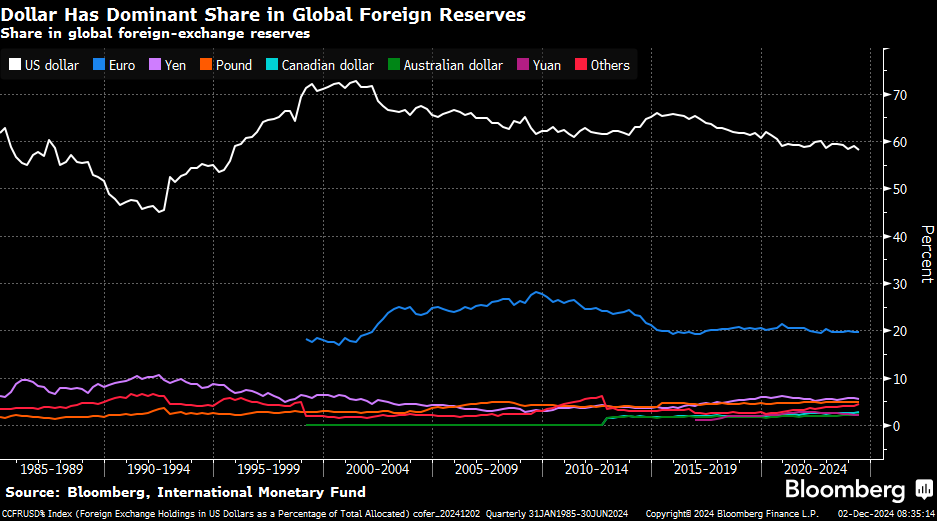
The dollar still remains a pillar of strength, but less so because the U.S. is strong. The US dollar is doing well because all other currencies are weakening. We don’t see the dollar losing its share of global foreign reserves- especially as countries struggle to bridge collateral gaps.
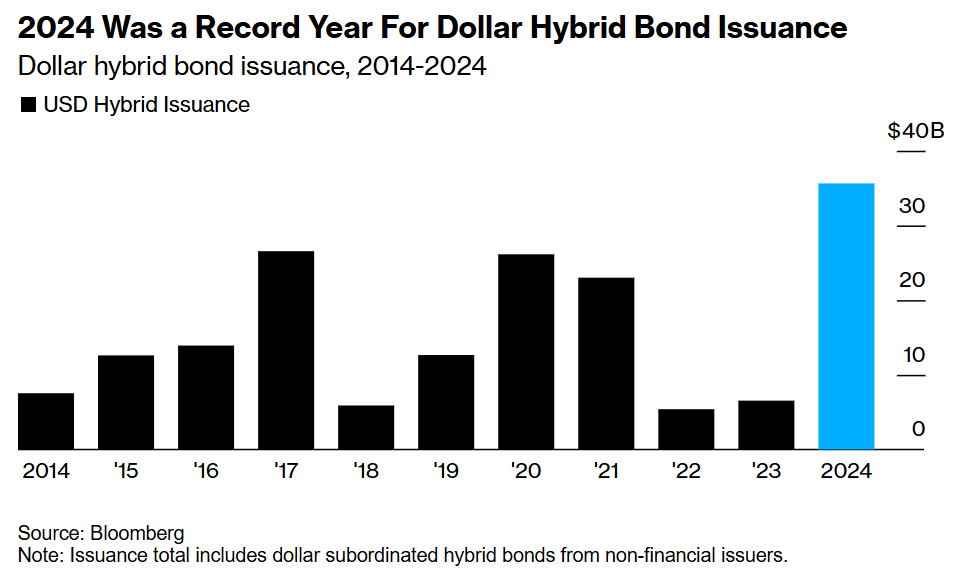
Dollar transactions have picked around the world just as dollar denominated bond offerings. “The bonds are known as hybrids, because they have characteristics of both debt and equity. US dollar issuance of the bonds climbed to a record $35.6 billion this year, according to data compiled by Bloomberg that excludes sales from financial companies. That’s up from just $6.5 billion last year.”[3] The concerns facing the global economy and broad leverage still supports the US dollar, and we don’t see the dollar losing its “throne” as the king of reserve currencies in this iteration of FX concerns.
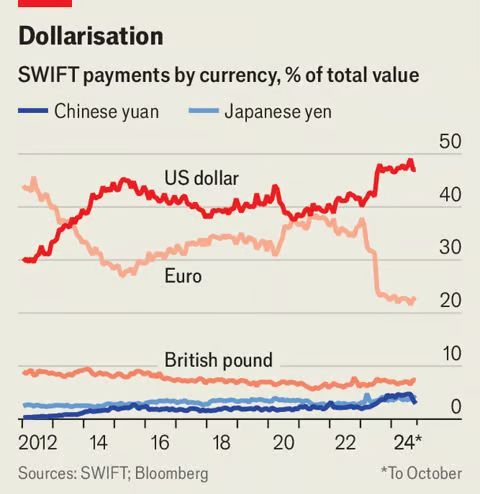
Swift payments support the strength of USD transactions- especially as EUR activity falls rapidly. We expect EUR and YEN purchases to suffer as Yuan and USD transactions take the lion share of transactions.
- 2022 reduction in euro-denominated payments reflects drop in EU-Russia trade
- Renminbi-denominated payments mostly skirt Swift and probably go through CIPS
The question is less about USD and more about U.S. debt. The below picture puts into perspective who is sitting with the largest amount of US TSYs. China had sold several tranches to pull forward USD and stabilize their banking collateral amidst a real estate collapse. Given the saturated ownership structure, who buys the increasing issuance? This is the underlying problem we face heading into the rest of the 2020’s.

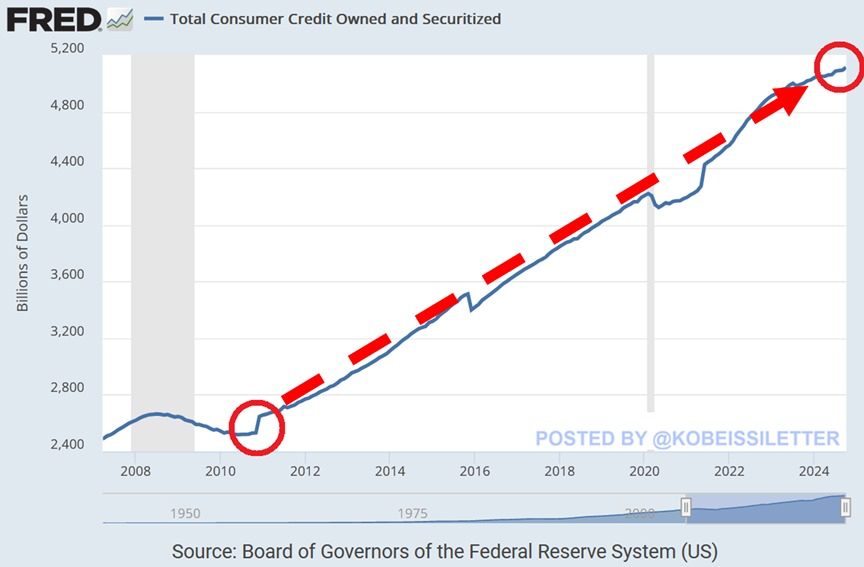
The biggest unknown heading into 2025 is the U.S. consumer.
- Total consumer credit jumped by $19.24 billion in October to a record $5.11 trillion.
- Over the last 4 years, have only been 2 months without an increase in consumer credit.
- Revolving debt, which includes credit cards, soared by $15.72 billion, the most since June 2022, and hit an all-time high of $1.37 trillion.
- Non-revolving credit rose by $3.52 billion, to $3.74 trillion, also a record.
- Meanwhile, the average credit card interest rate jumped to an all-time high of 23.37% in Q3 2024. Americans are drowning in debt to fight inflation.
The growth of debt is also creating a surge in defaults.
- Credit card defaults from small lenders hit RECORD levels
- Surpassing even the Dot Com bubble & Financial Crisis peaks

The pressure on their balance sheets has pulled more capacity from savings- especially capital that was put into savings monthly.
- Savings as % of income has been consistently declining since the 1970s
- And is now almost at 0%
- Compare this to the 8 to 14% savings that used to occur from 1947 to early 1970s

Families are living paycheck to paycheck with even less being preserved for retirement or an unplanned life event.
The global consumer is seeing a similar set up to what we talked about in the global debt march.
- Global debt rose by over $12 trillion in Q1-Q3 and hit a MASSIVE $322.9 trillion, a new all-time high.
- Over the last 2 decades, world’s debt has TRIPLED.
- Debt is more than 3 TIMES larger than the global economy.

The biggest concern facing the market right now (and something C6 is directly investing to address) is the food markets.
- Agricultural commodities have surged nearly 30% year-over-year, reaching their highest levels in a decade.
- Meanwhile, the Fed cut rates again.
- The war against inflation is far from over in my view.

I think it’s important to put this in perspective- America is one of (if not the) richest countries in the world, but a large portion of individuals are still struggling.
“Americans earning under $50K are skipping meals, selling belongings and delaying medical care to cover housing costs,” per Moneywise 24%.
- Americans earning under $50,000 a year have skipped meals to afford their rent or mortgage payments. And 23% have been forced to sell belongings.
“If this is happening in America, what’s happening around the rest of the world? How are people going to cope with something so basic as food?
A rise in food prices makes for a less than merry holiday season.
Grocery prices rose 0.4% in November, according to the Consumer Price Index, released by the U.S. Bureau of Labor Statistics.
Eggs made one of the biggest jumps at 8.2% over the month, and 37.5% over the past year, providing challenges for people trying to eat a somewhat cheaper protein and families cooking holiday foods such as sugar cookies and challah.
Although the increase in food prices has moderated a bit from past years, they are still more than 20% higher than they were before the pandemic, according to David Ortega, at Michigan State University.
“It was a key issue in the election in terms of people really feeling that sticker shock at the grocery store,” said Ortega, a food economist.”[4]
Between power and food alone, the average global consumer is going to see their bills moving in the wrong direction.
A brief summary on China as they continue to struggle across the board.
November macro data disappoints
Optimism over China’s economy has proven premature.
On Monday, the statistics bureau (NBS) released economic data for November, and it paints a pretty disappointing picture.
The headlines:
- Fixed asset investment (FAI) grew 2.4% y/y, down from 3.4% October.
- Industrial value-added (IVA) grew 5.4% y/y, compared to 5.3% in October.
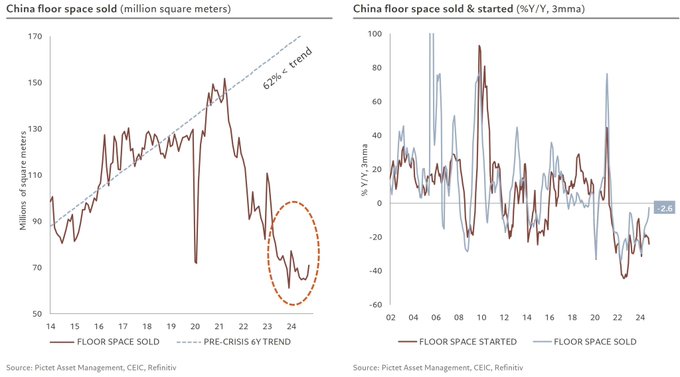
- Property investment was still declining, falling 10.4 per cent in the 11 months to the end of November, the NBS said, compared with a fall of 10.3 per cent in the first 10 months.
- Retail sales of goods grew 3.0%, down from 4.8% the previous month.
“Retail sales in China missed expectations in November, adding to pressure on policymakers after President Xi Jinping signaled last week that he wanted to spur household consumption to boost the world’s second-largest economy. The consumption measure added 3 per cent year on year, below a forecast of 4.6 per cent in a Reuters poll and last month’s rise of 4.8 per cent. Industrial production added 5.4 per cent, slightly above predictions. The unexpectedly weaker growth comes days after the Communist party leadership called for “vigorous” efforts to boost consumption and domestic demand at the annual Central Economic Work Conference last week. The November retail number “was the big disappointment of the month, as retail sales . . . came in well softer than both consensus and our forecasts”, said Lynn Song, chief economist for greater China at ING in a research note.[5]”
ICYDK: In October, retail sales grew at the fastest past in eight months, sparking cautious optimism that China might be witnessing the green shoots of a recovery.
However, as we noted at the time, October sales were likely inflated by two factors. The annual Double 11 online shopping festival ran from October 14 to November 11 this year, meaning it was concentrated in October. Last year it started much later, running October 24-November 11.
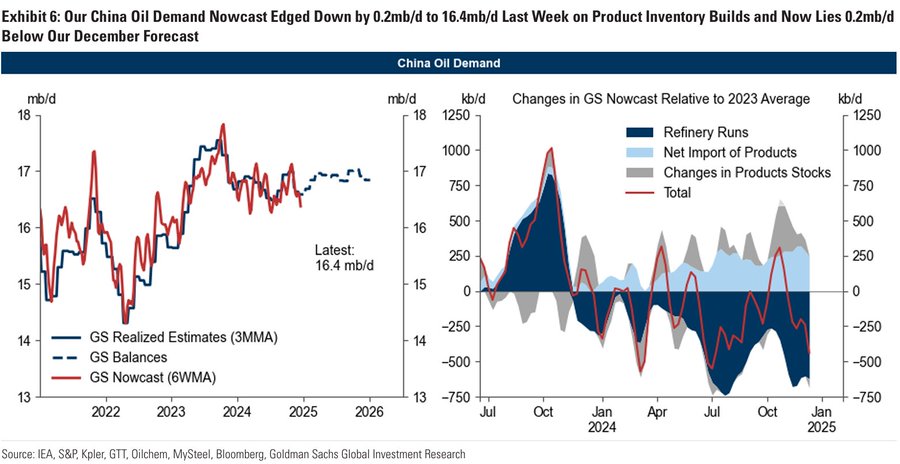
The weakness in China has been playing out in crude demand over the past year, and we don’t see that changing next year. With the exception of a recent uptick in some teapot runs, Chinese demand is not that pretty.
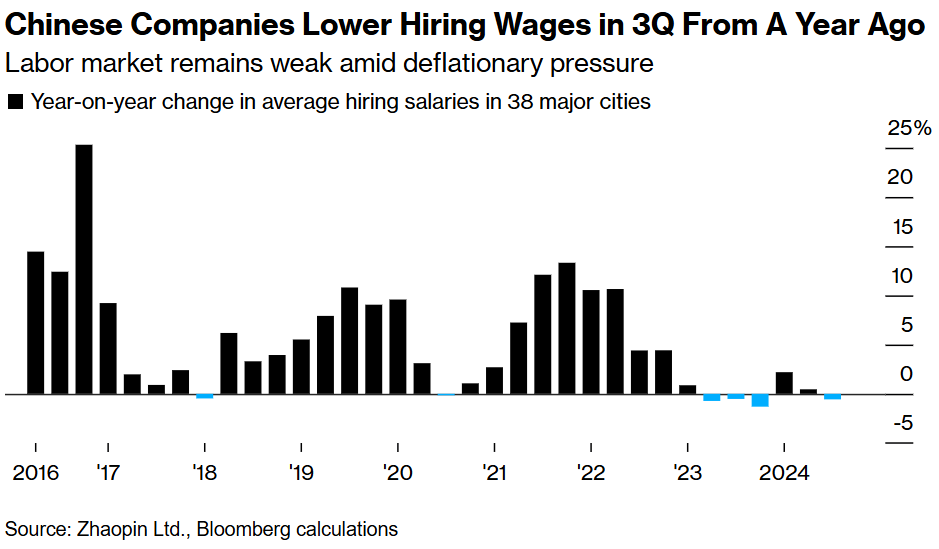
The broader problem is consumer spending, which isn’t going to turn around in this kind of wage growth backdrop. Retails sales in China are already pointing to weakness, and a reduction in wages isn’t going to help the situation. “A gloomy wage outlook fueled widespread debate on social media on Tuesday, with users expressing dismay over salaries they said have fallen back to levels seen a decade ago under the topic “era of 3,500 yuan ($480) a month.” [6]
China has been stimulating for years, and they are now doing it again with more debt- a terrible idea!
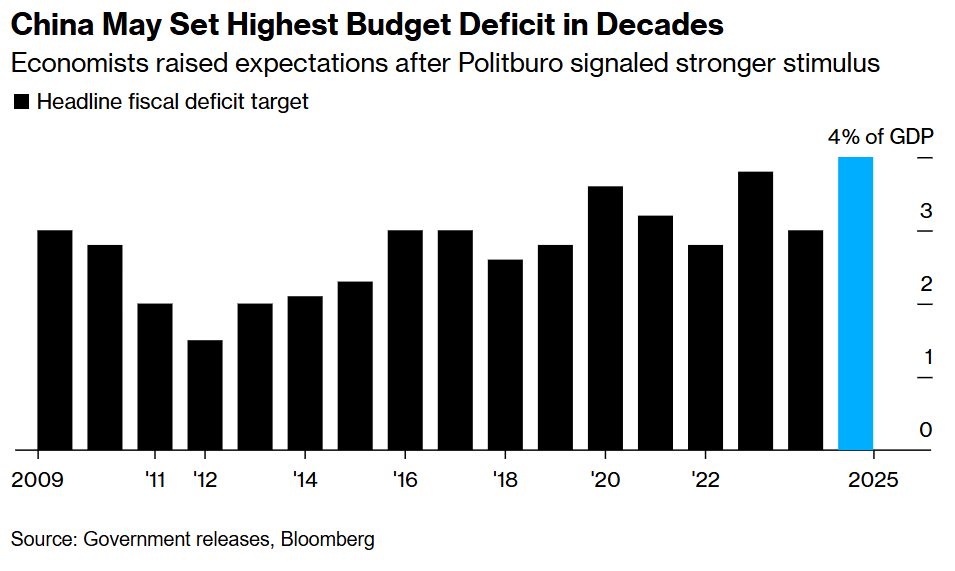
China is promising similar growth, which means we can expect more debt to be pushed throughout the market. “Policymakers last week pledged to “maintain stable economic growth” and prioritize boosting domestic consumption and investment at the economic work conference. Days earlier, the 24-man Politburo vowed to adopt a “moderately loose” monetary policy — the first shift in stance in about 14 years. Vows for “more proactive” fiscal tools stoked expectations for a budget expansion.”
It’s going to be difficult for China to turn the tide with more debt, and the broad slowdown in global demand and slowing industrial activity will keep pressure on the Chinese economy. It means less exports, which China needs to offset the problems with spending at home. There was some improvement on the housing side, but it just shows more of a bottoming and less about an increase in broad activity.
While the government tries to stimulate, I don’t expect to see much from the PBoC as they achieved their goal of getting the credit impulse back to flat.

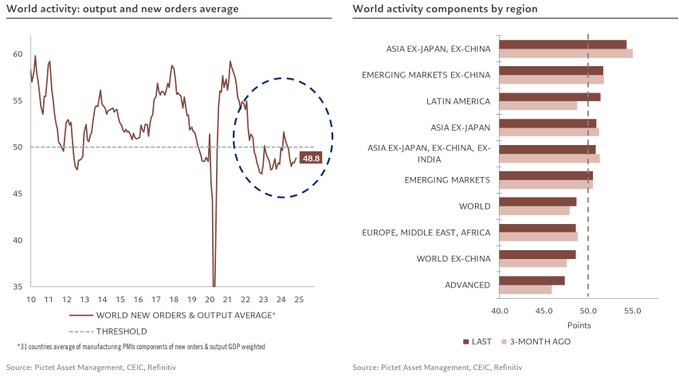
The global activity indicators have improved, but they still remain in contraction with little to show additional growth into 2025. It holds to our main view that the landing doesn’t mean as much as the length of it. We believe there will be a “soft” landing, but it will be over a very long period of time. Activity components have gained 0.5pt to 48.8 from one of the lowest level of the year. Latam posted the largest increase vs 3M ago (+2.6pts), while regions still show wide dispersion, with a 7pt gap between EM Asia ex-China, well ahead at 54.4, and advanced countries at the bottom of the pack at 47.4. I think the below chart helps to drive this view home, especially as India starts to soften a bit.
Central banks are already starting to panic a bit and cut rates, which is why I believe inflation is gearing up for the second wave.

Some people in the market view this as a positive backdrop, but this is more concerning as leading inflationary indicators pick up again.

You can see in the chart above how we have begun to pivot higher, and given the amount of liquidity still in the market and more coming- we are off to the races for the second wave.
- https://www.bloomberg.com/news/articles/2024-12-15/massive-interest-burden-haunts-29-trillion-emerging-debt-pile
- https://www.bloomberg.com/news/articles/2024-12-20/japan-warns-on-yen-after-boj-s-dovish-messaging-extends-slide
- https://www.bloomberg.com/news/articles/2024-12-19/hybrid-bonds-are-getting-hot-in-us-after-moody-s-made-key-switch
- https://iowacapitaldispatch.com/2024/12/15/us-grocery-prices-and-eggs-in-particular-climb-heading-into-holiday-season/
- https://www.ft.com/content/a1c39f1b-bf6c-4845-839c-81be269c4468
- https://www.bloomberg.com/news/articles/2024-12-17/china-plans-about-5-gdp-target-in-2025-reuters-says


