
As the earnings season for Big Oil has kicked off, we thought it is instructive to discuss the connection between the Frac Spread Count (commonly called the FSC) and oil prices in the wider context of investment outlook of various international companies.
The relationship between oil prices and the Frac Spread Count (FSC) has long been a closely watched indicator of industry activity, but recent trends suggest a fundamental shift in how the two interact. Historically, the FSC followed oil prices with a slight lag, responding to capital inflows and drilling activity. However, the past five years have seen other variables being included in the analysis, with structural changes in the industry altering the way operators respond to price fluctuations.
In 2014, U.S. shale was in full expansion mode. Oil prices were well above $100 per barrel, and the FSC hovered between 400-450 active spreads, reflecting aggressive drilling and completion activity. However, the collapse in oil prices that began in mid-2014, with WTI crashing from over $100 to below $30 by early 2016, triggered a dramatic decline in fracking activity. By the end of 2016, FSC had fallen to nearly 200 spreads, marking a 50% decline in just over two years. This was one of the most pronounced contractions in the history of U.S. shale and highlighted the deep reliance of fracking activity on oil price incentives. Following this low, 2017 and 2018 saw a period of recovery. As oil prices rebounded to the $60-$75 range, the FSC followed suit, rising steadily and surpassing 400 active spreads by mid-2018. This phase reaffirmed the price-to-FSC relationship, with capital deployment increasing as prices improved. However, as 2019 progressed, new dynamics made its way. Despite WTI stabilizing around $55-$65, the FSC declined from 450 to nearly 300 by the end of 2019. This indicated a shift in industry behavior—efficiency gains and capital discipline started taking precedence over outright volume growth.
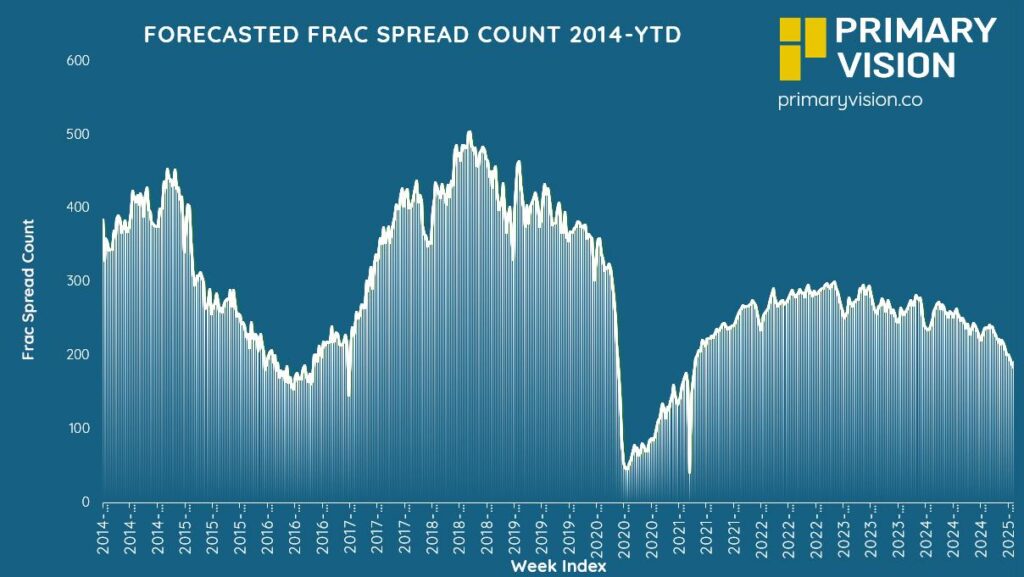
Source: Primary Vision
In early 2020, the collapse in demand triggered by COVID-19 sent oil prices plummeting to around $40 per barrel. The impact on the FSC was immediate and severe, with spreads dropping from nearly 360 to below 100 in a matter of months. The direct correlation was clear—reduced demand, price crashes, and operator pullbacks led to an unprecedented contraction in frac activity. This period marked the steepest FSC drop in history, reflecting how sensitive fracking is to rapid price swings and external shocks. Yet, as demand started recovering in 2021, oil prices climbed back to the $60 range, and the FSC followed suit, rebounding to around 200. However, the lag in recovery showed that producers were hesitant to reactivate spreads too quickly. Instead of chasing immediate production gains, many prioritized balance sheet repairs, capital discipline, and cash preservation.
The most interesting divergence emerged in 2022 when oil prices surged past $110 per barrel. Under normal circumstances, this kind of price environment would have triggered a surge in frac activity, yet the FSC only climbed modestly to around 250. Instead of a one-to-one correlation, operators took a measured approach, focusing on shareholder returns rather than aggressive expansion. Efficiency gains played a significant role—longer laterals, multi-well pads, and high-intensity completions allowed for more production with fewer active spreads. This period underscored the industry’s shift from volume growth at any cost to a more disciplined, return-focused strategy.
Moving into 2023 and 2024, oil prices stabilized in the $75-$80 range, yet the FSC began a steady decline, slipping from 230 to 190. Cost inflation, rising service costs, and macroeconomic uncertainties forced producers to rethink expansion plans. Even with oil prices at levels that were historically supportive of drilling and completion activity, operators held back, opting instead for efficiency gains and lower capital expenditures. This divergence became even clearer in early 2025, as oil hovered around $73 per barrel while the FSC continued its decline to 190. Unlike past cycles, where stable oil prices would have kept the FSC elevated, the combination of cost pressures, labor shortages, and service price escalations has limited growth.

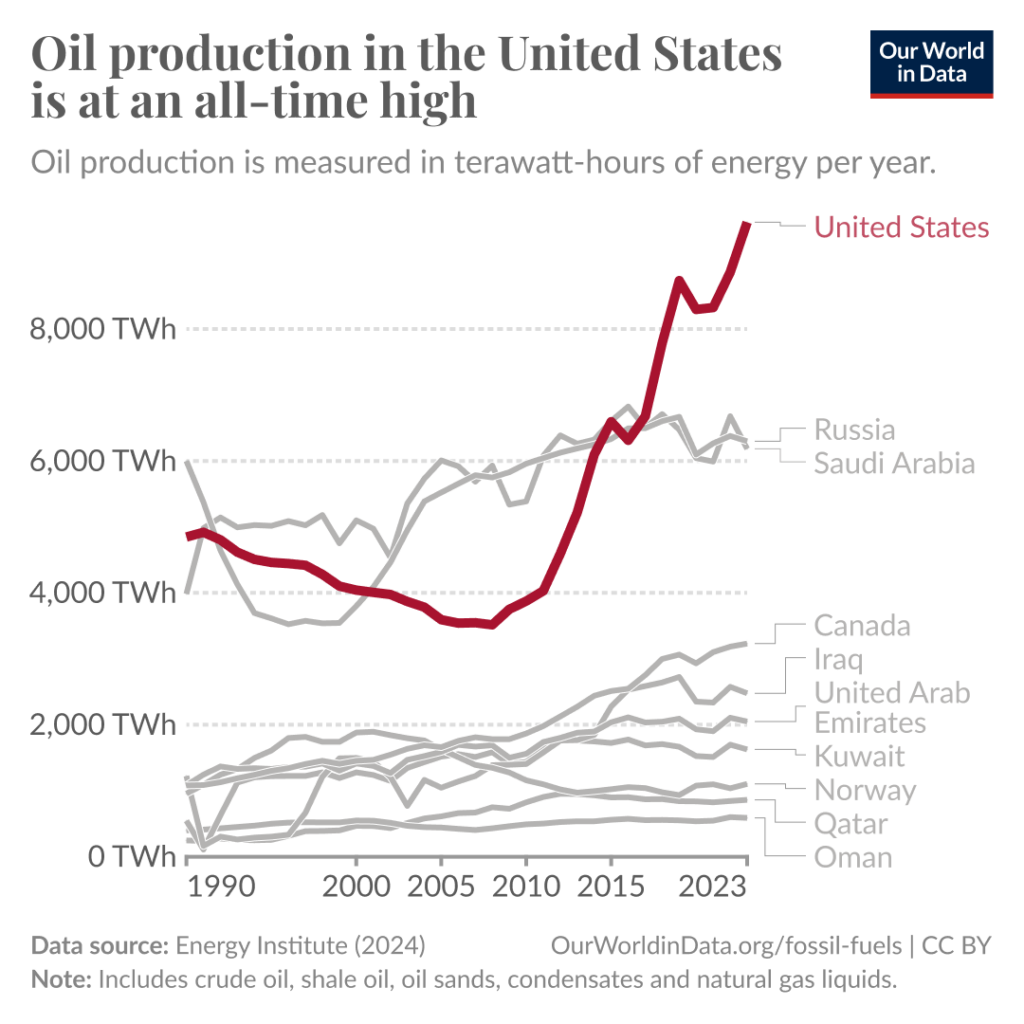
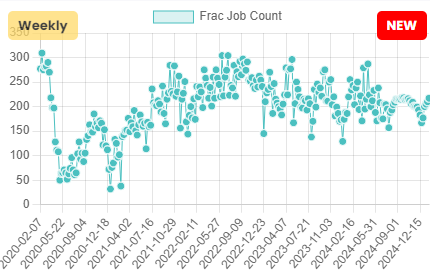
Another key observation is that while the FSC has been trending downward, the Frac Job Count (FJC) has shown resilience but remains volatile, reflecting both efficiency gains and cautious reinvestment. Operators are maximizing completion efficiency per job, yet periodic fluctuations suggest that service demand is not entirely immune to cost inflation and capital discipline. This supports the broader industry narrative: fewer active spreads are completing nearly the same number of jobs, largely due to improved productivity per spread and optimized well designs. If we compare this with oil production trends, it reinforces that U.S. shale output continues to grow despite declining frac spreads, as operators are achieving more with fewer resources. The recent softness in the FJC towards late 2024 aligns with lower reinvestment rates, capital discipline, and cost inflation. This suggests that while production remains stable, there is little appetite for expansion unless oil prices move significantly higher. The industry is focused on returning cash to shareholders rather than aggressively growing production, meaning that even with a stable or slightly declining the FJC, output could remain robust through continued efficiency gains. The following chart directly complements the FSC by showing that despite a falling spread count, the actual number of completion jobs hasn’t collapsed at the same rate, signaling that the industry is adapting through operational efficiencies rather than just reducing activity outright.
This shift in producer behavior comes at a time when the five biggest international oil and gas majors—ExxonMobil, Chevron, BP, Shell, and TotalEnergies—are expected to report their lowest quarterly earnings in three years. Lower oil and gas prices, weaker oil trading, and declining refining margins are set to weigh heavily on their fourth-quarter results. The reduced profitability could lead to additional cost-cutting measures, further dampening service sector activity, including fracking. While Big Oil remains committed to shareholder returns, the pressure on cash flow might result in a reduction in capital deployment in North American shale plays. With ExxonMobil already signaling a weaker Q4 due to refining margin compression and BP expecting lower realized refining margins, the outlook for aggressive drilling activity warrants further investigation.


