
Discipline has taken priority over aggressive drilling. With BP already releasing its fourth-quarter results and ExxonMobil and Chevron set to report soon, Primary Vision’s latest Frac Spread Count (FSC) and Frac Job Count (FJC) data offer critical insights into the strategies U.S. producers are employing to navigate market volatility. But beyond simply confirming efficiency gains, this data provides a leading indicator of what’s ahead—especially for those betting on U.S. production growth or service market trends.
BP’s fourth-quarter performance encapsulates the market’s challenges and evolving strategies. The company reported a 61% drop in underlying replacement cost profit to $1.2 billion, hit by weaker refining margins and a higher tax rate. Despite these setbacks, BP announced a $1.75 billion share buyback while signaling a review of future investment plans later this month. Notably, capital expenditure declined, and free cash flow fell 22% to $3.7 billion—both key indicators of reduced near-term reinvestment in production growth. BP’s reduced capex signals less near-term investment in production growth—an approach likely mirrored by other majors, putting more pressure on independent E&Ps to fill the output gap.

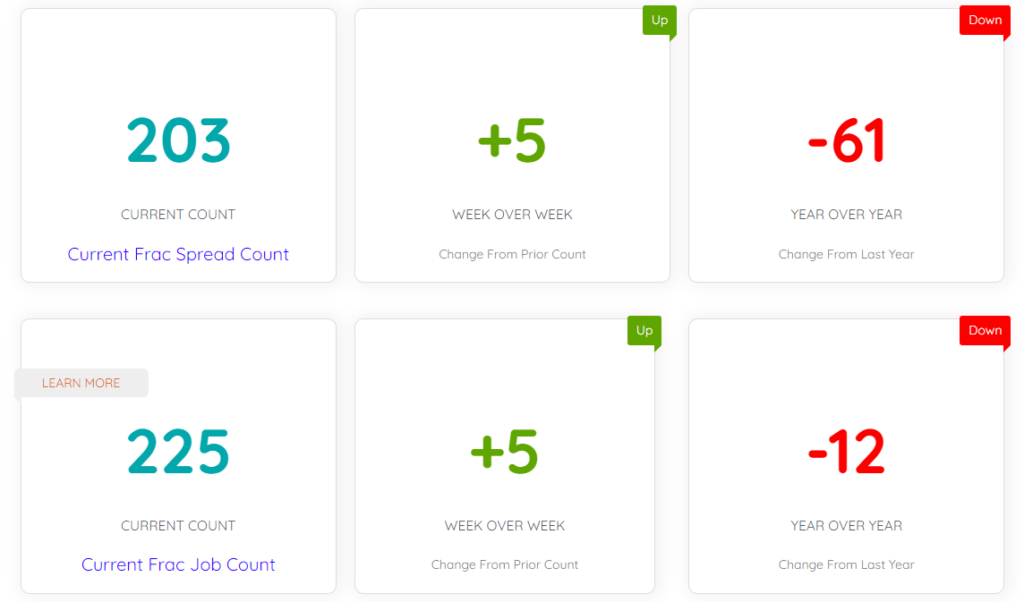
The latest FSC and FJC from Primary Vision confirm this shift. Although spreads rose by five week-over-week to 203, the year-over-year decline is a stark 61 fewer spreads. FJC climbed to 225 jobs, up five from last week, but still down 12 year-over-year. While it’s easy to attribute this divergence to efficiency gains, the real story is about capital deployment signals. Historically, a sharp drop in spreads would have foreshadowed lower production growth. Today, it flags a different trend—majors are ceding growth to mid-cap operators, creating opportunities and risks across the service landscape.
This is where Primary Vision’s subscribers gain an edge: FSC’s behavior relative to production forecasts can signal where drilling activity will actually emerge. The EIA’s 2025 U.S. production forecast, raised to 13.59 million barrels per day (bpd), isn’t just about efficiencies—it’s about who is drilling, where, and how aggressively. For instance, the U.S. Energy Information Administration (EIA) reported a 9% year-over-year increase in crude oil productivity per active rig in the Permian as of November 2024. Additionally, Chevron has achieved an 80% improvement in drilling speed over the past five years, allowing them to drill more feet per day than before. If FSC in the Delaware Basin trends up while Midland lags, expect service costs in the Delaware to spike—something our readers can capitalize on before the market reacts.

But let’s talk risk—because that’s what we really need to know. The muted FSC recovery against stable oil prices ($70-$75 per barrel) suggests that even if ExxonMobil and Chevron report disappointing earnings, they are unlikely to chase volume growth. Chevron has already signaled caution, prioritizing returns over growth. ExxonMobil, facing refining margin pressures, may also follow suit. If this happens, watch where the FSC grows—because it will be driven by mid-cap E&Ps, which are more responsive to price signals but also more vulnerable to cost inflation.
Tariffs and trade tensions add another layer of uncertainty that that will also have its impact on FSC and FJC. Wood Mackenzie projects that a 25% tariff on Mexican crude could redirect 600,000 bpd from U.S. Gulf refiners to overseas markets. This will hit U.S. refiners hard—but it also opens a window for U.S. light sweet production to fill the gap if spreads rise in regions supplying the Gulf. However, if we fail to see a FSC response, it signals that cost inflation or labor constraints are suppressing activity—critical insights for investors and service providers alike. A look at history underscores why these signals matter. In 2019, U.S. sanctions on Venezuelan crude caused an 8% quarterly drop in FSC as Gulf refiners scrambled to adjust. Today, a tariff-driven disruption could provoke a similar response. By monitoring where spreads decline—whether it’s Eagle Ford or the Gulf-facing Permian zones—we can gain actionable foresight into refining demand shifts and service market opportunities.
In conclusion, this isn’t the same old “efficiency vs. spreads” story. The FSC and FJC aren’t just measures of activity—they are leading indicators of where the market is going. The week-over-week uptick is a tactical adjustment, but the year-over-year decline warns of a strategic shift. As ExxonMobil and Chevron report their results, we need to watch their capex signals and Primary Vision’s FSC very closely to see where those signals translate into ground-level activity. And with tariffs looming, FSC’s regional patterns may well become the first signal of a supply chain shock that reshapes the U.S. production map.


