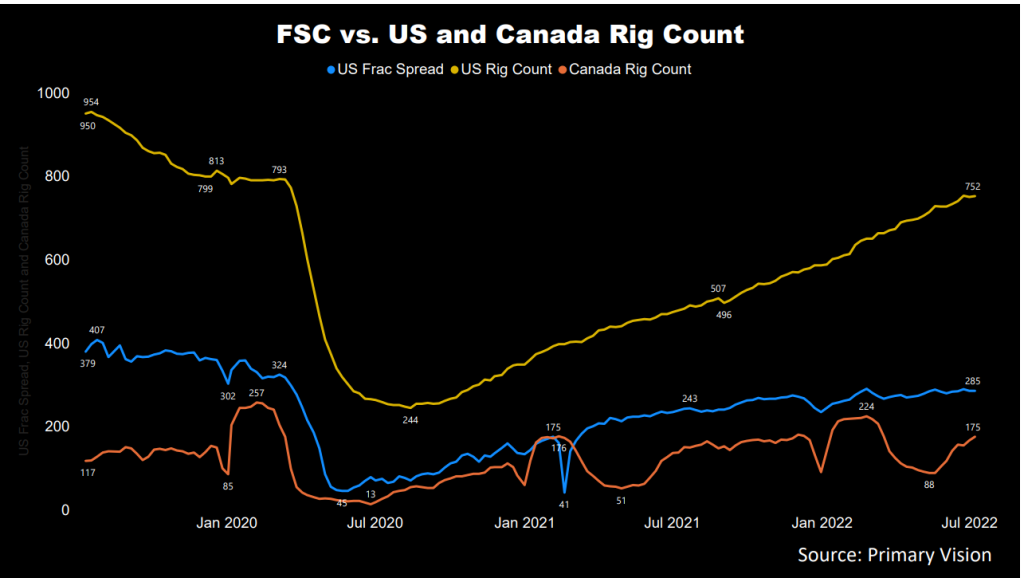
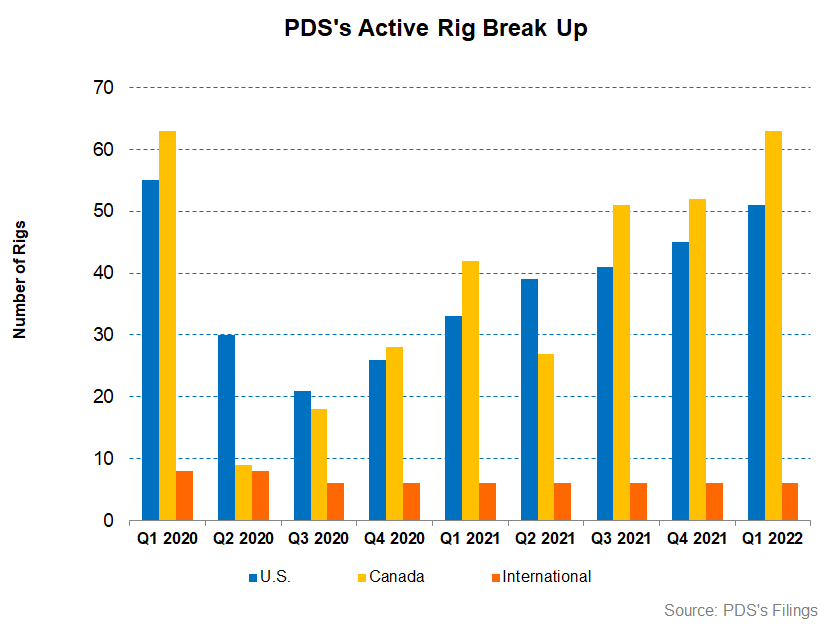
- Precision Drilling’s active drilling rig count has increased significantly in the US and Canada in the past year
- Its Super Singles rigs see increased demand and can remain fully utilized in the near term
- Following increased adoption of the GHG emission standard, it has recently introduced EverGreen environmental solutions
- The company aims to slash debt significantly between 2022 and 2025, although cash flows turning negative is a concern
Strategies And Outlook In Canada And US
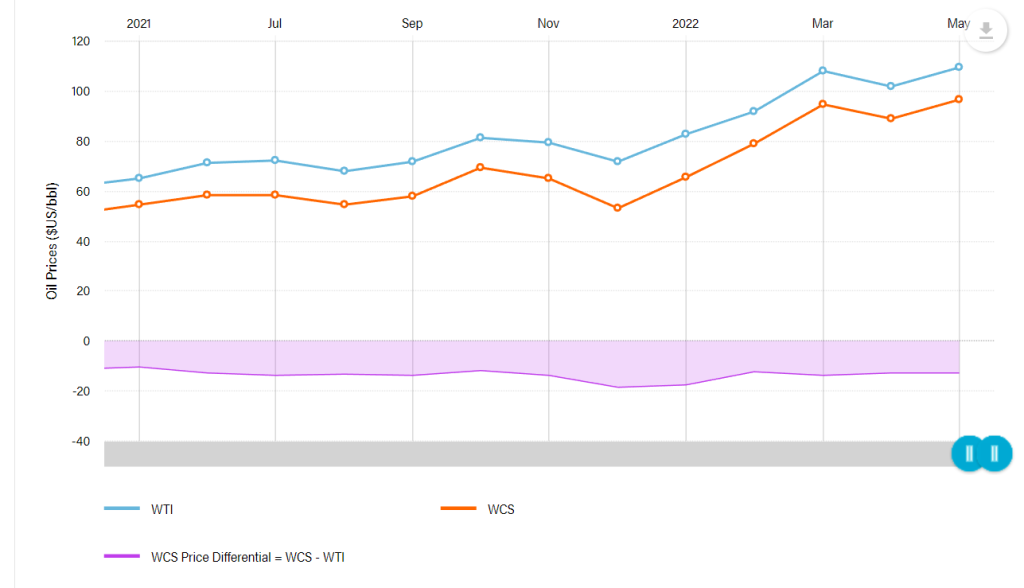
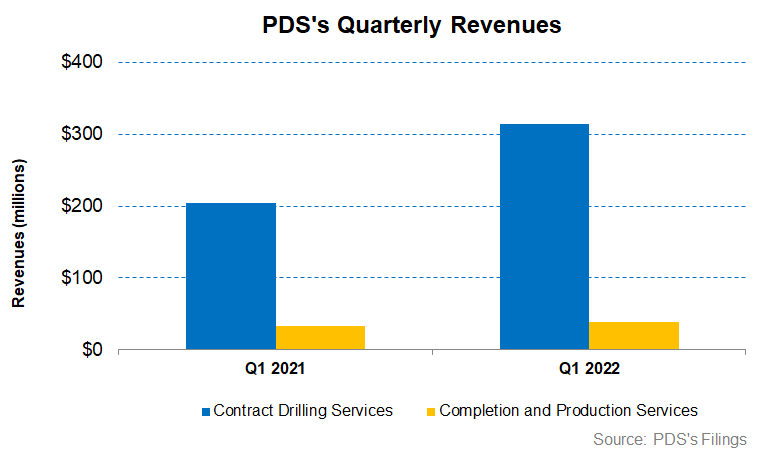
In the past year until Q1 2022, Precision Drilling has grown its onshore rig fleet in Canada and US by 50% and 55%, respectively. This indicates the management’s confidence in seeing a rebound in activity and energy prices. The WCS (Western Canada Select)–WTI (West Texas Intermediate) spread is a crucial indicator of the Canadian energy companies’ performance. The WTI price averaged $109 a barrel in May 2022, 67% higher than a year ago. WCS averaged ~$97 a barrel in May 2022, or 77% higher than a year ago. Since the spread improved (i.e., the spread contracted) in the past year, expect the impact to be positive in Q2.
PDS’s pricing for its services and fixed cost absorption later are expected to improve in 2022. As a result, the daily operating margin, which was $5,247 in Q1, can increase by 9% in Q2 2021. According to PDS’s management views, customer demand for rigs in the heavy oil play in Marten Hills is gaining momentum. So, its pad walking Super Singles rigs see increased demand and can remain fully utilized in the near term. With several rig activations scheduled in May, booking should ramp up.
Day Rate And International Activity
As customers’ demand for energy-efficient rigs rises, PDS foresees high-spec rig shortages, which can put a premium on its ST-1500 rigs equipped AlphaAutomation to drill long-reach horizontal wells. With demand outstripping supply, the management believes that customers are ready to sign medium-term contracts at higher rates to secure access to the rigs. In the US, the leading-edge rates trended to the low-$30,000 per day range.
Internationally, three active rigs in Saudi Arabia have been renewed for five years, while in Kuwait, a rig tender was released recently. Although the process can take several months, PDS’s three idle Kuwait super-spec rigs can meet the requirements. So, the company can contract its idle rigs for activation later in 2022, cutting losses and improving profitability.
Technology Adoption
Along with PDS’s AlphaAutomation Digital Solutions system, it has recently introduced EverGreen environmental solutions. More than 50% of its Super Triples are equipped with AlphaAutomation. Precision’s app library has 18 commercial apps, which boldens its revenue generation potential. The EverGreen battery storage system and the fuel & emissions monitoring app are commercially deployed on several rigs. With the increased adoption of the GHG emission standard, these products can continue to gain market share.
Identifying The Headwinds
A critical concern for PDS has been the customer resistance to implementing cost and price increase initiatives. Because of the weak industry demand in Canada for the past several quarters, the rate discussions have been tenuous. The repricing of rigs is expected to take place in 2H 2022. It is likely to result in below-average price hikes. Meanwhile, the company rejected several rig reactivations due to lower-than-desired customer rate expectations.
Utilization And Other Key Metrics
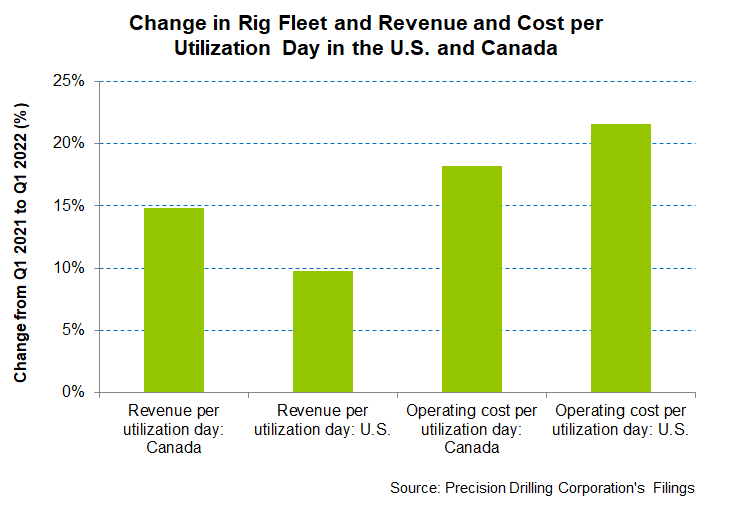
During Q1, PDS benefited from higher day rates, cost control, and fixed cost absorption. Between Q1 2021 and Q1 2022, the company added 21 drilling rigs in Canada, although the average rigs under contract remained unchanged. The average revenue per utilization day increased by 15% in Canada in Q1 2022 compared to a year ago. Operating cost per utilization day exceeded the revenue growth (18% rise), leading to a 9% operating profit expansion.
Additional staffing of rigs and start-up costs (PDS activated 18 rigs in Q1) reduced margin. In comparison, year-over-year, the average revenue per utilization day increased by 10% in the United States in Q1, while the operating cost per utilization day increased by 22%. This resulted in a 16% lower operating profit per day.
Debt And Cash Flows
In Q1 2022, PDS’s cash flow from operations (or CFO) turned negative compared to a positive CFO a year ago. Despite a rise in revenues during this period, working capital deterioration led to the fall. In Q2, the company expects working capital release following lower activity during the Canadian spring breakup and higher collection. Capex also increased, leading to a steeper fall in free cash flow (or FCF) in Q1 2022 compared to a year ago. In Q2 2022, the company expects working capital to be reduced by $50 million or $40 million lower compared to Q1. So, its cash flows can improve in Q2.
As of March 31, 2022, the company’s leverage (debt-to-equity ratio) of 0.99x was higher than its peers’ (HP, NBR, PTEN) average of 0.89x. It expects to pay most of its revolver draw in the next term. It also expects the net debt to adjusted EBITDA ratio to fall to ~3x by 2022-end and further to 1.5x by 2023-end. It plans to reduce debt by ~$400 million between 2022 and 2025. The available liquidity is $430 million.
Learn about PDS’s revenue and EBITDA estimates, relative valuation, and target price in Part 2 of the article.


