Primary Vision
  • HOME
  • ABOUT US
    • ABOUT US
    • PRIMARY VISION AI INNOVATIONS
  • EFRACS
  • RESEARCH
    • INSIGHTS & ARTICLES
    • FREE ARTICLES
  • EVENTS
  • PRESS
  • SUPPORT
  • FAQ
  • LATEST NEWS
  • LOGIN
  • SIGN UP!
    • FRAC SPREAD COUNT SIGN-UP!
    • ENTERPRISE SUBSCRIPTION PLAN SIGN UP!
  • HOME
  • ABOUT US
    • ABOUT US
    • PRIMARY VISION AI INNOVATIONS
  • EFRACS
  • RESEARCH
    • INSIGHTS & ARTICLES
    • FREE ARTICLES
  • EVENTS
  • PRESS
  • SUPPORT
  • FAQ
  • LATEST NEWS
  • LOGIN
  • SIGN UP!
    • FRAC SPREAD COUNT SIGN-UP!
    • ENTERPRISE SUBSCRIPTION PLAN SIGN UP!
No Result
View All Result
Primary Vision
Home Market Trends

Calfrac Well Services Part 2: Estimates And Relative Valuation

Avik Chowdhury by Avik Chowdhury
August 23, 2022
in Market Trends
0
Calfrac Well Services Part 2: Estimates And Relative Valuation

  • Revenue estimates suggest a nearly unchanged topline in the following two years.
  • EBITDA can increase significantly in NTM 2023 and decelerate afterward
  • The stock is relatively undervalued versus its peers

Part 1 of this article discussed Calfrac’s (CFWFF) outlook, performance, and financial condition. In this part, we will discuss more.

Linear Regression Based Revenue Forecast

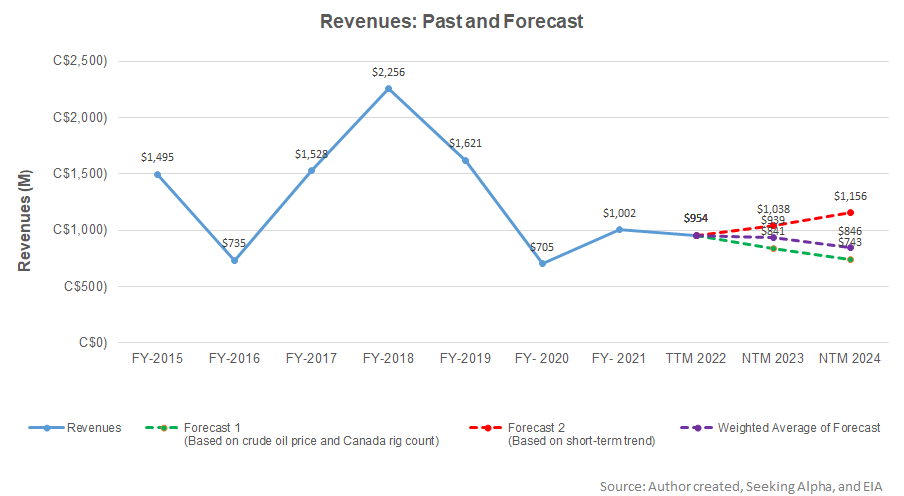
Based on a regression equation between the key industry indicators (crude oil price and Canada rig count) and Calfrac’s reported revenues for the past seven years and the previous four quarters, its revenues are unlikely to change much in the next two years.

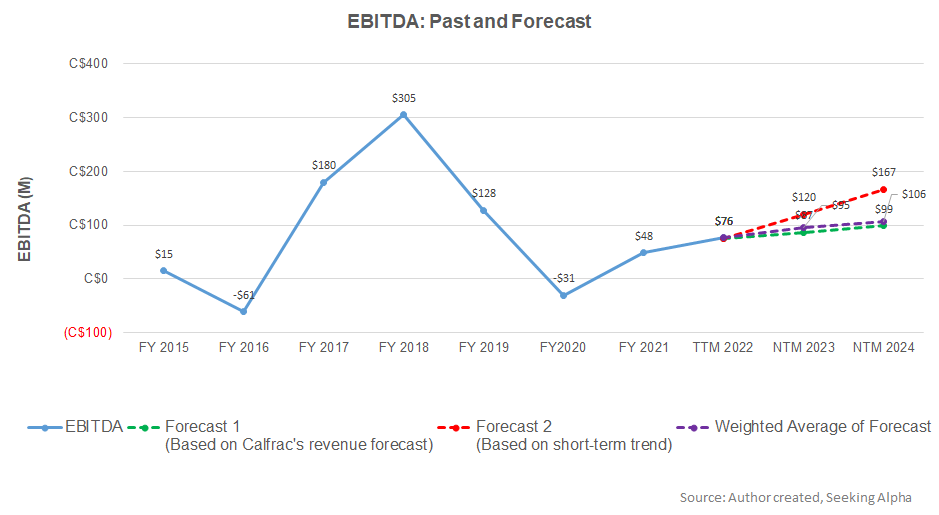
Based on the same regression models and the forecast revenues, I expect the company’s EBITDA to step up substantially in the next 12 months (or NTM) in 2023. The model suggests the EBITDA growth rate will slow down in NTM 2024.

Target Price And Relative Valuation

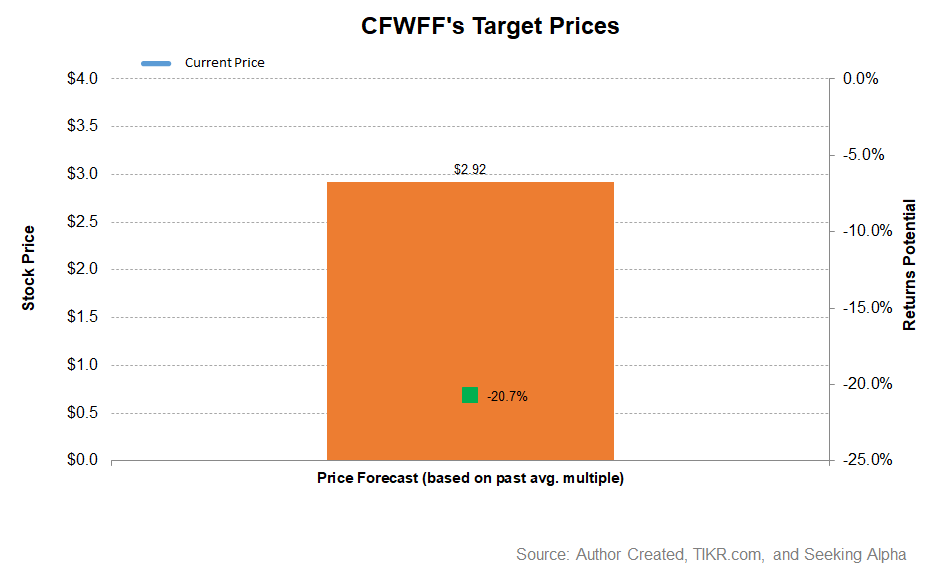
Based on revenues and EBITDA estimates derived from the model, returns potential using the past average EV/EBITDA multiple (6.0x) is negative (17% downside).

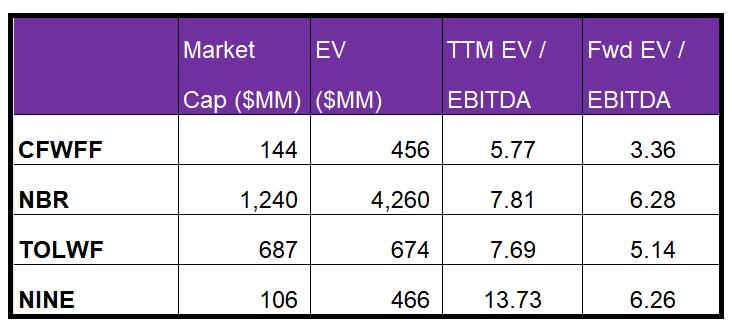
Calfrac’s forward EV-to-EBITDA multiple contraction versus the adjusted EV/EBITDA is steeper than the peers because its EBITDA is expected to increase more sharply than its peers in the next year. This should typically result in a higher EV/EBITDA multiple than its peers. However, the company’s EV/EBITDA multiple (5.8x) is lower than its peers’ (NBR, TOLWF, and NINE) average of 9.7x. The stock is relatively undervalued versus its peers.

What’s The Take On Calfrac?

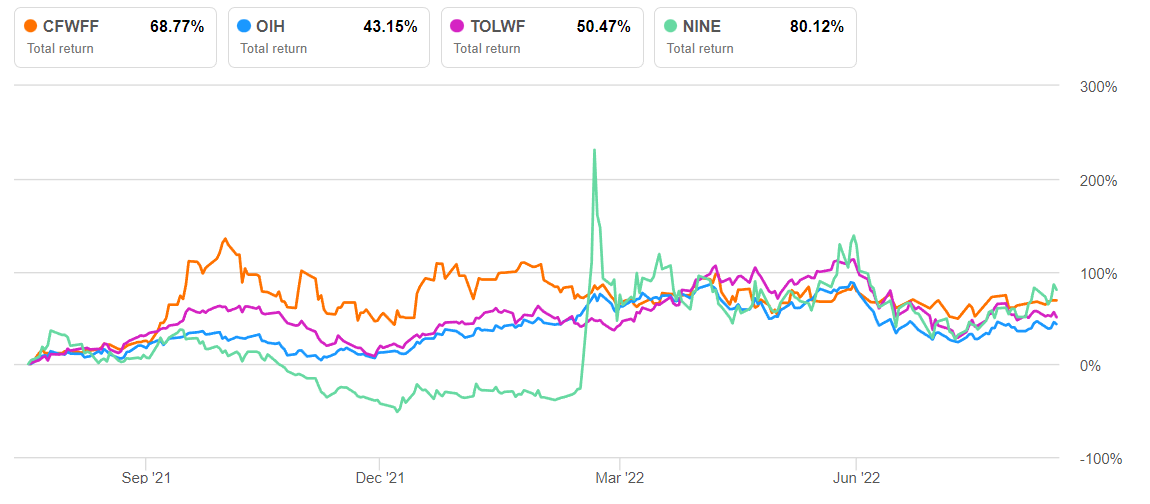
Calfrac’s outlook has remained bullish after the first half of 2022. While it is unlikely to add to its pressure pumping fleet in the US for the rest of the year, it will reap the benefits of higher utilization and a pricing recovery. Its Canada operations may see another unit joining the fleet, although the timing is uncertain. In Argentina, multi-year contracts and growth prospects in Southern Argentina can add to the positive factors. So, the stock outperformed the VanEck Vectors Oil Services ETF (OIH) in the past year.

On the other hand, the operating margin in Canada shrank in Q2. As Russia’s Ukraine invasion continues, the impact of a steep appreciation of the Russian ruble led to the fall of the CFO. So, free cash flows remained negative. Although it deleveraged in recent months, its liquidity is not robust. Relative valuation-wise, however, the stock is undervalued versus its peers. Considering everything, investors can hold the stock with the prospect of higher returns in the medium to long term.

Previous Post

The Parabolic Rise of the U.S. Dollar – Enterprise Subscribers

Next Post

Primary Vision Insights – Premium Subscribers

Related Posts

Liberty: Q2 TAKE THREE
Market Trends

Liberty: Q2 TAKE THREE

July 25, 2025
TechnipFMC: Q2 TAKE THREE
Market Trends

TechnipFMC: Q2 TAKE THREE

July 25, 2025
RES: Q2 TAKE THREE
Market Trends

RES: Q2 TAKE THREE

July 24, 2025
Patterson-UTI Energy: Q2 TAKE THREE
Market Trends

Patterson-UTI Energy: Q2 TAKE THREE

July 24, 2025
Baker Hughes In Q2: TAKE THREE
Market Trends

Baker Hughes In Q2: TAKE THREE

July 23, 2025
Market Sentiment Tracker: A Quiet Shift in U.S. Manufacturing? Philly Fed Suggests So
Market Trends

Market Sentiment Tracker: A Quiet Shift in U.S. Manufacturing? Philly Fed Suggests So

July 22, 2025
Next Post
Primary Vision Insights – Premium Subscribers

Primary Vision Insights - Premium Subscribers

Please login to join discussion

Recent News

Liberty: Q2 TAKE THREE

Liberty: Q2 TAKE THREE

July 25, 2025
TechnipFMC: Q2 TAKE THREE

TechnipFMC: Q2 TAKE THREE

July 25, 2025
RES: Q2 TAKE THREE

RES: Q2 TAKE THREE

July 24, 2025
Patterson-UTI Energy: Q2 TAKE THREE

Patterson-UTI Energy: Q2 TAKE THREE

July 24, 2025
Baker Hughes In Q2: TAKE THREE

Baker Hughes In Q2: TAKE THREE

July 23, 2025
Primary Vision

Established in 2011, we are renowned for our expert frac data and analytics, providing a rich array of unique indicators and industry commentary.

CONTACT

+1-713-554-4977
info@primaryvision.co

SOCIAL NETWORKS

POLICIES

Privacy Policy
Terms of Use

PARTNERS

Amazon Web Services

TRUSTED SITES

Logo

Logo

RECENT NEWS

Liberty: Q2 TAKE THREE

Liberty: Q2 TAKE THREE

July 25, 2025
TechnipFMC: Q2 TAKE THREE

TechnipFMC: Q2 TAKE THREE

July 25, 2025
RES: Q2 TAKE THREE

RES: Q2 TAKE THREE

July 24, 2025
Patterson-UTI Energy: Q2 TAKE THREE

Patterson-UTI Energy: Q2 TAKE THREE

July 24, 2025
Baker Hughes In Q2: TAKE THREE

Baker Hughes In Q2: TAKE THREE

July 23, 2025
  • HOME
  • ABOUT US
  • EFRACS
  • RESEARCH
  • EVENTS
  • PRESS
  • SUPPORT
  • FAQ
  • LATEST NEWS
  • LOGIN
  • SIGN UP!

© 2025 Primary Vision. All rights reserved.

  • HOME
  • ABOUT US
    • ABOUT US
    • PRIMARY VISION AI INNOVATIONS
  • EFRACS
  • RESEARCH
    • INSIGHTS & ARTICLES
    • FREE ARTICLES
  • EVENTS
  • PRESS
  • SUPPORT
  • FAQ
  • LATEST NEWS
  • LOGIN
  • SIGN UP!
    • FRAC SPREAD COUNT SIGN-UP!
    • ENTERPRISE SUBSCRIPTION PLAN SIGN UP!

© 2025 Primary Vision. All rights reserved.