Primary Vision
  • HOME
  • ABOUT US
    • ABOUT US
    • PRIMARY VISION AI INNOVATIONS
  • RESEARCH
    • INSIGHTS & ARTICLES
    • FREE ARTICLES
  • EVENTS
  • PRESS
  • SUPPORT
  • FAQ
  • LATEST NEWS
  • LOGIN
  • SIGN UP!
    • FRAC SPREAD COUNT SIGN-UP!
    • ENTERPRISE SUBSCRIPTION PLAN SIGN UP!
  • HOME
  • ABOUT US
    • ABOUT US
    • PRIMARY VISION AI INNOVATIONS
  • RESEARCH
    • INSIGHTS & ARTICLES
    • FREE ARTICLES
  • EVENTS
  • PRESS
  • SUPPORT
  • FAQ
  • LATEST NEWS
  • LOGIN
  • SIGN UP!
    • FRAC SPREAD COUNT SIGN-UP!
    • ENTERPRISE SUBSCRIPTION PLAN SIGN UP!
No Result
View All Result
Primary Vision
Home Market Trends

NexTier Oilfield Solutions Part 2: Estimates And Relative Valuation

Avik Chowdhury by Avik Chowdhury
November 27, 2022
in Market Trends
0
NexTier Oilfield Solutions Part 2: Estimates And Relative Valuation

  • Our regression estimate suggests NEX’s revenues will go higher in NTM 2023 but may decelerate in NTM 2024.
  • EBITDA, too, can increase steeply in NTM 2023 before decelerating in NTM 2024.
  • The stock is reasonable versus its peers at the current level.

Part 1 of this article discussed NexTier Oilfield Solutions’ (NEX) outlook, performance, and financial condition. In this part, we will discuss more.

Linear Regression Based Forecast

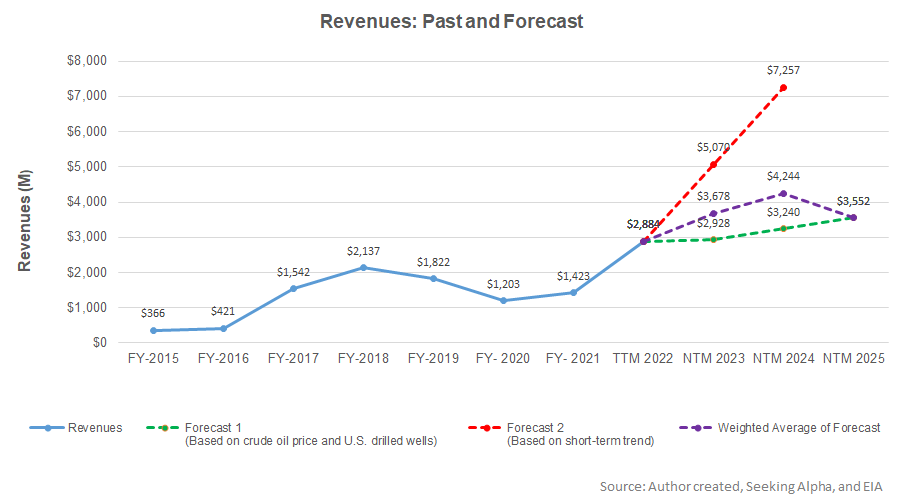
Based on a regression equation between the key industry indicators (crude oil price and drilled rigs) and NEX’s reported revenues, as well as its past four-quarter revenues, I expect its revenues to increase by 28% over the next 12 months (or NTM 2023). The topline growth can moderate to 15% in NTM 2024.

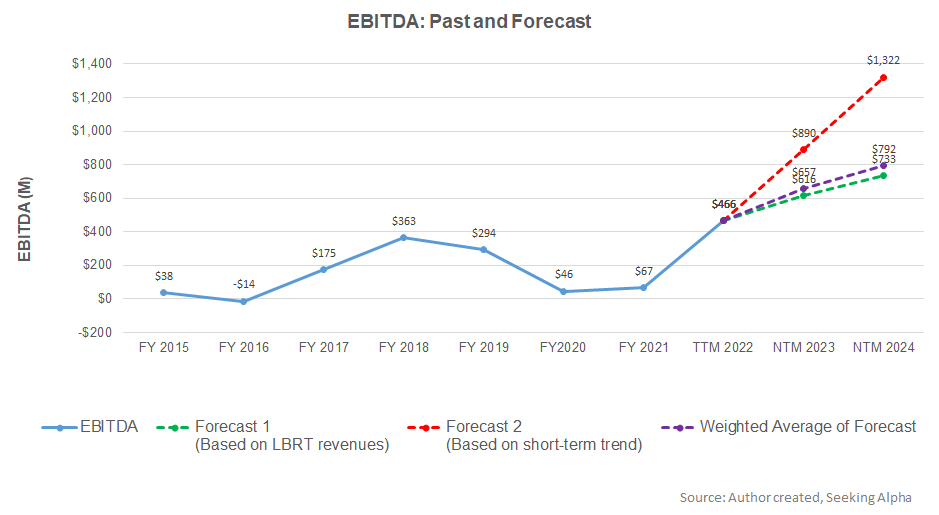
Based on the regression model using the average forecast revenues, I expect the company’s EBITDA to increase by 41% in NTM 2023 and 21% in NTM 2024.

Target Price And Relative Valuation

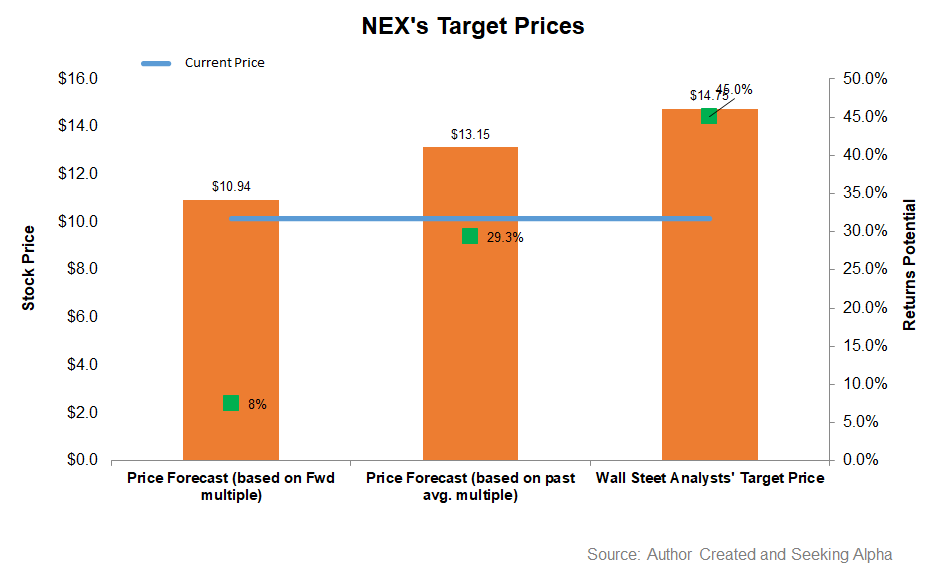
EV has been calculated using the forward and past five-year average multiple. Returns potential (8% upside) using the forward EV/EBITDA multiple (4.4x) is lower than Wall Street’s sell-side analyst expectations (45% upside) and the past average EV/EBITDA multiple (29% upside) from the stock.

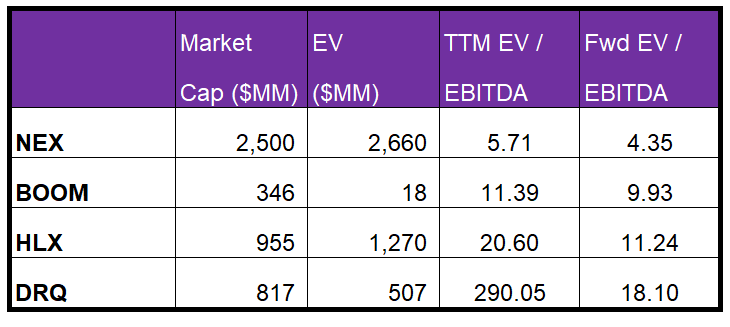
NEX’s forward EV-to-EBITDA multiple contraction versus the current EV/EBITDA is less steep than peers, which typically reflects a lower EV/EBITDA multiple than its peers. The stock’s EV/EBITDA multiple (5.7x) is much lower than its peers’ (BOOM, HLX, and DRQ) average. The current multiple is also lower than its five-year average (24.7x). So, relative valuation-wise, the stock is reasonably valued at the current level with a positive bias.

Analyst Rating And Target Price

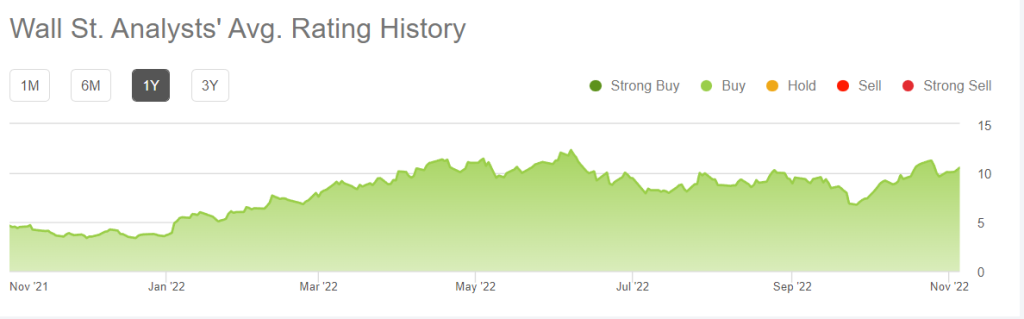
According to data provided by Seeking Alpha, seven sell-side analysts rated NEX a “buy” in the past 90 days (including “Strong Buy”), while three of the analysts rated it a “hold.” None of the analysts rated it a “sell.” The consensus target price is $17.75, suggesting a 45% upside at the current price.

What’s The Take On NEX?

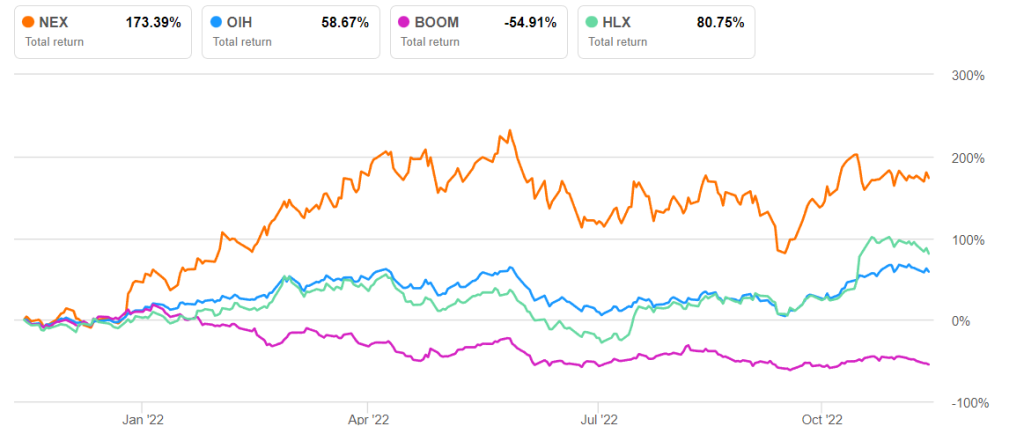
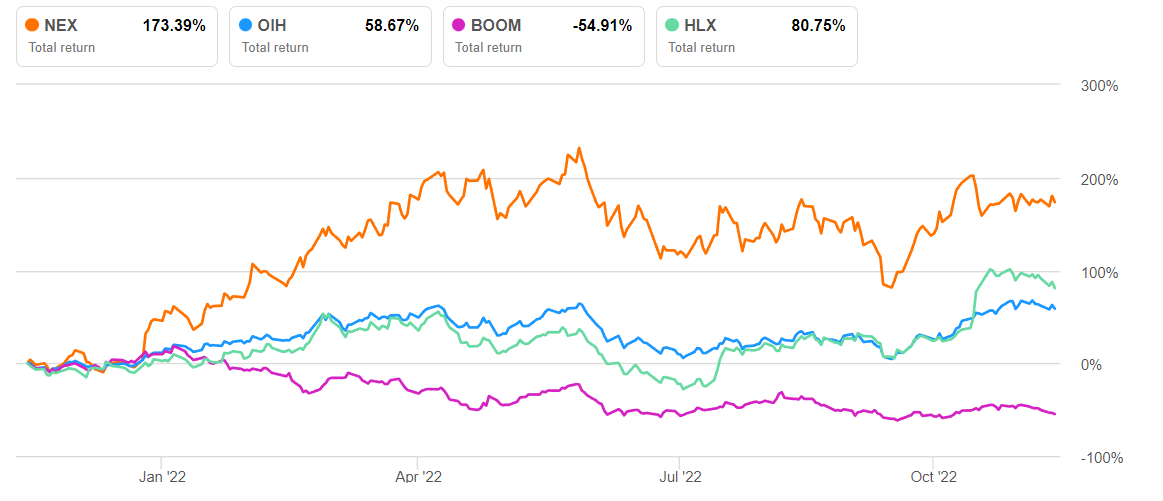
By late 2022, NEX believes it will benefit from a multi-year upcycle. In the short-term, energy supply restrictions would favor a crude oil price rise. The company will look to preserve its market share in natural gas-powered equipment fleets. Its fleets remained “sold out” by September. It plans to expand the wellsite integration platform, enhance the last-mile logistics platform, and upgrade ancillary frac equipment. The advantages are reflected in the steep rise in cash flows in 9M compared to the previous year. So the stock significantly outperformed the VanEck Vectors Oil Services ETF (OIH) in the past year.

NEX does not plan to deploy any additional horsepower in the near term. Its topline will likely stagnate as seasonal energy market slowness hits the industry. Operating profit, however, will go unchecked as the cost control efforts materialize. Also, positive free cash flow generation can reduce net leverage and achieve zero net debt by 2023. The stock is reasonably valued relative to its peers at this level. Investors might want to hold the stock for an upside in the medium term.

Previous Post

NexTier Oilfield Part 1: Free Cash Flow Improves Shareholders’ Returns

Next Post

Year-Over-Year Oil Data (USA)

Related Posts

Halliburton’s Perspective in Q1: KEY Takeaways
Market Trends

Halliburton’s Perspective in Q1: KEY Takeaways

May 16, 2025
STEP Energy Services: Q1 TAKE THREE
Market Trends

STEP Energy Services: Q1 TAKE THREE

May 15, 2025
Market Sentiment Tracker: Demand Holds, Cracks Widen
Market Trends

Market Sentiment Tracker: Demand Holds, Cracks Widen

May 14, 2025
Monday Macro View: What is the connection between Frac Job Count and OPEC’s production? Enterprise Subscribers
Market Trends

Monday Macro View: What is the connection between Frac Job Count and OPEC’s production? Enterprise Subscribers

May 12, 2025
Liberty Energy’s Perspective in Q1: KEY Takeaways
Market Trends

Liberty Energy’s Perspective in Q1: KEY Takeaways

May 12, 2025
KLX Energy Services: Q1 TAKE THREE
Market Trends

KLX Energy Services: Q1 TAKE THREE

May 9, 2025
Next Post
Year-Over-Year Oil Data (USA)

Year-Over-Year Oil Data (USA)

Please login to join discussion

Recent News

Halliburton’s Perspective in Q1: KEY Takeaways

Halliburton’s Perspective in Q1: KEY Takeaways

May 16, 2025
STEP Energy Services: Q1 TAKE THREE

STEP Energy Services: Q1 TAKE THREE

May 15, 2025
FREE READ: Oil Markets Trying to find direction

FREE READ: Oil Markets Trying to find direction

May 14, 2025
Market Sentiment Tracker: Demand Holds, Cracks Widen

Market Sentiment Tracker: Demand Holds, Cracks Widen

May 14, 2025
Monday Macro View: What is the connection between Frac Job Count and OPEC’s production? Enterprise Subscribers

Monday Macro View: What is the connection between Frac Job Count and OPEC’s production? Enterprise Subscribers

May 12, 2025
Primary Vision

Established in 2011, we are renowned for our expert frac data and analytics, providing a rich array of unique indicators and industry commentary.

CONTACT

+1-713-554-4977
info@primaryvision.co

SOCIAL NETWORKS

POLICIES

Privacy Policy
Terms of Use

PARTNERS

Amazon Web Services

TRUSTED SITES

Logo

Logo

RECENT NEWS

Halliburton’s Perspective in Q1: KEY Takeaways

Halliburton’s Perspective in Q1: KEY Takeaways

May 16, 2025
STEP Energy Services: Q1 TAKE THREE

STEP Energy Services: Q1 TAKE THREE

May 15, 2025
FREE READ: Oil Markets Trying to find direction

FREE READ: Oil Markets Trying to find direction

May 14, 2025
Market Sentiment Tracker: Demand Holds, Cracks Widen

Market Sentiment Tracker: Demand Holds, Cracks Widen

May 14, 2025
Monday Macro View: What is the connection between Frac Job Count and OPEC’s production? Enterprise Subscribers

Monday Macro View: What is the connection between Frac Job Count and OPEC’s production? Enterprise Subscribers

May 12, 2025
  • HOME
  • ABOUT US
  • RESEARCH
  • EVENTS
  • PRESS
  • SUPPORT
  • FAQ
  • LATEST NEWS
  • LOGIN
  • SIGN UP!

© 2025 Primary Vision. All rights reserved.

  • HOME
  • ABOUT US
    • ABOUT US
    • PRIMARY VISION AI INNOVATIONS
  • RESEARCH
    • INSIGHTS & ARTICLES
    • FREE ARTICLES
  • EVENTS
  • PRESS
  • SUPPORT
  • FAQ
  • LATEST NEWS
  • LOGIN
  • SIGN UP!
    • FRAC SPREAD COUNT SIGN-UP!
    • ENTERPRISE SUBSCRIPTION PLAN SIGN UP!

© 2025 Primary Vision. All rights reserved.