[
A Potent Merger
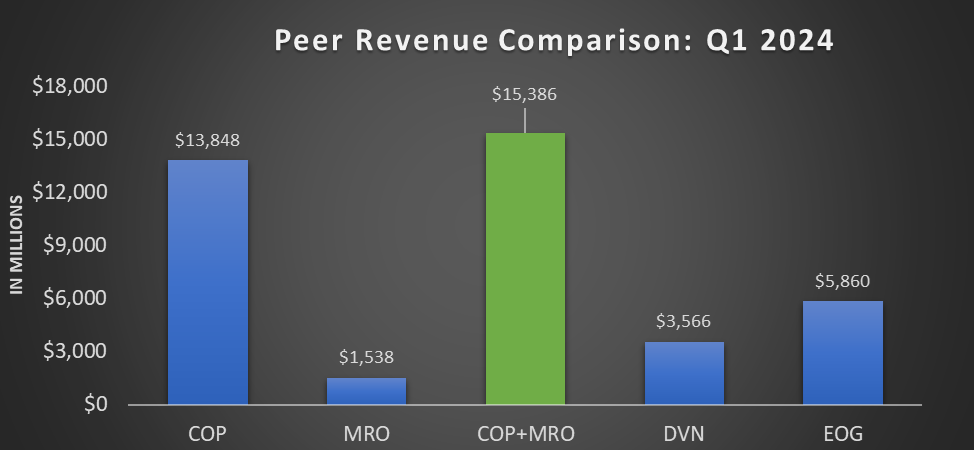
On May 29, ConocoPhillips (COP), one of the largest US energy producers, and Marathon Oil (MRO) announced a merger deal agreement. COP will acquire MRO for $22.5 billion of enterprise value. Combined, it would create a $174 billion enterprise-value international energy behemoth. Following the news break, MRO moved up by +8.4% while COP reacted cautiously, dropping -3.1%. MRO is primarily a US energy producer, while COP has a well-diversified asset base in the US and internationally.
Merger And Synergy Details
MRO shareholders will receive 0.2550 shares of COP common stock for each MRO share. This represents a 14.7% premium to the closing share price of May 28. The transaction is expected to close in Q4 2024.
MRO has a global asset base and strong balance sheet and is focused on achieving operational excellence. The company expects the merger to be accretive to COP’s earnings and cash flows and improve the return on capital per share. It expects to achieve $500 million in cost and capital synergies in a year after the merger. Reduced SG&A costs, lower operating costs, and improved capital efficiency should lead to synergy. In the US onshore, the merger will add 2 billion barrels of energy resources with less than $30 per barrel of average point forward cost.
Production Guidance
The pro-forma merged company is expected to have natural resources exceeding 2 billion barrels of oil equivalents spreading across major shale basins. With an average supply cost of $30 per barrel of WTI, its 2024 production can be approximately 390 MBOED. It also has 1,000 re-fracs with upside potential. Besides having premier positions in the key US shales, including Eagle Ford, Bakken, Delaware, and Anadarko, it will have ~2MTPA of net LNG capacity in Equatorial Guinea.
With increased scale, merger cost synergies, and premium acreage quality, COP plans to increase dividends by 34% to $0.20 per share in Q4 2024. It can also increase its share buyback program by $2 billion – from $5 billion to $7 billion. Its cash flow from operations can also increase by 30%, eventually lowering the company’s FCF breakeven point.
Operations Comparison And Growth
COP is one of the largest energy producers. Approximately 70% of its US onshore production comes from the oil-rich Permian basin, while the rest accrues from Eagle Ford and Bakken. In Q1, its share of revenues from international markets increased by 200 basis points from a quarter earlier because its international market sales increased by 5.4%. In contrast, sales in the US onshore decreased by 3.7%, quarter-on-quarter.
Despite steady volume, the company’s earnings decreased in Q1 due to lower prices and higher costs. Some critical international projects for COP include Surmont Pad 267 in Canada, several sub-sea tiebacks in Norway, and another project in China. During Q1, it started the second phase of its central processing facility in Canada. In Q2, COP’s production can increase by 1.5% compared to Q1.
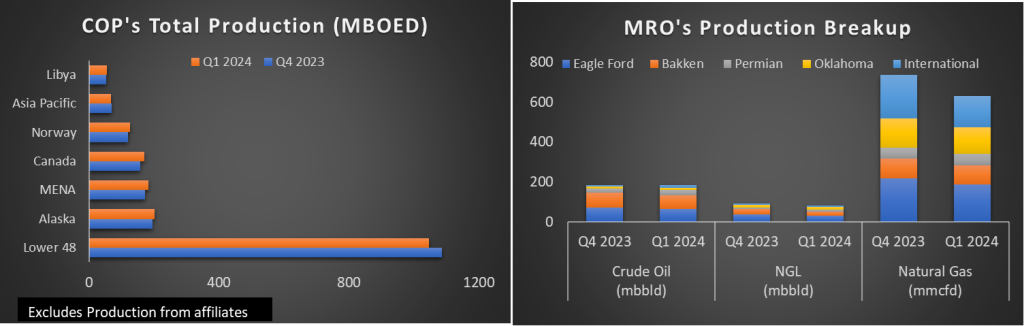
MRO is primarily a US-based producer with operations scattered in Eagle Ford, Bakken, Permian, and Oklahoma. In Q1, its total production decreased by 8.2% compared to Q4 2023. Adverse weather in Bakken primarily caused production to drop, although its crude oil and natural gas production fell nearly across the basins it operates. During Q1, it diverted a portion of its Alba gas (in Equatorial Guinea) from AMPCO methanol sales to higher-margin LNG sales, which caused the volume shrinkage.
Among the key developments, MRO made the final investment decision on two Alba infill wells and contracted a rig in West Africa. The initiative will mitigate the loss in Alba and may lead to a relatively flat production profile from FY2024 to FY2026. 2024 MRO’s total production (MBOED) can increase by 5.1% versus Q1. According to Primary Vision’s data, Halliburton and Liberty provide pressure pumping services for COP, while ProFrac, Halliburton, and other small pumpers work for MRO.
Price And Financial Performances
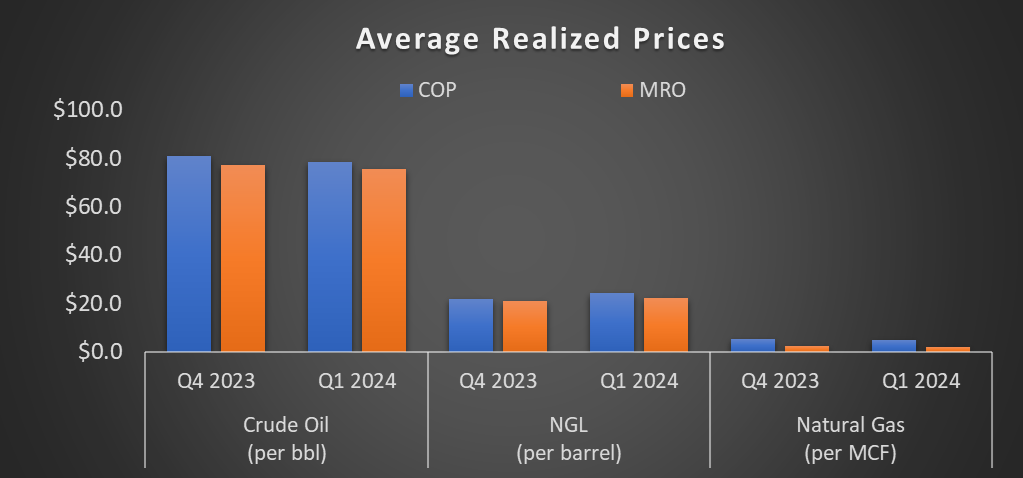
From Q4 2023 to Q1 2024, the average realized crude oil and natural prices dropped more sharply for MRO than COP. Both companies saw higher NGL prices in the past quarter, but prices improved more sharply for COP. Volume-wise, COP’s total production (MBOED) remained unchanged from Q4 2023 to Q1 2024, while it decreased by 8% for MRO. As a result of better pricing dynamics and sales volume resiliency, COP’s net income declined by 15% versus 25% for MRO from Q4 to Q1.
Debt And Cash Flows
In Q1 2024, COP produced a much more robust free cash flow than MRO. COP’s FCF was $1.06 billion against a meager $154 million in FCF for MRO.
As of March 31, COP had a total long-term debt of $17.3 billion and a debt-to-equity ratio of 0.35x. Through the proposed acquisition, COP will assume $5.4 billion of net debt.
Relative Valuation
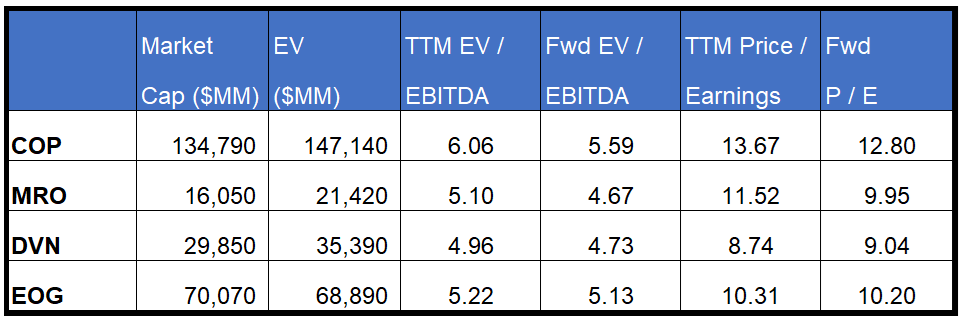
COP’s forward EV/EBITDA multiple is expected to contract versus the current EV/EBITDA. The rate of contraction is similar to MRO’s. This implies that COP’s EBITDA is expected to rise nearly as much as the EBITDA for MRO in the next year. Also, the rate of contraction is steeper than that of its peers, which implies that COP’s and MRO’s EBITDA can rise more sharply than that of its peers.
This should typically result in a higher EV/EBITDA multiple for COP and MRO than its peers. While COP’s EV/EBITDA multiple (6.1x) exceeds its peers’ (DVN and EOG) average, MRO’s multiple falls short. So, COP appears to be reasonably valued, while MRO appears to be undervalued compared to its peers. COP’s and MRO’s current EV/EBITDA multiples are at a mild discount to their past five-year averages.
How Does The Merger Look?
Both COP and MRO, being diversified energy producers, have plenty of common ground to share and optimize operations. MRO’s focus on select US basins will sharpen COP’s offerings, while COP’s international diversification can make MRO’s offerings global. While COP has US production bases in the Permian, Eagle Ford, and Bakken, MRO has its bases in Eagle Ford, Bakken, Delaware, and Anadarko. So, the operational overlap will bring significant synergy through infrastructure sharing and create an additional 2 billion barrels of energy resources with a relatively low average forward cost per barrel. Both companies have forecasts for increased production in the near-to-medium term, which reflects the rising activity levels.
However, both companies face operational challenges. In Q1, crude oil, NGL, and natural gas production in most of the regions decreased quarter-over-quarter. MRO, in particular, transitions in one of its gas fields in Equatorial Guinea. Also, these companies’ average realized prices decreased in Q1, more so for MRO than COP. NGL prices, however, provided relief, so their revenues and net income experienced a sharp downturn in Q3.
However, in 2024, the outlook can brighten. The LNG market has huge export potential for US natural gas producers. Also, the relative stability in international operations can keep the combined company’s cash flows stable and improve. For two companies that are entrenched in similar shale basins, the realization of cost reductions and revenue synergies can be easier. Nonetheless, both shares are trading at relatively fair relative valuation multiples, although MRO has some upsides left. Much, however, will depend on the stability of the energy prices.


