Completion Operation Outlook
We have already discussed STEP Energy Services’ (STEP) Q2 2024 financial performance in our recent article. Here is an outline of its strategies and outlook. STEP aims to secure long-term agreements with large clients because the process ensures steady and predictable utilization. Given the rise in the amount of proppant it pumped, the company’s year-over-year fracturing operations increased in Q2. Sand volume increased by 60% year-over-year in Q2. Activity levels in its coiled tubing and fluid services also notched up in Q2, following a focus on collaborating with clients with large-scale completion programs.
The company expects its fracturing and coiled tubing divisions to stabilize in Q3 through Q4, although activities can decrease compared to Q2. It anticipates a slowdown in activity during Q4 as clients exhaust their capital budgets. In 2025, however, activities can bounce back following the TMX and the completion of LNG Canada. In Q1 2025, its Canada performance can mirror Q1 2024.
STEP’s US performance can be challenging because of the oversupply of fracturing equipment in the region. In Q2, the fracturing operating days declined versus Q1. There was pricing pressure, too, although the large clients (blue-chip operators) were relatively more active. The company expects budget constraints to hit its US demand and performance in Q4. The US coiled tubing business saw increasing activity levels in Q2. During the quarter, the company brought new technologies to the well sites, including real-time data acquisition tools STEP-conneCT, Eline, and ultra-deep capacity coiled tubes. It also reactivated an additional coiled tubing due to higher demand. The company continued to integrate hydraulic fracturing, pump downs, coiled tubing, and the logistics of sand and chemicals to enhance its value proposition.
In 2025, STEP’s performance can turn around. It has a diversified business model, both operationally and geographically. This allows it to shift assets to profit-generating regions when long-term opportunities arise. The growth in its coal tubing service line will be more linear. Strategically, it focuses on generating free cash flow to support a shareholder return model of debt reduction and share buybacks.
Emission-related Update
Currently, STEP has two frac spreads that can go to work, and it has been upgraded to dual fuel. Because the company does not plan to run it at a loss, it will be cautious about reactivating any new frac spread until they are profitable.
Q2 Performance Analysis
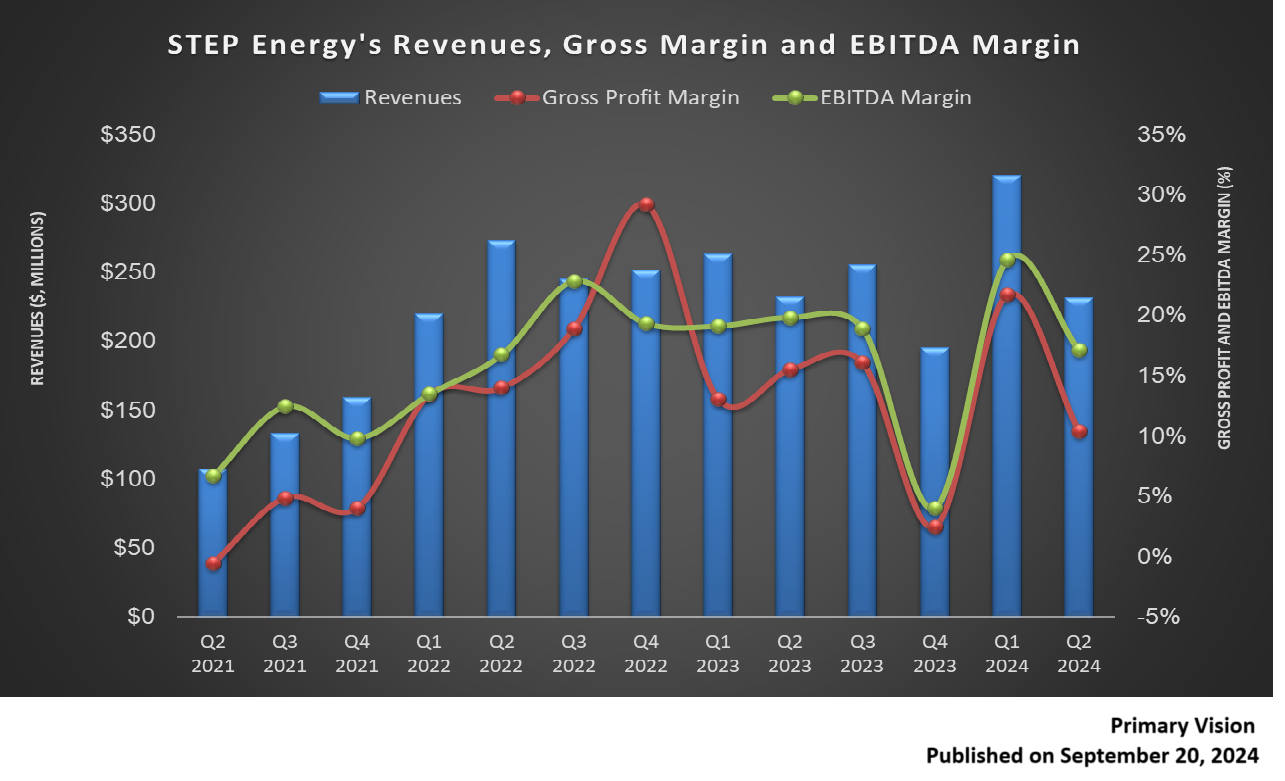
Year-over-year, STEP’s revenues increased by 18% in Canada but took a steep downturn (27% down) in the US in Q2 2024. However, its adjusted EBITDA margin contracted in both regions, more so in the US. STEP’s cash flow remained nearly unchanged (3% down) in 6M 2024 compared to a year ago. However, its capex increased sharply following the upgrade of fracturing fleets with the Tier 4 dual-fuel engine technology. As a result, its free cash flow decreased by 47% during this period. It has purchased ~1.9 million shares at an average price of $4.16 per share. On June 30, the company estimated that its book value per share was $5.70.
Relative Valuation
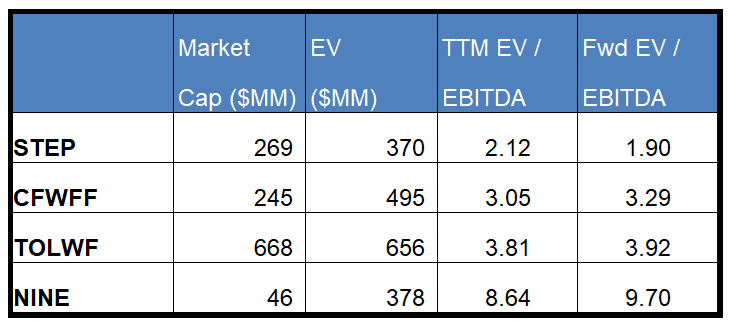
STEP is currently trading at an EV/EBITDA multiple of 2.1x. Based on sell-side analysts’ EBITDA estimates, the forward EV/EBITDA multiple is lower, at 1.9x.
STEP’s forward EV/EBITDA multiple contraction versus the current EV/EBITDA contrasts with its peers because its EBITDA is expected to increase versus a slight fall in EBITDA for its peers in the next year. This typically results in a premium in the EV/EBITDA multiple compared to its peers. However, the stock’s EV/EBITDA multiple is significantly lower than its peers’ (CFWFF, TOLWF, and NINE) average. So, the stock is undervalued compared to its peers.
Final Commentary
After Q2, STEP emphasizes on securing long-term agreements with large clients to stabilize its asset utilization. During Q2, activity levels in its coiled tubing and fluid services improved due to the company’s relationship with large clients. In the US, fracturing activities continue to face pricing challenges due to oversupply. So, it focuses on advancing its coiled tubing operations and upgrading its pumps to dual fuel models. In Canada, frac activities will likely return with the completion of a few key energy projects in the region.
STEP will aim to leverage its diversified and integrated business model as it shifts assets to profit-generating regions when long-term opportunities arise. Also, the company’s cash flows were relatively stable in 1H 2024. It continues to repurchase shares. The stock is undervalued versus its peers.


