Primary Vision
  • HOME
  • ABOUT US
    • ABOUT US
    • PRIMARY VISION AI INNOVATIONS
  • RESEARCH
    • INSIGHTS & ARTICLES
    • FREE ARTICLES
  • EVENTS
  • PRESS
  • SUPPORT
  • FAQ
  • LATEST NEWS
  • LOGIN
  • SIGN UP!
    • FRAC SPREAD COUNT SIGN-UP!
    • ENTERPRISE SUBSCRIPTION PLAN SIGN UP!
  • HOME
  • ABOUT US
    • ABOUT US
    • PRIMARY VISION AI INNOVATIONS
  • RESEARCH
    • INSIGHTS & ARTICLES
    • FREE ARTICLES
  • EVENTS
  • PRESS
  • SUPPORT
  • FAQ
  • LATEST NEWS
  • LOGIN
  • SIGN UP!
    • FRAC SPREAD COUNT SIGN-UP!
    • ENTERPRISE SUBSCRIPTION PLAN SIGN UP!
No Result
View All Result
Primary Vision
Home Market Trends

Calfrac Well Services Part 2: Estimates And Valuation

Avik Chowdhury by Avik Chowdhury
April 19, 2022
in Market Trends
0
Calfrac Well Services Part 2: Estimates And Valuation

  • Revenue estimates suggest higher revenues in NTM 2022, but the topline can flatten or decrease afterward
  • EBITDA can increase significantly in NTM 2022 and decelerate afterward
  • The stock is reasonably valued versus its peers

In Part 1 of this article, we discussed Calfrac’s outlook, performance, and financial condition. In this part, we will discuss more.

Linear Regression Based Revenue Forecast

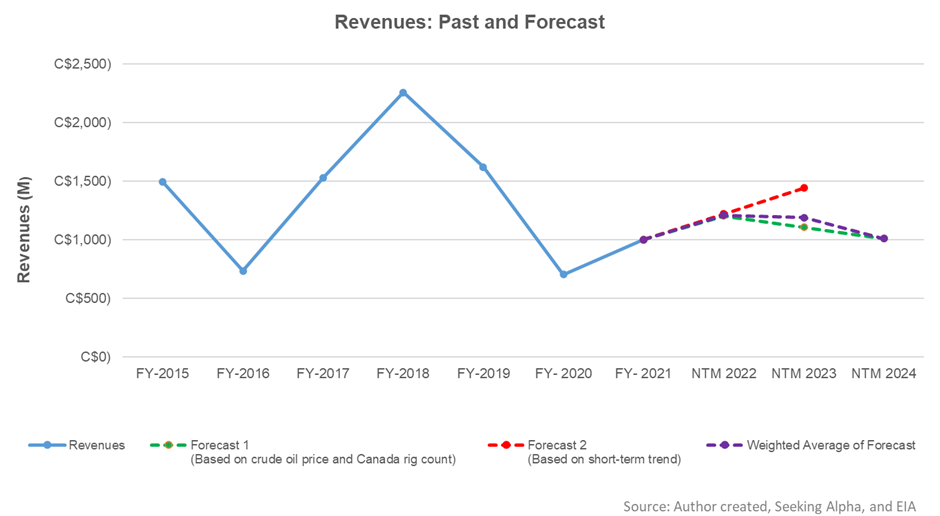
Based on a regression equation between the key industry indicators (crude oil price and Canada rig count) and Calfrac’s reported revenues for the past seven years and the previous four-quarters, I expect its revenues to increase in the next 12 months (or NTM) in 2022. The growth rate can decelerate or may even fall in the following year.

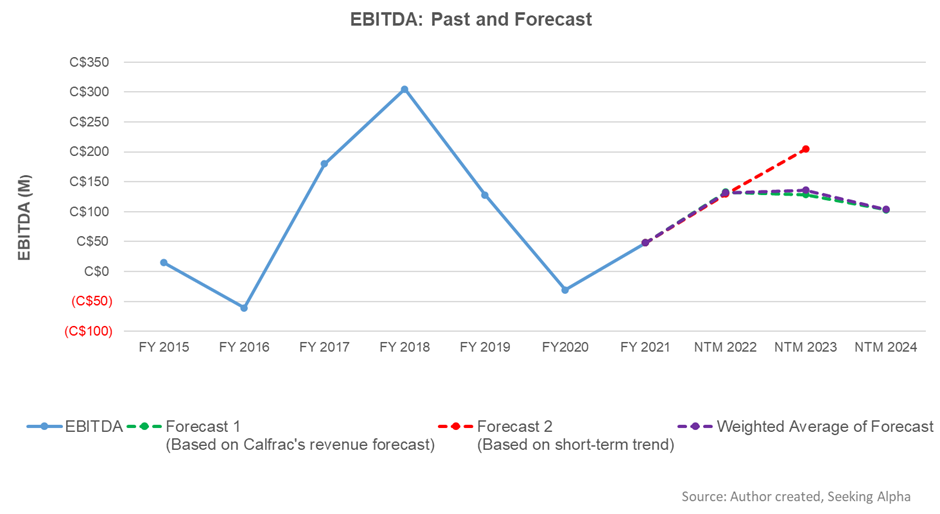
Based on the same regression models and the forecast revenues, I expect the company’s EBITDA to step up substantially in NTM 2022. The model suggests the EBITDA growth rate will slow down significantly in NTM 2023.

Target Price And Relative Valuation

Returns potential using Wall Street analysts’ estimates is lower (32.5% upside) than returns (52% upside) using the forward EV/Revenue multiple (4.77x) from the stock.

Calfrac’s forward EV-to-EBITDA multiple contraction versus the adjusted EV/EBITDA is significantly sharper because its EBITDA is expected to increase more sharply than its peers in the next year. This should typically result in a higher EV/EBITDA multiple than peers. The company’s EV/EBITDA multiple (12.7x) is higher than its peers’ (NBR, TOLWF, and NINE) average of 11.2x. The stock is reasonably valued at this level compared to its peers.

What’s The Take On Calfrac?

Calfrac has started the year with a strong tailwind in the US. Calfrac’s US operation ramped up as it doubled its frac fleet in that region. The company’s Canada operation has remained steady in 2022 but may see another fleet added during the year. The falling idle capacity in the fracking market has also helped improve pricing in the industry.

However, the company does have a few roadblocks. As Russia’s Ukraine invasion continues, the company’s operations in Russia face uncertainty and may also see revenues falling. While frac fleet and coiled tubing reactivation are rising, so does the reactivation cost. Also, this led to a much higher working capital requirement, resulting in negative cash flows. So, the stock significantly underperformed the VanEck Vectors Oil Services ETF (OIH) in the past year. Nonetheless, the stock has sufficient upside from the rising activity level in the industry. Investors can hold with the prospect of higher returns in the medium to long term.

Previous Post

Calfrac Well Services Part 1: Cash Flow Concerns Versus Growing Activity

Next Post

Primary Vision Insights – April 20th 2022

Related Posts

Halliburton’s Perspective in Q1: KEY Takeaways
Market Trends

Halliburton’s Perspective in Q1: KEY Takeaways

May 16, 2025
STEP Energy Services: Q1 TAKE THREE
Market Trends

STEP Energy Services: Q1 TAKE THREE

May 15, 2025
Market Sentiment Tracker: Demand Holds, Cracks Widen
Market Trends

Market Sentiment Tracker: Demand Holds, Cracks Widen

May 14, 2025
Monday Macro View: What is the connection between Frac Job Count and OPEC’s production? Enterprise Subscribers
Market Trends

Monday Macro View: What is the connection between Frac Job Count and OPEC’s production? Enterprise Subscribers

May 12, 2025
Liberty Energy’s Perspective in Q1: KEY Takeaways
Market Trends

Liberty Energy’s Perspective in Q1: KEY Takeaways

May 12, 2025
KLX Energy Services: Q1 TAKE THREE
Market Trends

KLX Energy Services: Q1 TAKE THREE

May 9, 2025
Next Post
Primary Vision Insights – April 20th 2022

Primary Vision Insights – April 20th 2022

Please login to join discussion

Recent News

Halliburton’s Perspective in Q1: KEY Takeaways

Halliburton’s Perspective in Q1: KEY Takeaways

May 16, 2025
STEP Energy Services: Q1 TAKE THREE

STEP Energy Services: Q1 TAKE THREE

May 15, 2025
FREE READ: Oil Markets Trying to find direction

FREE READ: Oil Markets Trying to find direction

May 14, 2025
Market Sentiment Tracker: Demand Holds, Cracks Widen

Market Sentiment Tracker: Demand Holds, Cracks Widen

May 14, 2025
Monday Macro View: What is the connection between Frac Job Count and OPEC’s production? Enterprise Subscribers

Monday Macro View: What is the connection between Frac Job Count and OPEC’s production? Enterprise Subscribers

May 12, 2025
Primary Vision

Established in 2011, we are renowned for our expert frac data and analytics, providing a rich array of unique indicators and industry commentary.

CONTACT

+1-713-554-4977
info@primaryvision.co

SOCIAL NETWORKS

POLICIES

Privacy Policy
Terms of Use

PARTNERS

Amazon Web Services

TRUSTED SITES

Logo

Logo

RECENT NEWS

Halliburton’s Perspective in Q1: KEY Takeaways

Halliburton’s Perspective in Q1: KEY Takeaways

May 16, 2025
STEP Energy Services: Q1 TAKE THREE

STEP Energy Services: Q1 TAKE THREE

May 15, 2025
FREE READ: Oil Markets Trying to find direction

FREE READ: Oil Markets Trying to find direction

May 14, 2025
Market Sentiment Tracker: Demand Holds, Cracks Widen

Market Sentiment Tracker: Demand Holds, Cracks Widen

May 14, 2025
Monday Macro View: What is the connection between Frac Job Count and OPEC’s production? Enterprise Subscribers

Monday Macro View: What is the connection between Frac Job Count and OPEC’s production? Enterprise Subscribers

May 12, 2025
  • HOME
  • ABOUT US
  • RESEARCH
  • EVENTS
  • PRESS
  • SUPPORT
  • FAQ
  • LATEST NEWS
  • LOGIN
  • SIGN UP!

© 2025 Primary Vision. All rights reserved.

  • HOME
  • ABOUT US
    • ABOUT US
    • PRIMARY VISION AI INNOVATIONS
  • RESEARCH
    • INSIGHTS & ARTICLES
    • FREE ARTICLES
  • EVENTS
  • PRESS
  • SUPPORT
  • FAQ
  • LATEST NEWS
  • LOGIN
  • SIGN UP!
    • FRAC SPREAD COUNT SIGN-UP!
    • ENTERPRISE SUBSCRIPTION PLAN SIGN UP!

© 2025 Primary Vision. All rights reserved.