Primary Vision
  • HOME
  • ABOUT US
    • ABOUT US
    • PRIMARY VISION AI INNOVATIONS
  • EFRACS
  • RESEARCH
    • INSIGHTS & ARTICLES
    • FREE ARTICLES
  • EVENTS
  • PRESS
  • SUPPORT
  • FAQ
  • LATEST NEWS
  • LOGIN
  • SIGN UP!
    • FRAC SPREAD COUNT SIGN-UP!
    • ENTERPRISE SUBSCRIPTION PLAN SIGN UP!
  • HOME
  • ABOUT US
    • ABOUT US
    • PRIMARY VISION AI INNOVATIONS
  • EFRACS
  • RESEARCH
    • INSIGHTS & ARTICLES
    • FREE ARTICLES
  • EVENTS
  • PRESS
  • SUPPORT
  • FAQ
  • LATEST NEWS
  • LOGIN
  • SIGN UP!
    • FRAC SPREAD COUNT SIGN-UP!
    • ENTERPRISE SUBSCRIPTION PLAN SIGN UP!
No Result
View All Result
Primary Vision
Home Market Trends

Year-Over-Year Oil Data (USA)

Matthew Johnson by Matthew Johnson
May 12, 2022
in Market Trends
0
Year-Over-Year Oil Data (USA)

I have captured industry data, as it relates to the previous business week.

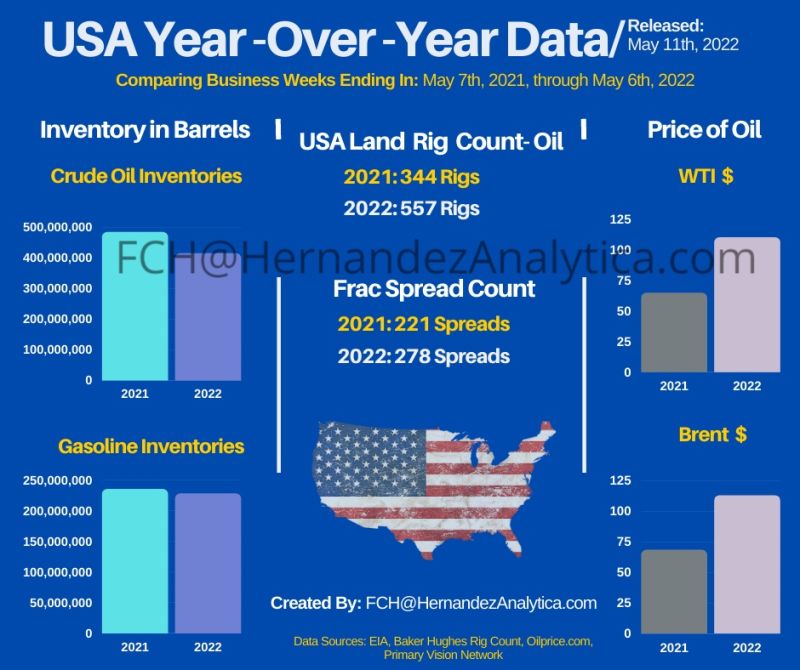
The oil rig count has increased by 5. Notably, for 7 consecutive weeks the count has set a new high is set for 2022. Also, the price for Brent and WTI crude has increased by over 40.00 USD over the course of a year.

The below information that further complements the #infographic:

(Oil Rig Count: Baker Hughes report)
• May 7th, 2021: 344
• May 6th, 2022: 557

(Primary Vision Network – Frac Spread Count)
• May 7th, 2021: 221
• May 6th, 2022: 278

(Oilprice site: #WTI price:)
• May 7th, 2021: 64.90 USD
• May 6th, 2022: 110.24 USD

(OilPrice site: Brent Crude price)
• May 7th, 2021: 68.28 USD
• May 6th, 2022: 112.83 USD

(EIA Crude Oil Inventories: agency reports with a week delay)
• April 30th, 2021: 485,117,000 Barrels
• April 29th, 2022: 415,727,000 Barrels

(EIA Gasoline Inventories: agency reports with a week delay)
• April 30th, 2021: 235,811,000 Barrels
• April 29th, 2022: 228,575,000 Barrels

Previous Post

Liberty Energy Part 2: Estimates And Relative Valuation

Next Post

Nabors Industries Part 1: Pricing Gains And North American Recovery Offset Balance Sheet Woes  

Related Posts

Market Sentiment Tracker: Crude Builds, Payroll Misses by 30K, Germany Factory Orders Crash
Market Trends

Market Sentiment Tracker: Crude Builds, Payroll Misses by 30K, Germany Factory Orders Crash

July 9, 2025
Monday Macro View: How does Frac Job Count explain the divergence between global and U.S. inventories?
Market Trends

Monday Macro View: How does Frac Job Count explain the divergence between global and U.S. inventories?

July 7, 2025
Market Sentiment Tracker: Mixed Signals from Global Economy
Market Trends

Market Sentiment Tracker: Mixed Signals from Global Economy

July 1, 2025
Monday Macro View: Is the Global Oil Sector Deteriorating?
Market Trends

Monday Macro View: Is the Global Oil Sector Deteriorating?

June 30, 2025
STEP Energy Services’ Perspective in Q1: KEY Takeaways
Market Trends

STEP Energy Services’ Perspective in Q1: KEY Takeaways

June 30, 2025
KLX Energy Services’ Perspective in Q1: KEY Takeaways
Market Trends

KLX Energy Services’ Perspective in Q1: KEY Takeaways

June 28, 2025
Next Post
Nabors Industries Part 1: Pricing Gains And North American Recovery Offset Balance Sheet Woes  

Nabors Industries Part 1: Pricing Gains And North American Recovery Offset Balance Sheet Woes  

Please login to join discussion

Recent News

Why Are U.S. Inventories Tight While Global Stocks Rise?

Why Are U.S. Inventories Tight While Global Stocks Rise?

July 10, 2025
Free Read: Decoding the Latest Job Report

Free Read: Decoding the Latest Job Report

July 10, 2025
Market Sentiment Tracker: Crude Builds, Payroll Misses by 30K, Germany Factory Orders Crash

Market Sentiment Tracker: Crude Builds, Payroll Misses by 30K, Germany Factory Orders Crash

July 9, 2025
Monday Macro View: How does Frac Job Count explain the divergence between global and U.S. inventories?

Monday Macro View: How does Frac Job Count explain the divergence between global and U.S. inventories?

July 7, 2025
Market Sentiment Tracker: Mixed Signals from Global Economy

Market Sentiment Tracker: Mixed Signals from Global Economy

July 1, 2025
Primary Vision

Established in 2011, we are renowned for our expert frac data and analytics, providing a rich array of unique indicators and industry commentary.

CONTACT

+1-713-554-4977
info@primaryvision.co

SOCIAL NETWORKS

POLICIES

Privacy Policy
Terms of Use

PARTNERS

Amazon Web Services

TRUSTED SITES

Logo

Logo

RECENT NEWS

Why Are U.S. Inventories Tight While Global Stocks Rise?

Why Are U.S. Inventories Tight While Global Stocks Rise?

July 10, 2025
Free Read: Decoding the Latest Job Report

Free Read: Decoding the Latest Job Report

July 10, 2025
Market Sentiment Tracker: Crude Builds, Payroll Misses by 30K, Germany Factory Orders Crash

Market Sentiment Tracker: Crude Builds, Payroll Misses by 30K, Germany Factory Orders Crash

July 9, 2025
Monday Macro View: How does Frac Job Count explain the divergence between global and U.S. inventories?

Monday Macro View: How does Frac Job Count explain the divergence between global and U.S. inventories?

July 7, 2025
Market Sentiment Tracker: Mixed Signals from Global Economy

Market Sentiment Tracker: Mixed Signals from Global Economy

July 1, 2025
  • HOME
  • ABOUT US
  • EFRACS
  • RESEARCH
  • EVENTS
  • PRESS
  • SUPPORT
  • FAQ
  • LATEST NEWS
  • LOGIN
  • SIGN UP!

© 2025 Primary Vision. All rights reserved.

  • HOME
  • ABOUT US
    • ABOUT US
    • PRIMARY VISION AI INNOVATIONS
  • EFRACS
  • RESEARCH
    • INSIGHTS & ARTICLES
    • FREE ARTICLES
  • EVENTS
  • PRESS
  • SUPPORT
  • FAQ
  • LATEST NEWS
  • LOGIN
  • SIGN UP!
    • FRAC SPREAD COUNT SIGN-UP!
    • ENTERPRISE SUBSCRIPTION PLAN SIGN UP!

© 2025 Primary Vision. All rights reserved.