
- Estimates suggest revenue growth in the next couple of years
- EBITDA can stay in the red in the next year but can turn around in NTM 2024
- The model suggests a wide variability in the return potential
In Part 1 of this article, we discussed Mammoth Energy’s (TUSK) outlook, performance, and financial condition. In this part, we will discuss more.
Linear Regression Based Revenue Forecast
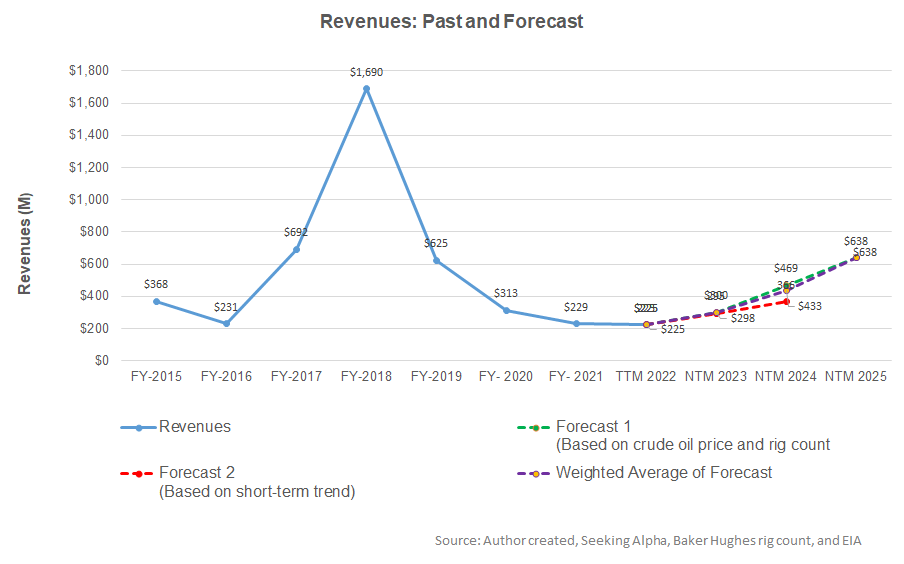
Based on a regression equation between the key industry indicators (crude oil price and rig count) and TUSK’s reported revenues for the past seven years and the previous four-quarters, I expect its revenues to increase handsomely in the next two years.
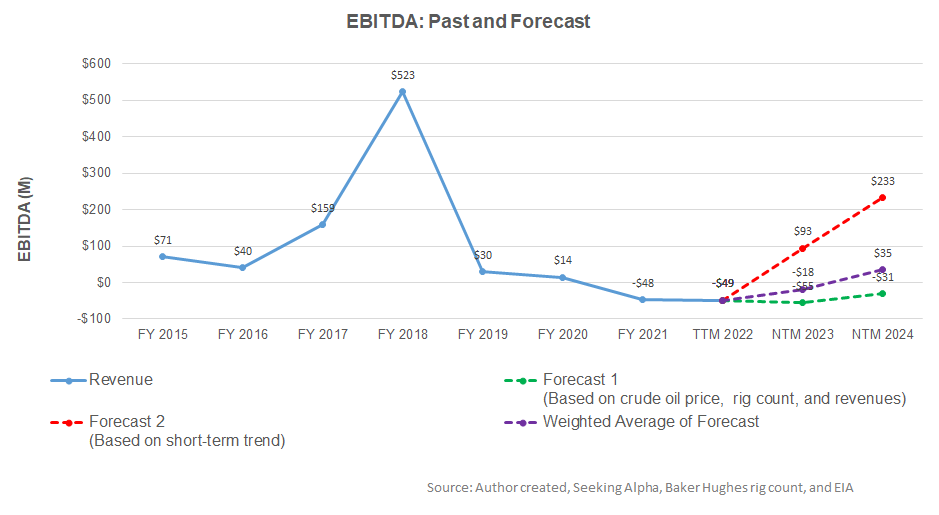
Based on the same regression models and the forecast revenues, I expect the company’s EBITDA to improve but remain negative in the next 12 months (or NTM) 2023. The model suggests the company’s EBITDA will turn around and turn positive in NTM 2024.
Target Price
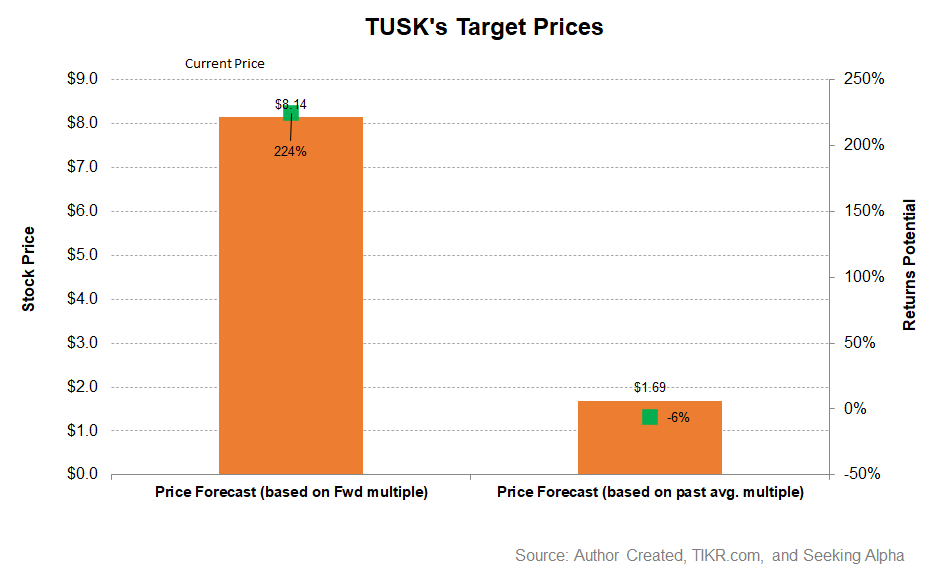
Returns potential using the forward EV/Revenue multiple (1.55x) is much higher than the past average EV/Revenue multiple (6% downside) from the stock.
Relative Valuation
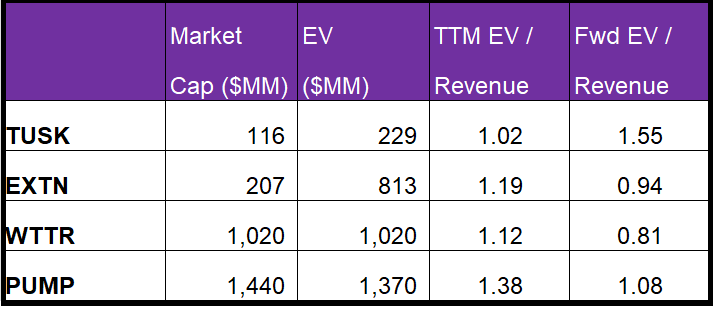
Mammoth Energy’s current EV/Revenue multiple is 1.0x. The stock’s past five-year average EV/EBITDA multiple was 0.69x. So, it is currently trading at a premium to its past average.
TUSK’s EV/Revenue multiple is lower than its peers’ (EXTN, WTTR, and PUMP) average of 1.2x. Because TUSK’s forward EV/EBITDA multiple is expanding compared to a contraction for its peers, it typically reflects a much lower EV/EBITDA multiple compared to its peers. So, the stock is reasonably valued, with a negative bias, at the current level.
What’s The Take On TUSK?
Mammoth Energy is continuously balancing between its oilfield services and the infrastructure business. Its integrated EPC capabilities and manufacturing & equipment refurbishment facility hold the edge in a competitive landscape. TUSK operated two hydraulic fracturing fleets in 2021 and added a third fleet in April. In the sand business, too, pricing improved.
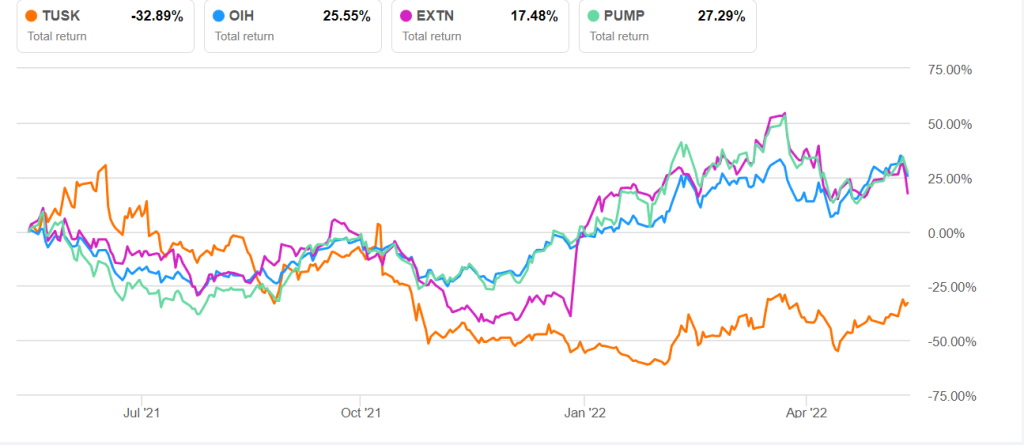
However, the US real GDP growth rate shrunk in Q1 as the trade balance did not move in US’s favor. The PREPA-related matter drags on as the company was forced to call upon the regulatory bodies to mediate a settlement. With a significant part of its accounts receivable bogging down through the PREPA contracts, negative cash flows are hardly improving the situation. So, the stock significantly underperformed the VanEck Vectors Oil Services ETF (OIH) in the past year. Although the balance sheet is relatively free from any immediate concerns, investors might want to avoid the stock in the short term.


