By Mark Rossano
SUMMARY
- US Completion Activity
- Global Refining and Refined Product Storage
- China Oil Demand and Imports
- India Economic Update on Demand and Activity
- China Economic Round-up
- Myanmar Coup
US Completion Activity
The crude markets continue driving higher under a relentless bid that is supporting activity within the US oil patch. The current pricing environment will push us over 180 spreads by the middle of February, and likely end the month at around 190 spreads. The biggest drivers for the growth remains the Permian that will be close to 100 spreads by month end as we see activity picking up in both the Delaware and Midland. The current natural gas curve will also keep the Haynesville and Appalachia business with another 1 or 2 spreads added in the basins by the middle of the month. The Bakken will emain around 10 spreads into the end of the month, but activity normally picks up as we head into March and the weather becomes a bit more favorable. The Eagle Ford and Anadarko basins will see additional capacity supported by the NGL (natural gas liquid) pricing. The NGL Frac Spread (different spread- chart below) has moved to the highs from 2018, which will be supported due to rising domestic demand and exports of LPG (Liquid Petroleum Gas). We were started to get bearish in July 2019 as we saw weakness for U.S. crude demand. The view was that 2020 US production exit rate was going to be below 2019 exit rate… obviously COVID19 accelerated that but we were already trending lower due to demand constraints. Now as activity recovers with better pricing- it will be used to hold US production flat with maybe some small growth. But we will have a horsepower problem as we approach 230-250 spreads as idled capacity is cannibalized or just too old/weathered to be viable. OFS pricing would need to rise in order to support additional capacity, which is possible if crude prices continue to rally- which calls into question: What will the OPEC+ meeting look like in April? There is still between 7-8M barrels a day of spare capacity sitting on the sidelines as global refined product sits at elevated levels, floating storage is stable to rising, and downstream demand remains soft as global activity just goes sideways as the world economy sputters along at a reduced clip.

WTI Cushing prices are now trading at $56.87 with prices over $50 all the way out to Oct’2022. The steep backwardation in the market provides an opportunity for U.S. E&Ps to hedge comfortable above $50 through 2021 and well into 2022. The below crude curve helps to show the huge shift in front month pricing all following the vaccine news and Saudi Arabia voluntarily pulling 1M barrels a day of production out of the market. E&Ps were talking about getting more active if prices could cross $50 but wouldn’t start to accelerate until we saw a sustained move above $55. Based on the below curve, prices are over $55 through July- but we can see how quickly the front months can adjust. The current pricing environment will keep E&Ps active, but US production growth isn’t in the forecast even at this price deck. It provides an opportunity for US producers to hedge- drill- complete by locking in prices, drilling backlog, and completing DUCs to hold production at 10.9M barrels a day. If we see a prolonged stay over $55, we will start to see production levels in the U.S. move higher but in a very measured move. At this priced deck, inventory of DUCs can be replenished and completion activity can support current production forecasts. Depending on location, it could provide some up lift to 2021 production levels- but it would be hard to see U.S. production go above 11.3M barrels a day at this price deck. We would need to see something over $60 on a prolonged basis to see 400k+ barrels a day added to the market. At thse prices and hedging profiles, the US could move back to 11M barrels a day, but anything beyond that would be a struggle to hold.
WTI CUSHING CRUDE CURVE

The below NGL basket is supportive of pricing but hedging in NGLs is difficult past 6 months or so due to illiquidity opposed to the availability in natural gas and crude. NGL pricing will be a strong tailwind over the next few months as regional demand remains strong, and US exports will continue to set records due to international demand for LPG. Ethane prices will be a key to watch as we have seen strong prices, which typically results in a decrease in ethane rejection- or said a different way- companies are incentivized to capture more ethane to sell as a separate product. Based on the heat value (BTU range) of a pipeline, midstream processors have an option to leave a certain amount of ethane in the stream.
MONT BELVIEU FRAC SPREAD WEEKLY PRICING

MONT BELVIEU FRAC SPREAD QUARTERLY PRICING

U.S. crude exports have stayed strong supported by the spreads late last year supporting flow that is being carried out now for delivery. The spreads started to tighten and remained at under a $1, which limited new purchases. Right now- the spread between Brent/LLS sits at $1.30 and Brent/MEH at $1.70 have helped open up some additional flow- but there will be a period over the next few weeks that will see exports drop to the low end of our expected range of 2.6M-2.8M barrels a day. Crude prices continue to price in a recovery and inflation fears, but when we do our deep dive on the “recovery” everything appears to remain flat around the world in regarding economic activity and general mobility.

Natural gas is also higher on the front months above $3 as weather remains colder in the U.S. and demand for LNG abroad remains robust. The back end of the curve still remains depressed, because while we are still moving in the seasonal trajectory the pace needs to accelerate in order for us to get back to the seasonal average. Some estimates are starting to turn a bit bullish though as LNG exports are staying robust and demand is projected to stay elevated- even against seasonal norms. The associated question is not a huge problem in the near term as crude production will hold the line at around 10.9M barrels a day. This will limit new supply into the market while demand remains elevated around the world. We remain bullish on the LNG and LPG front due to the growing demand around the world, which is project to continue a steady growth profile. LPG demand rebounded very quickly around the world after only going slightly negative on the demand front. It was the first hydrocarbon to bounce higher, and due to its flexibility of usage- demand will stay robust. U.S. exports will stay strong throughout the year especially with some structural bottlenecks at the coast alleviated. Mt. B propane pricing remains elevated along the 5-year average, which is helping to support the NGL barrel as well as the surge in ethane pricing. Ethane always struggles to hold pricing due to a relative ease of recovery, so this will be an important metric to watch over the coming month. We believe the NGL barrel will remain supportive due to sticky demand over at least the next few months.
US DOE Working Natural Gas Total Estimated Storage Data


Global Refining and Refined Product Storage
Global refining activity remains well off of seasonal norms as we continue to see product builds and increasing floating storage of crude. Russia has brought some capacity back online, but many place around the world (especially US and Europe) remain well below seasonal norms. Outages keep moving higher with another 800k barrels a day coming out of the market. Margins around the world remain compressed while the US crack stays fairly supportive of at least stable active of 82%-83% utilization rates. Those rates are still well below seasonal norms, and the arbs from Europe to US are still open with more diesel flowing into our markets. Typically, the US Gulf Coast exports diesel into Europe, but due to elevated levels in Europe and limited activity- the arb is open coming the other way. Europe is also cutting imports from the Middle East- “European imports of oil products from the Middle East, mostly diesel and other middle distillates, are poised to decline m/m in February with stockpiles growing and demand tepid, early estimates show.” We are seeing builds in the distillate pool globally with some bigger vs expected builds in Europe and Singapore as Fujairah also shows elevated levels again.


DOE PERCENT UTILIZATION REFINERY OPERABLE CAPACITY DATA

As crude prices have pushed higher- refinery margins have been hit due to the increase in feedstock pricing while the downstream components remain soft. The pressure in margins are a global problem, but some places are still better vs others. The U.S. crack spreads have been outperforming some of their peers- especially Singapore/ Europe.
US Gulf Coast WTI Cushing Crude Oil 321 Crack Spread

Singapore Dubai Hydrocracking Refinery Margin

North West Europe Refining Margin Sample

Regional data has seen driving demand remain well off of normal peak levels as most regions stay between on average 30%-40% below normal levels. Driving demand in the U.S. is well off of seasonal norms, but we should see some support in the near term as PADD 5 (California) reopening continues to roll out. Many places in the U.S. that make up large swaths of driving demand have remained open throughout the last several months- so the reduction is driven by a shift in consumer behaviors, work from home, and limiting contact even without government restrictions. To be clear- even though many places are open- there are limits placed on occupancy whether it is a store, bar, restaurant, gym, or just any place of business. But the biggest driver remains the change in consumer patterns. Many of the people who have moved from the urban to suburban setting already had many engrained shopping patterns that have carried over from city life, which is online shopping. After moving to the suburbs, these individuals and families learned that many of these delivery services are still widely available in their new homes. We have discussed in great detail, and will do so again in a few paragraphs looking at the shift to work from home and how it will limit the upside to “normalized” gasoline demand. Even with the shift to the suburbs, the increase in demand will be muted vs what the market expects and instead reside well within the 5 year average. It will also be hampered by the rapid recovery in gasoline prices (we are now averaging back at last year’s prices) that will limit some demand.
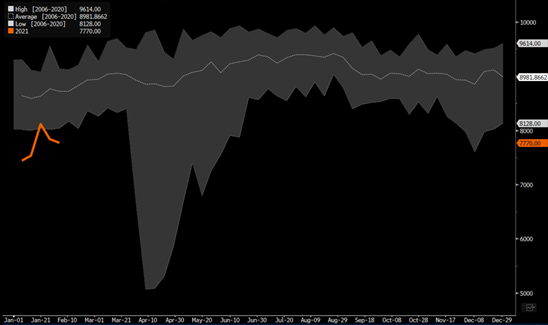

Another important factor picked up in the below data set is the steady decline in Chinese activity. Chinese New Year kicks off next week Feb 11th, and many restrictions remain in place on travel due to the outbreak of COVID19 in the country. The recent spike in cases are in rural areas that are harder to track, and for fear of spreading during the largest human migration event of the year- China has placed significant restrictions on movement. The government has leveled protocols and policies that are near impossible to comply with and are all paid for out of pocket making it very expensive. Early expectations are for demand to be down between 30%-40% from 2019 but up about 10% vs 2020. While this will clearly impact near term oil/refined product demand, China is also facing a slow down in economic activity which is an underlying problem as the consumer never truly recovered to pre-COVID levels.

The limitation on movements can clearly be seen in driving data, but also the steep drop in flights scheduled for Feb and March: “There were some 1,450 fewer departures on average each day, week-on-week, as China flights decline rapidly again. Around 2,500 flights on average per day in March have been removed from the flight schedule since last week. In China, around 10% of scheduled flights have been canceled over the coming fortnight. China Southern appears most affected with almost a third of flights canceled, but cuts appear to be short term, with capacity four-to-five weeks out remaining almost unchanged. Bottom-up analysis by BNEF suggest that cuts over the coming fortnight will reduce jet fuel demand by about 100,000 barrels per day.” It will be interesting to see how quickly some of these flights come back to the schedule as the consumer remains under pressure within China, which is providing some key support for President Xi’s push for more compliance with the communist party. The U.S. has also introduced some restrictions on international and domestic flights that is limiting passenger movements, but we are also in a seasonally slow period for activity that normally doesn’t pick back up until winter break/spring break season. Corporate travel also remains well below normal as companies focus on reducing CAPEX and utilizing virtual meetings instead of in-person. Europe still has extensive restrictions on movement with little changes happening until we get into March/April, which will keep jet fuel/ kerosene under pressure. The limitations on demand will pushed more kerosene into the distillate pool and keep storage elevated even as diesel faces some tail winds- especially in the U.S.

Middle distillate levels are very important to watch given their bellwether on the health of the global economy and the local region. The U.S. has a fairly balanced picture of demand with trucking activity, rail movements, and heating demand maintaining a steady demand cycle. The offset is the general slowness in the economy, so between those two sides of the coin- we expect to maintain seasonally normal demand. The same can’t be said for other areas in the market where storage is elevated with additional cargoes struggling to find a home. The competing factors within the US will keep storage elevated and moving sideways, which will worsen as more kerosene needs to find a home and ends up in the disty pool:
DOE DISTILLATE STORAGE LEVELS


International Enterprise Singapore Middle Distillates Singapore Stock Data

PJK International ARA Gas Oil Inventory K Tonnes

China Oil Demand and Imports
China has seen their inventories decline last week (7th decline), dropping to 990 million barrels, according to market intelligence firm Kayrros. “While that’s the least since February 2020, stockpiles are still 16% higher than a year earlier. A resurgent virus and lockdowns in parts of the country have raised concerns about a near-term demand hit, but an overall improvement in domestic travel compared with last year is contributing to the recovery. Before the coronavirus swept through the region and wiped out consumption, stockpiles at China’s 190 terminals tracked by Kayrros were at 856 million barrels in February of last year, according to the company. Inventories held around 850 million barrels throughout 2019, the company said.” The buildup in capacity is also driven by the increase in general refining capacity in the country and additional storage farms coming online throughout 2020. Even with this expansion, China’s January crude oil imports are estimated to have reached around 12 million barrels per day (bpd) by Refinitiv Oil Research on data from ports and tanker-tracking, which is up 32.4% from Dec levels of 9.06 million bpd (a 28-month low). Jan is still tracking well off the normal import levels as China works off elevated onshore storage and additional cargoes heading into their markets. Here is another breakdown of flows into China: Seaborne oil offtakes for the month held at 10.9m b/d, a gain of 2.46m b/d m/m and 907k b/d y/y. Follows a “well below average month” for Chinese oil imports, with December seaborne arrivals at 8.47m b/d, falling ~770k b/d under 2019 average. “Chinese imports remain well off seasonal norms- especially on a year/ year level. China has been a big buyer of US crude, but when we look at recent purchases from Chinese refiners- the U.S. is missing causing us to be more cautious on U.S. exports as we head into March-April. The slow down in Lunar New Year travel will create a bigger problem of working through this excess inventory. Asia- especially China- was the hopeful candidate to carry the price of crude higher, but the economic picture is deteriorating for the country and will limit how quickly we actually recover.
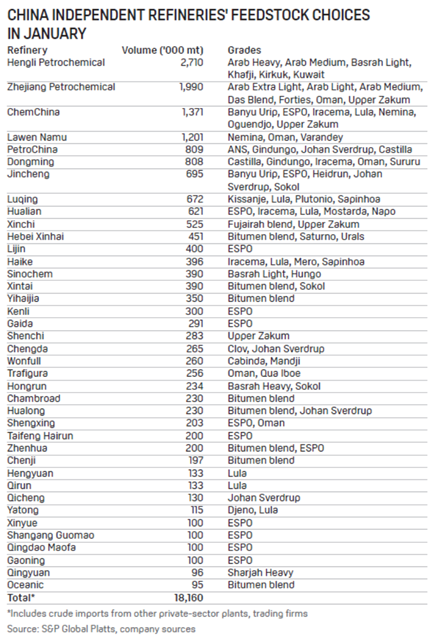
CHINA OIL IMPORTS BY METRIC TON THROUGH DEC 31st
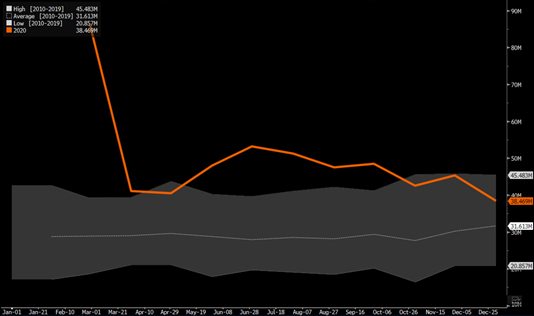
China has also seen a reduction in refiner utilization rates and an increase in floating storage as activity faces headwinds over the next 4-6 weeks. Even with the large drop in oil imports, China still maintained elevated exports of refined products:

This comes on the back of reduced refinery throughput, which is showing a small increase in net State Owned Facilities with a reduction in Shandong Independent assets. Even with this adjustment, state refiners are still operating below seasonal norms while teapots maintain elevated activity. Fuel oil stocks have shifted higher in the near term, which supports a bigger economic slow down in the region.


China Shandong Crude Stock Shandong Weekly

China Shandong Fuel Oil Stock Weekly

Crude tankers are still flagging China as their end location with ships still heading into the area well above seasonal norms:
China Supertanker Crude Imports

The lack of near-term demand and more VLCCs heading into the area will push floating storage higher in the region:
ASIAN FLOATING STORAGE

The rise in Asian floating storage is also being driven by a large drop in South Korea and Japanese demand over the last several months as each country faces their own COVID outbreaks. South Korea has faired better through the slow down vs Japan, but they have both experienced a significant drop off in demand with SK hitting a multi-year low in imports. Some of these imports should normalize with the economy seeing some recovery even as local activity remains weak in the region.

Here is a breakdown of flows into the region- India remains a bright spot in the region as COVID cases decline and activity picks up.

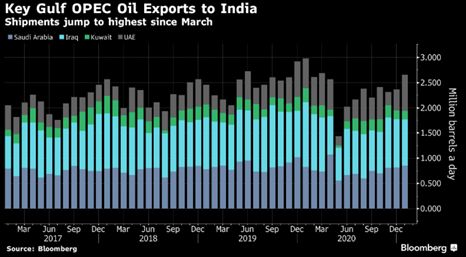


India Economic Update on Demand and Activity
India activity has picked back up, but the one to watch will be diesel sales that still remain off the year/year norm and month/month backdrop. Gasoline has gotten back to a year/ year move-but still have slowed over the past few months. LPG will remain a key growth profile over the next few years, but oil demand in general will take time to get back to pre-COVID levels. Refinery utilizations for assets that produce for products consumed within India are back to seasonal norms, but export directed facilities still remain anywhere from 5%-15% off normal runs due to weak demand in the market.
Diesel sales at India’s three biggest fuel retailers fell 5% to 6.04 million tons in January from a month earlier, according to preliminary data from officials with direct knowledge of the matter.
- Sales of diesel, the country’s most-used fuel, also dropped 2.3% from the same period a year earlier, said company officials who asked not to be identified as they’re not authorized to speak to media
- Gasoline sales -3.3% m/m to 2.36m tons, but were +5.9% y/y
- Jet fuel sales were little changed at 393.5k tons m/m, -43.6% y/y
- Liquefied petroleum gas sales -1.4% m/m at 2.5m tons, +2.3% y/y
The extent of the decline will take time to recover especially with the global economy facing headwinds:

India is going to start rolling back some restrictions in provinces which will support more travel, but consumer sentiment still remains cautionary as local consumption is still under pressure. COVID cases have stabilized at the current levels, but we want to see the trend continue lower over the next few weeks.

India just updated their budget, which surprised to the upside: “Fueled by a bigger-than-expected spending deficits and borrowing, as well as sales of government assets and dividends from state firms, the 35 trillion rupee ($480 billion) budget sent bonds tumbling and stocks rallying. It also aims to bolster the nation’s financial stability, including setting up a company to manage a growing pile of bad loans. The new budget also comes as the nation’s financial sector faces increasing pressure from an expected record level of bad loans this year, escalating border tensions with China and widespread anger from farmers, whose protests against market reforms overwhelmed parts of the capital New Delhi last week.” The government was able to increase stimulus as inflation rates fell back within the central banks range, and they try to support the finance industry through various avenues. Even with the increase in spending, expectations are high for a bounce in economy activity and GDP. The below chart shows the expected bounce in GDP growth that is expected to help offset the rise in fiscal deficits.

The fall of inflation expectations also opens up more stimulus capacity, but there are two key places to watch as India looks to stimulate their economy.

India is looking to create a “bad bank” to house the expected surge of bad debt on their balance sheets. The central bank, government, and banks are working on the best way to sure up balance sheets to protect the finance system from a shock. Within the government’s budget, there is a renewed push to stabilize the system based on a systemic risk that could hamper lending and the general recovery.

The capital infusion still remains very low based on the issues described above, which will be something to watch as the budget is carried out for the fiscal year. There could be a need to inject more cash into the system or support the bad bank where some of these underwater bonds/loans are housed. By taking it off the banks balance sheet, it strengthens the fundamentals of the bank- but the bad debt still exists in the system and the risk is just shifted from the bank to the central bank/ government. The performance of these assets will be important to track.

Another important caveat is the lack of stimulus for the rural regions and farmers. There have been several protests in New Dehli, and around India regarding the lack of support for those in the rural setting. The rural output has helped drive a large part of the recent recovery, but now the new government budget is pulling assets/cash from this vertical and pushing it into other initiatives. This has sparked protests, and without the support of the government we expect to see growth slow and move closer to pre-pandemic levels.

India still has several strong tail winds as lockdowns ease in the market further, COVID cases remain depressed, and exports will continue to drive higher (as China comes under pressure- more on that in a moment). The lockdown index has already fallen to about 65 and will edge below 60 by next week, which will be supportive of gasoline demand but diesel will be the key bellwether to watch. The government stimulus will be enough to help spur some movement, but the rural index, inflation, and the bad bank debt will be the key data points to tell how far their can go.

China Economic Round-up
The Chinese data has started to falter along our expectations, but more downside remains as exports come under pressure and the local consumer struggles. The PMI data disappointed and points to mounting headwinds with manufacturing slowing as new orders contracted.


New orders are a strong leading indicator for activity- especially an exporting nation such as China. We have seen the problems mounting on the coast, but due to logistical issues in the market, delivery delays, inventory shortfalls, and subsidized export prices- China was able to maintain elevated activity. This is why we have been stressing the key difference between a “supply” vs “demand” recovery. We have been adamant that China was subject to a supply recovery and as the supply chain caught up- there would be muted demand behind it. As supply chains adjust and diversify more away from China, the country will experience more problems in propping up GDP expectations.


The job situation within China also took a slight ding with more reported layoffs and workforce reductions.
The Caixin January PMI fell to 51.3, down from 53.0 in December and the lowest level in seven months.
- The official NBS PMI fell to 51.3 from 51.9 in December.
- “The [Caixin] survey…showed that firms signaled notably weaker growth in output and total new work, with the subindex for output hitting the lowest since April, and the one for new orders the lowest since June.”
- Part of the slowdown was from a renewed drop in new export orders, down for the first time in six months.
- Manufacturing employment fell slightly.
- Manufacturers maintained a positive outlook for the next 12 months, but there are concerns over the sustainability of the recovery.
The PBoC has been trying to pull excess liquidity out of the market, which caused a shock to SHIBOR and overnight rates. Credit impulses have been weakening and some bond deals were quickly pulled as the cost of borrowing shifted higher.

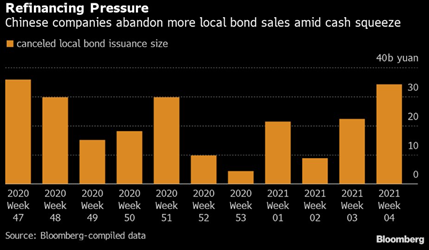

The ability for China to keep the casino going is tough as the budget deficit widens further- but that could pretty much be said about every country in the world. The problem specifically with China is the collateral question and lack of investments generating cash. The world has seen zombie companies explode, but China gives new meaning to the amount of zombie companies in their possession. This is another reason they have let State Owned Enterprises go BK in order to flush the system, but some provinces have way more exposure vs others.

Some Provinces will struggle to refinance debt as more stress resides in the system: “Those stresses aren’t distributed evenly across the country though, with companies in the provinces of Liaoning, Qinghai and Henan facing the most difficulty in raising funds at the moment, according to Bloomberg analysis of all corporate bonds issued in China. The data shows that firms in those three regions issued new bonds equal to less than 30% of the debt that matured over the last three months. Firms in other provinces such as Anhui and Zhejiang were in a much better position, issuing 251% and 171% more bonds than maturing debt, respectively. The ratio was 116% nationwide in January.”
Growth targets
- Most provinces set targets at “more than 6%.”
- Dual circulationProvinces are carving out niches within China’s strategy to more closely integrate global trade with the domestic market.
- Liaoning wants to be a hub for trade with Northeast Asia. Xinjiang and Inner Mongolia unveiled plans for free trade zones.
- Carbon peakPlans for emissions reductions and energy transitions were common across the board.
- Digital currencyWealthier provinces are stepping up digital yuan pilot projects.
- 5GEveryone wants the base station buildout to move faster.
- 14th Five-Year PlanProvinces are developing local plans to help hit the goals of the national one.
- Anti-poverty campaignsPoorer provinces are transitioning successful poverty alleviation campaigns into ongoing rural revitalization efforts.
Get smart: All of these will pop up again at next month’s NPC.
Get smarter: Despite the chatter around growth targets, it’s clear provinces are more interested in “high quality” growth.

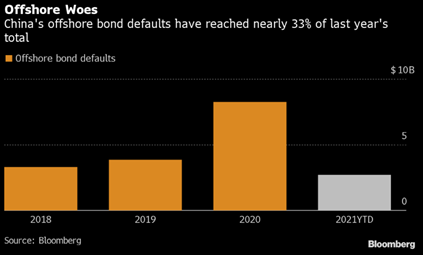
This is also complicated by additional offshore bond defaults mounting: “Unigroup defaulted on $2 billion worth of notes in January, comprising the majority of the $2.7 billion total value. Solar power operator GCL New Energy Holdings Ltd. defaulted on a $500 million note on Jan. 30, while Macrolink Global Development Ltd. missed a payment on a $208 million bond on Jan. 4.” As we said last year, the Chinese defaults were just beginning and 2020 wasn’t the government trying to “clear the deck” but rather the start of something bigger across the system. Risks are mounting as food costs shift higher and pressure mounts on the government to try to generate economic growth as the consumer remains weak and exports slow.
This is just an example of some of the pain being felt at the consumer level:

The pressures above is why we are not shocked to see President Xi doubling down on the communist dream. We have been talking about this at length- especially after the Chinese Communist Congress:
Xi is putting the Communist back in the Communist Party of China:
- “In order to fully implement the New Development Concept, it is necessary to pay more attention to the issue of common prosperity.”
- “We must consciously and actively resolve regional disparities, urban-rural disparities, and income disparities.”
- “[We must] promote social equity and justice, and make sure that the fruits of development are more equitably shared by all people.”
- Get smart: Deng Xiaoping said the Party would “let some get rich first.” Xi Jinping is saying that enough people have gotten rich, and now it’s time to share the wealth more broadly.
Get smarter: This marks a major shift in how the Party approaches the economy. But it is still unclear what it means in practice.
The Party directs propaganda efforts at Young Pioneers
- The Central Committee’s message for young people: Listen to Xi and the Party (Gov.cn):
- “Remember the words and follow the instructions of General Secretary Xi Jinping.”
- “Recognize China’s great achievements and realize that today’s happiness is rooted in the Party’s leadership.”
- The guidelines also made note of the audience’s needs: “[We should] Use simple language to guide children…and plant seeds in the young pioneers’ hearts to fight for the cause of communism.”
The pressure mounting within the country has also driven them to increase rhetoric on China-US relations.
Yang Jiechi also had a warning. He told the US not to cross China’s red lines in Taiwan, Hong Kong, Tibet, and Xinjiang:“Any trespassing would end up undermining China-US relations and the United States’ own interests.”
- Get smart: The downturn in Sino-US relations is structural. It was not caused by the Trump administration, and it will not be reversed now that there is a new administration in DC.
- Some context: Earlier this week, India reaffirmed its June decision to permanently ban 59 Chinese apps from its online ecosystem.
The commentary is getting worse as the U.S. and other nations pull harder from Taiwan for semi-conductors driven by shortages around the world. The cost of technology is rising as the complexity of the fab facilities get more expensive and input (raw material) prices rise. China has increased their flights into Taiwanese territory, which is a great way to track response time, direction of intercept, and what equipment they use to respond. The U.S. has responded by sending an aircraft carrier fleet through the straight and showing support. China is going to need more semiconductor capacity… so they can either build it themselves or go get it… just something to consider.

Myanmar Coup
The issues between India and China are far from over as a huge part of the world population lives along the border. As food, water, and other natural resources become a growing strain- conflict is going to rise over this decade.

Tensions are only heading in one direction with more issues coming especially after what is happening in Myanmar (Burma) and how strategic it is to the Chinese supply chain. China used its veto to block a U.N. Security Council resolution to condemn the Myanmar coup, BBC reported. China’s foreign ministry also issued a statement denying allegations that it supported or gave tacit consent for the coup in meetings with Myanma military officials in Jan. The military and Aung Sang Suu Kyi have been enemies but mutual hatred of the Rohingya ethnic group led them to cooperate, but after Kyi’s landslide victory- she pushed “too far” in the military’s eyes causing for them to dissolve their agreement. Many Muslim Rohingya have escaped to Bangladesh causing the refugee camps to be overwhelmed. The military is also concerned about the Kachin Independence Army activities, and in order to create an opportunity to converge on the issue they orchestrated the coup in order to create Marshall law. China supports the activity due to the Myanmar-China Econ Corridor providing an outlet to the Bay of Bengal and around the choke point- Strait of Malacca. China also relies on Myanmar for a large part of their tin demand, which is a key factor in the technology industry. Demand for tin has surged to highs taking demand to multi-decade highs.

The below is a map of the China-Myanmar economic corridor that provides China an avenue into the Bay of Bengal and avoids a key choke point at the Strait of Malacca. China also needs their raw materials, which has kept them supportive of the military.

The demand for tin has only shifted higher over the last year, and as green technology demand rises we are seeing a big shift in demand- which is driving prices even higher on top of supply constraints. The recent military coup in Myanmar may have added some near-term concern about exports to China, although the country’s tin mines are in the autonomous Shan state and aren’t expected to be affected by the political situation. A more pressing concern is flooding in parts of the region. Myanmar is the world’s third largest producer of tin concentrates and China is the world’s largest consumer of refined tin. With current demand concentrated in electronics, new applications for tin, tin compounds and copper-tin alloys for batteries may be discounted. The newer technologies are seen as offering increased stability and better performance in lithium-ion battery anodes compared with current graphite–based anodes. All of which underscores the projected deficit of about 2,700 tons in 2021, following a 5,200 deficit in 2020, according to the International Tin Association.


