Primary Vision
  • HOME
  • ABOUT US
    • ABOUT US
    • PRIMARY VISION AI INNOVATIONS
  • RESEARCH
    • INSIGHTS & ARTICLES
    • FREE ARTICLES
  • EVENTS
  • PRESS
  • SUPPORT
  • FAQ
  • LATEST NEWS
  • LOGIN
  • SIGN UP!
    • FRAC SPREAD COUNT SIGN-UP!
    • ENTERPRISE SUBSCRIPTION PLAN SIGN UP!
  • HOME
  • ABOUT US
    • ABOUT US
    • PRIMARY VISION AI INNOVATIONS
  • RESEARCH
    • INSIGHTS & ARTICLES
    • FREE ARTICLES
  • EVENTS
  • PRESS
  • SUPPORT
  • FAQ
  • LATEST NEWS
  • LOGIN
  • SIGN UP!
    • FRAC SPREAD COUNT SIGN-UP!
    • ENTERPRISE SUBSCRIPTION PLAN SIGN UP!
No Result
View All Result
Primary Vision
Home Market Trends

NexTier Oilfield Solutions Part 2: Estimates And Relative Valuation

Avik Chowdhury by Avik Chowdhury
May 24, 2022
in Market Trends
0
NexTier Oilfield Solutions Part 2: Estimates And Relative Valuation

  • The revenue estimate is much higher in the next year and stable afterward
  • EBITDA can increase sharply in NTM 2023 but will decelerate in the following year
  • The stock is undervalued versus its peers at the current level

In Part 1 of this article, we discussed NexTier Oilfield Solutions’ (NEX) outlook, performance, and financial condition. In this part, we will discuss more.

Linear Regression Based Forecast

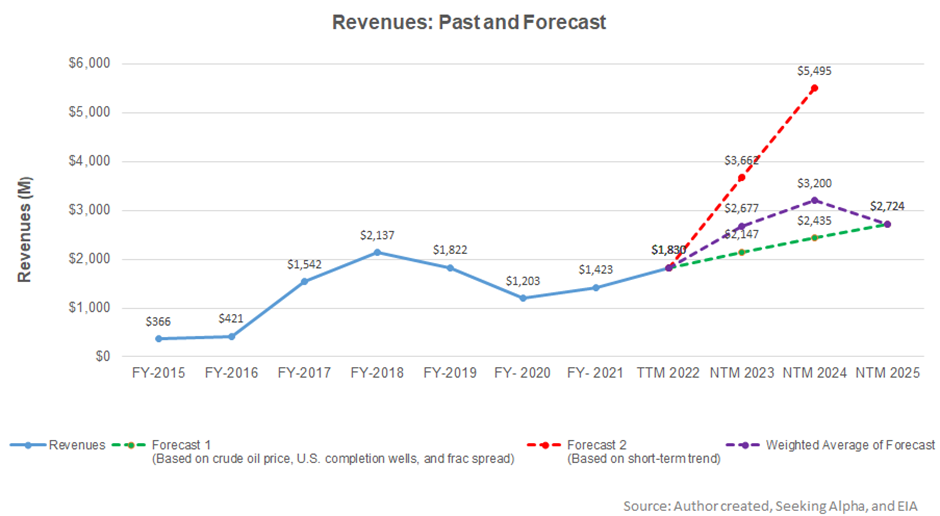
Based on a regression equation between the key industry indicators and NEX’s reported revenues, I expect revenues to increase sharply, particularly in the next 12-months (or NTM 2023). The topline growth can moderate in the NTM 2024.

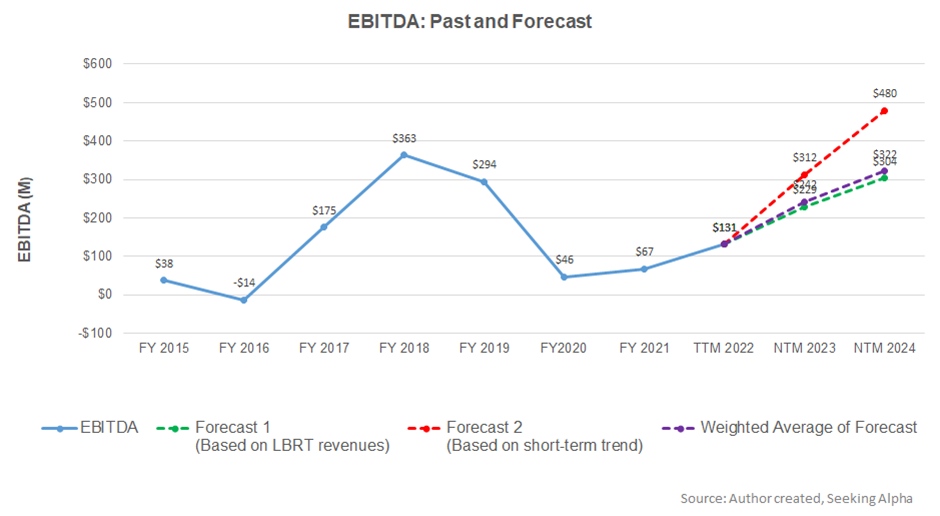
Based on the regression model using the average forecast revenues, I expect the company’s EBITDA to increase steeply in NTM 2023. It will continue to grow at a more normalized rate in NTM 2024.

Target Price And Relative Valuation

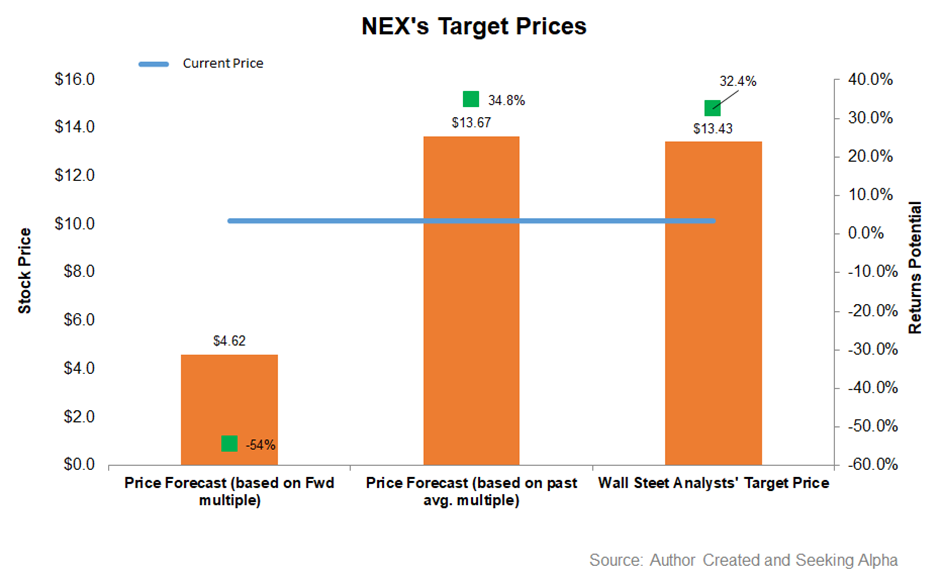
EV has been calculated using the forward and past five-year average multiple. Returns potential (54% downside) using the forward EV/EBITDA multiple (5.9x) is significantly lower than Wall Street’s sell-side analyst expectations (32% upside) and the past EV/EBITDA average (35% upside) from the stock.

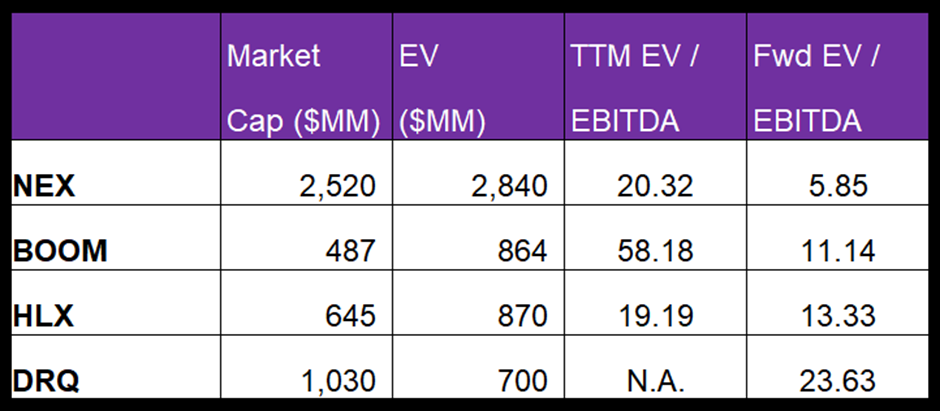
NEX’s forward EV-to-EBITDA multiple contraction versus the adjusted trailing 12-month EV/EBITDA is steeper than its peers, which typically reflects a higher EV/EBITDA multiple than the peers. The stock’s EV/EBITDA multiple (20.3x) is much lower than its peers’ (BOOM, HLX, and DRQ) average of 38.7x. So, relative valuation-wise, the stock is undervalued at the current level.

What’s The Take On NEX?

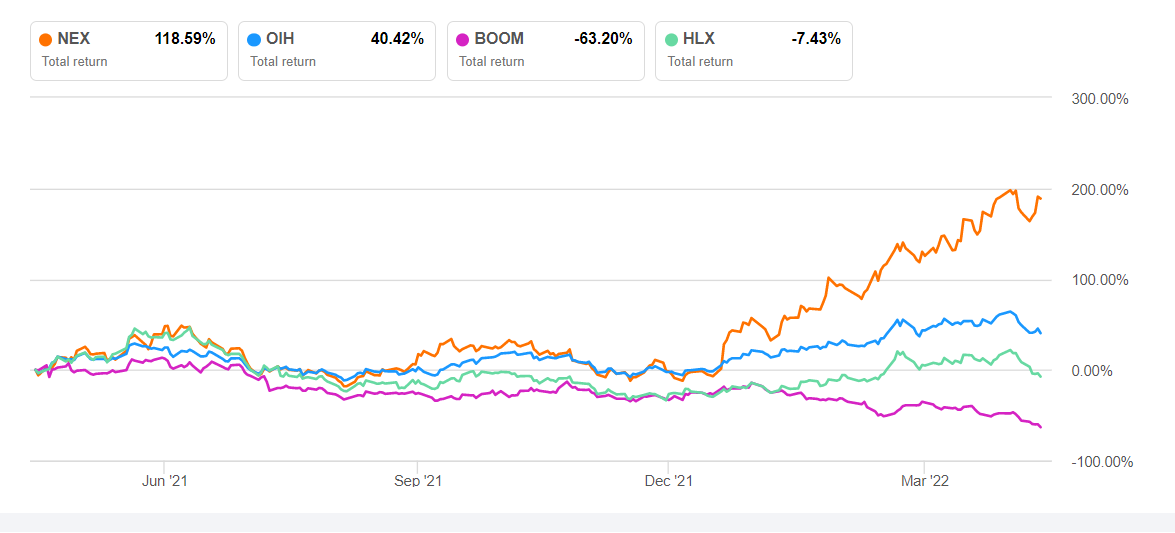
In 2022, the pricing recovery for well-completion services and the frac fleet utilization are accelerating, given the demand-supply balance. Newbuilds with Tier IV capability and electric frac spreads will also replace or enhance the legacy diesel-powered engines, resulting in $10 million in lower fuel costs per year on each fleet. The natural gas-powered fleets also command a pricing premium over conventional diesel-powered frac equipment in an undersupplied market. The fuel cost of NEX’s Tier 4 dual fuel fleets has increased much less than the conventional diesel fleet. So, fielding more of such models can see operating margin expansion in the coming quarters. So the stock outperformed the VanEck Vectors Oil Services ETF (OIH) in the past year.

Although the pricing level remains below the pre-pandemic level, we expect the recovery to accelerate in 2022, notwithstanding the commodity price inflationary costs and their adverse impact in the short term. The cash flow improvement is also a positive given the company’s leveraged balance sheet. The stock is undervalued relative to its peers at this level, encouraging investors to buy it for an upside in the medium term.

Previous Post

NexTier Oilfield Part 1: Pricing Improvement And Margin Expansion Are On The Cards

Next Post

Year-Over-Year Oil Data (USA)

Related Posts

Halliburton’s Perspective in Q1: KEY Takeaways
Market Trends

Halliburton’s Perspective in Q1: KEY Takeaways

May 16, 2025
STEP Energy Services: Q1 TAKE THREE
Market Trends

STEP Energy Services: Q1 TAKE THREE

May 15, 2025
Market Sentiment Tracker: Demand Holds, Cracks Widen
Market Trends

Market Sentiment Tracker: Demand Holds, Cracks Widen

May 14, 2025
Monday Macro View: What is the connection between Frac Job Count and OPEC’s production? Enterprise Subscribers
Market Trends

Monday Macro View: What is the connection between Frac Job Count and OPEC’s production? Enterprise Subscribers

May 12, 2025
Liberty Energy’s Perspective in Q1: KEY Takeaways
Market Trends

Liberty Energy’s Perspective in Q1: KEY Takeaways

May 12, 2025
KLX Energy Services: Q1 TAKE THREE
Market Trends

KLX Energy Services: Q1 TAKE THREE

May 9, 2025
Next Post
Year-Over-Year Oil Data (USA)

Year-Over-Year Oil Data (USA)

Please login to join discussion

Recent News

Halliburton’s Perspective in Q1: KEY Takeaways

Halliburton’s Perspective in Q1: KEY Takeaways

May 16, 2025
STEP Energy Services: Q1 TAKE THREE

STEP Energy Services: Q1 TAKE THREE

May 15, 2025
FREE READ: Oil Markets Trying to find direction

FREE READ: Oil Markets Trying to find direction

May 14, 2025
Market Sentiment Tracker: Demand Holds, Cracks Widen

Market Sentiment Tracker: Demand Holds, Cracks Widen

May 14, 2025
Monday Macro View: What is the connection between Frac Job Count and OPEC’s production? Enterprise Subscribers

Monday Macro View: What is the connection between Frac Job Count and OPEC’s production? Enterprise Subscribers

May 12, 2025
Primary Vision

Established in 2011, we are renowned for our expert frac data and analytics, providing a rich array of unique indicators and industry commentary.

CONTACT

+1-713-554-4977
info@primaryvision.co

SOCIAL NETWORKS

POLICIES

Privacy Policy
Terms of Use

PARTNERS

Amazon Web Services

TRUSTED SITES

Logo

Logo

RECENT NEWS

Halliburton’s Perspective in Q1: KEY Takeaways

Halliburton’s Perspective in Q1: KEY Takeaways

May 16, 2025
STEP Energy Services: Q1 TAKE THREE

STEP Energy Services: Q1 TAKE THREE

May 15, 2025
FREE READ: Oil Markets Trying to find direction

FREE READ: Oil Markets Trying to find direction

May 14, 2025
Market Sentiment Tracker: Demand Holds, Cracks Widen

Market Sentiment Tracker: Demand Holds, Cracks Widen

May 14, 2025
Monday Macro View: What is the connection between Frac Job Count and OPEC’s production? Enterprise Subscribers

Monday Macro View: What is the connection between Frac Job Count and OPEC’s production? Enterprise Subscribers

May 12, 2025
  • HOME
  • ABOUT US
  • RESEARCH
  • EVENTS
  • PRESS
  • SUPPORT
  • FAQ
  • LATEST NEWS
  • LOGIN
  • SIGN UP!

© 2025 Primary Vision. All rights reserved.

  • HOME
  • ABOUT US
    • ABOUT US
    • PRIMARY VISION AI INNOVATIONS
  • RESEARCH
    • INSIGHTS & ARTICLES
    • FREE ARTICLES
  • EVENTS
  • PRESS
  • SUPPORT
  • FAQ
  • LATEST NEWS
  • LOGIN
  • SIGN UP!
    • FRAC SPREAD COUNT SIGN-UP!
    • ENTERPRISE SUBSCRIPTION PLAN SIGN UP!

© 2025 Primary Vision. All rights reserved.