Primary Vision
  • HOME
  • ABOUT US
    • ABOUT US
    • PRIMARY VISION AI INNOVATIONS
  • RESEARCH
    • INSIGHTS & ARTICLES
    • FREE ARTICLES
  • EVENTS
  • PRESS
  • SUPPORT
  • FAQ
  • LATEST NEWS
  • LOGIN
  • SIGN UP!
    • FRAC SPREAD COUNT SIGN-UP!
    • ENTERPRISE SUBSCRIPTION PLAN SIGN UP!
  • HOME
  • ABOUT US
    • ABOUT US
    • PRIMARY VISION AI INNOVATIONS
  • RESEARCH
    • INSIGHTS & ARTICLES
    • FREE ARTICLES
  • EVENTS
  • PRESS
  • SUPPORT
  • FAQ
  • LATEST NEWS
  • LOGIN
  • SIGN UP!
    • FRAC SPREAD COUNT SIGN-UP!
    • ENTERPRISE SUBSCRIPTION PLAN SIGN UP!
No Result
View All Result
Primary Vision
Home Market Trends

Solaris Oilfield Infrastructure Part 2: Estimates And Relative Valuation

Avik Chowdhury by Avik Chowdhury
July 5, 2022
in Market Trends
0
Solaris Oilfield Infrastructure Part 2: Estimates And Relative Valuation

  • Regression estimates suggest strong revenue growth in NTM 2023, but the rate can decelerate over the next couple of years
  • The EBITDA growth rate is robust in NTM 2023 but may fall in NTM 2024
  • The relative valuation suggests the stock is reasonably valued; the model also suggests a mild downside bias at this level

Part 1 of this article discussed Solaris Oilfield Infrastructure’s (SOI) outlook, performance, and financial condition. In this part, we will discuss more.

Linear Regression Based Forecast

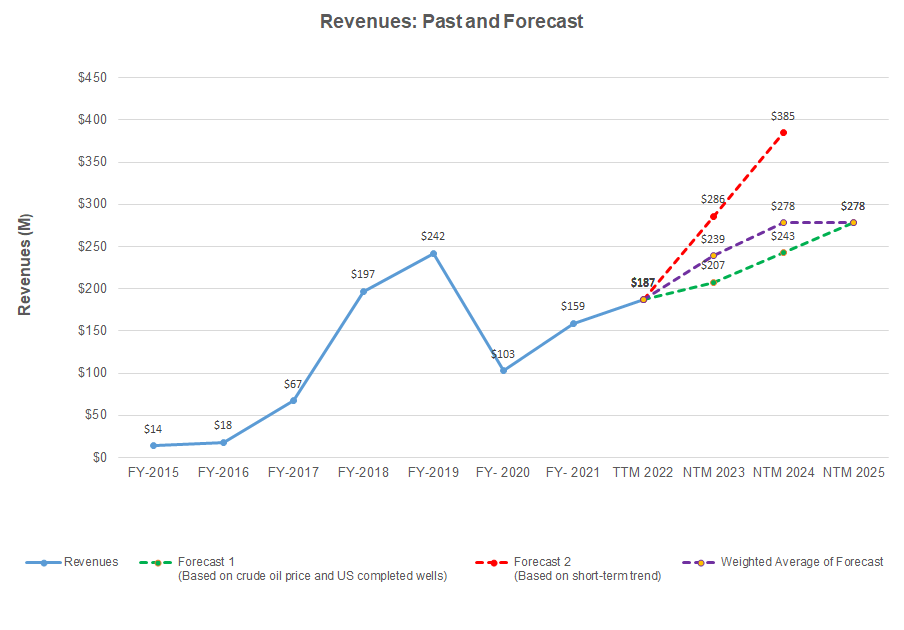
Based on a regression equation between crude oil price, US completed well count, and SOI’s reported revenues for the past seven years and the previous four-quarters, I expect revenues to increase sharply in the next twelve months (or NTM) 2023. The recovery will decelerate in NTM 2024 and flatter in NTM 2025.

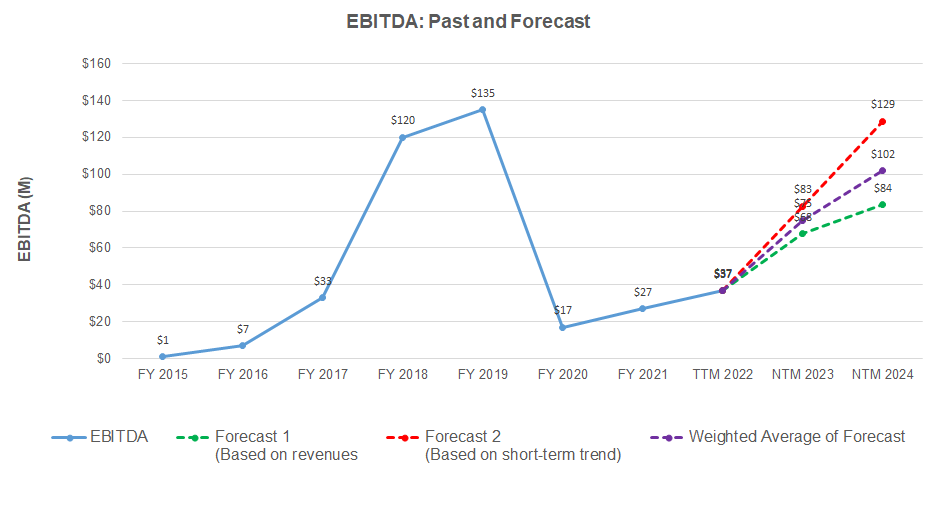
Based on a simple regression model using the average forecast revenues, I expect the company’s EBITDA to double in NTM 2023. The model suggests it can continue to rise at a decelerated rate in NTM 2024.

Target Price And Relative Valuation

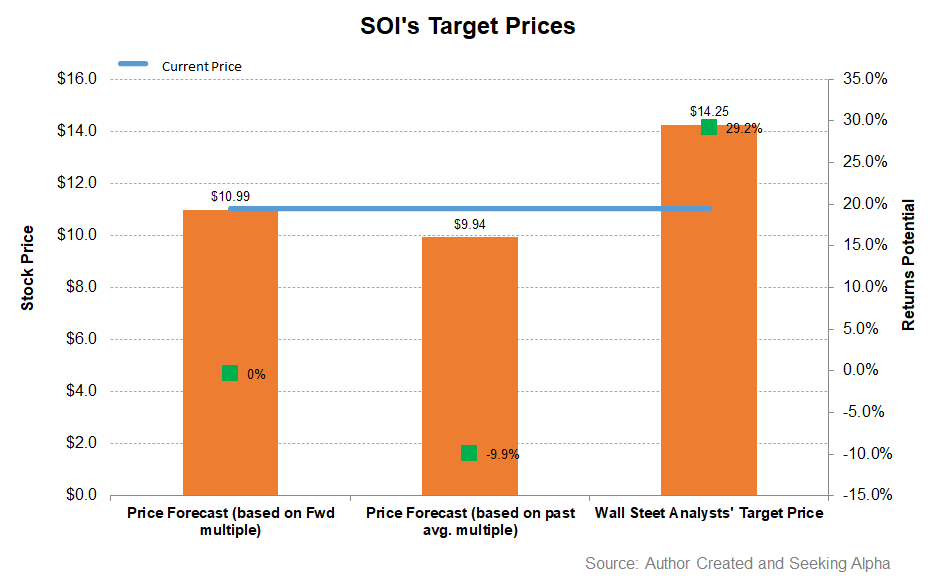
Returns potential using the past average multiple (11.4x) is lower (10% downside) than the forward multiple (0% upside). The sell-side analysts expect higher returns (29% upside).

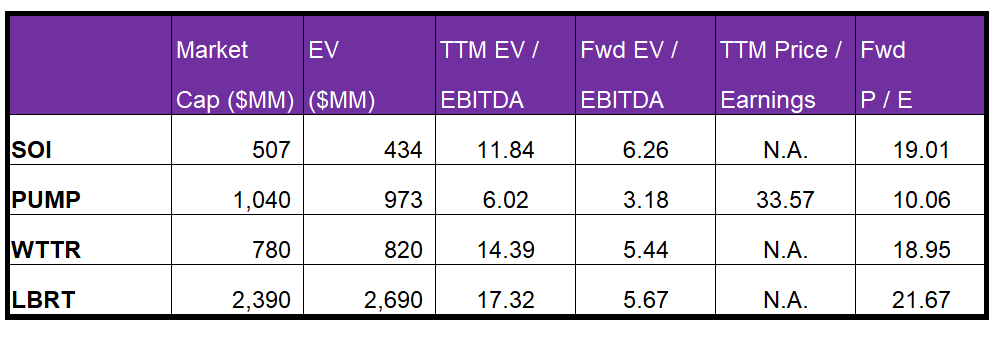
SOI’s forward EV-to-EBITDA multiple contraction versus the adjusted trailing 12-month EV/EBITDA is less steep than its peers, typically resulting in a lower EV/EBITDA multiple compared to peers. The company’s EV/EBITDA multiple (11.8x) is lower than its peers’ (PUMP, WTTR, and LBRT) average of 12.6x. So, the stock is reasonably valued at the current level.

What’s The Take On SOI?

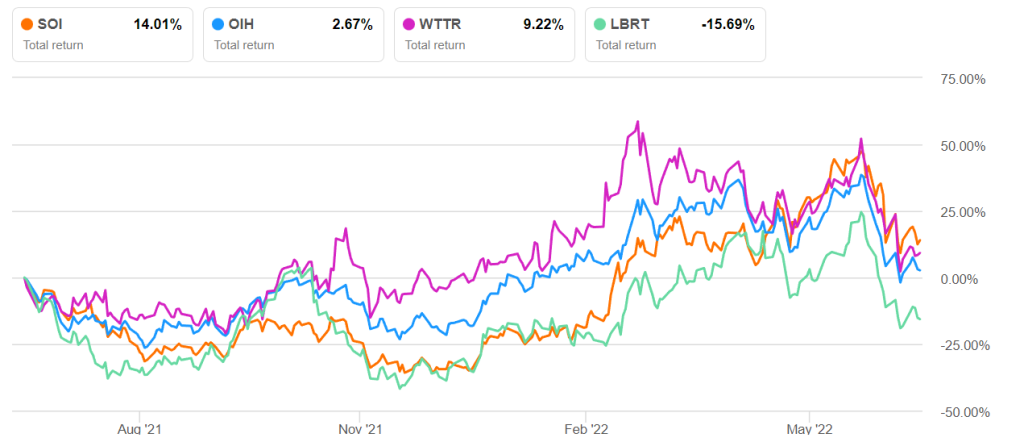
While Solaris changed its stance by late 2021, concentrating on profit maximization, the positive effects are on display in 2022, reflecting increased volume and profit per frac crew under its last-mile model. Demand for its top fill solution and 9- and 12-pack configurations exceed supply, leading to profit maximization. On top of higher volume and cost absorption, the margin benefits from the price hikes initiated in 2H 2021. These advantages tipped the stock price to outperform the VanEck Vectors Oil Services ETF (OIH) in the past year.

With additional investment in top fill and AutoBlend technology, SOI’s capex is likely to outmatch cash flows. This can be worrying, especially when its free cash flows turned negative in Q1. Nonetheless, a zero-debt balance sheet and robust liquidity will act as a buffer against a cash crunch. In the medium-to-long term, investors would like to buy in expectation of steady returns.

Previous Post

Solaris Oilfield Infrastructure Part 1: Value Added Services To Boost Margin

Next Post

Year-Over-Year Oil Data (USA)

Related Posts

Monday Macro View: Top 5 Reasons Crude Prices Are Ascending – and the recent Middle East tension is only one of them!
Market Trends

Monday Macro View: Top 5 Reasons Crude Prices Are Ascending – and the recent Middle East tension is only one of them!

June 16, 2025
Nabors Industries’ Perspective in Q1: KEY Takeaways
Market Trends

Nabors Industries’ Perspective in Q1: KEY Takeaways

June 16, 2025
ProPetro’s Perspective in Q1: KEY Takeaways
Market Trends

ProPetro’s Perspective in Q1: KEY Takeaways

June 13, 2025
Market Sentiment Tracker: What If This Is as Good as It Gets?
Market Trends

Market Sentiment Tracker: What If This Is as Good as It Gets?

June 11, 2025
Monday Macro View: As OPEC+ Raises Output, Is U.S. Shale Prepared to Follow—or Fade?
Market Trends

Monday Macro View: As OPEC+ Raises Output, Is U.S. Shale Prepared to Follow—or Fade?

June 9, 2025
NOV’s Perspective in Q1: KEY Takeaways
Market Trends

NOV’s Perspective in Q1: KEY Takeaways

June 9, 2025
Next Post
Year-Over-Year Oil Data (USA)

Year-Over-Year Oil Data (USA)

Please login to join discussion

Recent News

Monday Macro View: Top 5 Reasons Crude Prices Are Ascending – and the recent Middle East tension is only one of them!

Monday Macro View: Top 5 Reasons Crude Prices Are Ascending – and the recent Middle East tension is only one of them!

June 16, 2025
Nabors Industries’ Perspective in Q1: KEY Takeaways

Nabors Industries’ Perspective in Q1: KEY Takeaways

June 16, 2025
ProPetro’s Perspective in Q1: KEY Takeaways

ProPetro’s Perspective in Q1: KEY Takeaways

June 13, 2025
Market Sentiment Tracker: What If This Is as Good as It Gets?

Market Sentiment Tracker: What If This Is as Good as It Gets?

June 11, 2025
Monday Macro View: As OPEC+ Raises Output, Is U.S. Shale Prepared to Follow—or Fade?

Monday Macro View: As OPEC+ Raises Output, Is U.S. Shale Prepared to Follow—or Fade?

June 9, 2025
Primary Vision

Established in 2011, we are renowned for our expert frac data and analytics, providing a rich array of unique indicators and industry commentary.

CONTACT

+1-713-554-4977
info@primaryvision.co

SOCIAL NETWORKS

POLICIES

Privacy Policy
Terms of Use

PARTNERS

Amazon Web Services

TRUSTED SITES

Logo

Logo

RECENT NEWS

Monday Macro View: Top 5 Reasons Crude Prices Are Ascending – and the recent Middle East tension is only one of them!

Monday Macro View: Top 5 Reasons Crude Prices Are Ascending – and the recent Middle East tension is only one of them!

June 16, 2025
Nabors Industries’ Perspective in Q1: KEY Takeaways

Nabors Industries’ Perspective in Q1: KEY Takeaways

June 16, 2025
ProPetro’s Perspective in Q1: KEY Takeaways

ProPetro’s Perspective in Q1: KEY Takeaways

June 13, 2025
Market Sentiment Tracker: What If This Is as Good as It Gets?

Market Sentiment Tracker: What If This Is as Good as It Gets?

June 11, 2025
Monday Macro View: As OPEC+ Raises Output, Is U.S. Shale Prepared to Follow—or Fade?

Monday Macro View: As OPEC+ Raises Output, Is U.S. Shale Prepared to Follow—or Fade?

June 9, 2025
  • HOME
  • ABOUT US
  • RESEARCH
  • EVENTS
  • PRESS
  • SUPPORT
  • FAQ
  • LATEST NEWS
  • LOGIN
  • SIGN UP!

© 2025 Primary Vision. All rights reserved.

  • HOME
  • ABOUT US
    • ABOUT US
    • PRIMARY VISION AI INNOVATIONS
  • RESEARCH
    • INSIGHTS & ARTICLES
    • FREE ARTICLES
  • EVENTS
  • PRESS
  • SUPPORT
  • FAQ
  • LATEST NEWS
  • LOGIN
  • SIGN UP!
    • FRAC SPREAD COUNT SIGN-UP!
    • ENTERPRISE SUBSCRIPTION PLAN SIGN UP!

© 2025 Primary Vision. All rights reserved.