Primary Vision
  • HOME
  • ABOUT US
    • ABOUT US
    • PRIMARY VISION AI INNOVATIONS
  • EFRACS
  • RESEARCH
    • INSIGHTS & ARTICLES
    • FREE ARTICLES
  • EVENTS
  • PRESS
  • SUPPORT
  • FAQ
  • LATEST NEWS
  • LOGIN
  • SIGN UP!
    • FRAC SPREAD COUNT SIGN-UP!
    • ENTERPRISE SUBSCRIPTION PLAN SIGN UP!
  • HOME
  • ABOUT US
    • ABOUT US
    • PRIMARY VISION AI INNOVATIONS
  • EFRACS
  • RESEARCH
    • INSIGHTS & ARTICLES
    • FREE ARTICLES
  • EVENTS
  • PRESS
  • SUPPORT
  • FAQ
  • LATEST NEWS
  • LOGIN
  • SIGN UP!
    • FRAC SPREAD COUNT SIGN-UP!
    • ENTERPRISE SUBSCRIPTION PLAN SIGN UP!
No Result
View All Result
Primary Vision
Home Market Trends

Liberty Energy Part 2: Estimates And Relative Valuation

Avik Chowdhury by Avik Chowdhury
August 7, 2022
in Market Trends
0
Liberty Energy Part 2: Estimates And Relative Valuation

  • The regression model suggests that Liberty’s revenues will rise rapidly in the next year but can decelerate afterward.
  • EBITDA can increase sharply in NTM 2023 but will fall sharply after that
  • The stock is relatively undervalued at the current level

In Part 1 of this article, we discussed Liberty Energy’s (LBRT) outlook, performance, and financial condition. In this part, we will discuss more.

Linear Regression Based Revenue Forecast

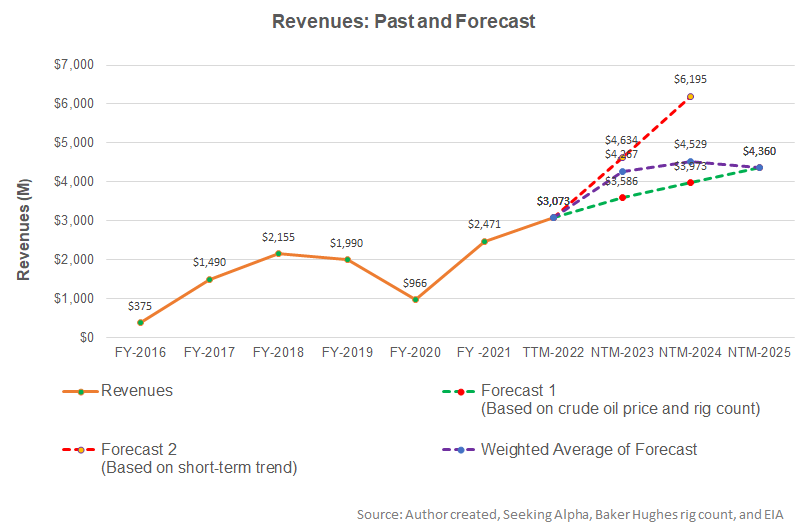
Based on a regression equation among the crude oil price and rig count, LBRT’s past seven-year revenues, its topline can increase sharply in the next 12 months (NTM 2023). The growth rate will decelerate in the following year and can decline in NTM 2025.

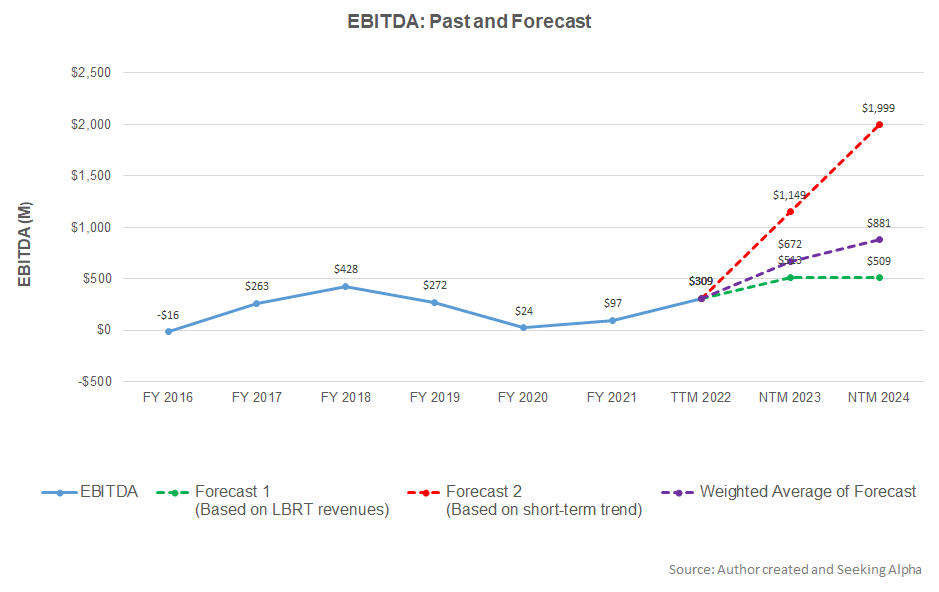
A regression model based on the forecast revenues suggests that the company’s EBITDA can increase sharply in NTM 2023. In NTM 2024, the model indicates that the EBITDA growth rate will fall.

Relative Valuation And Target Price

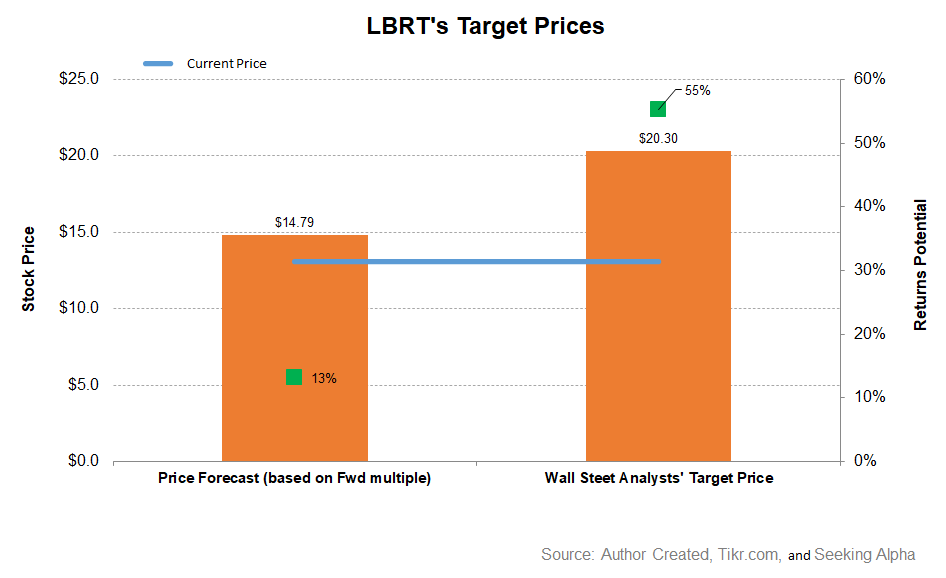
Here is an analysis of LBRT’s relative valuation using its forward EV/Revenue multiple. The returns potential (13% upside) using the forward EV/Revenue multiple (0.71x) is lower than sell-side analysts’ expected returns (55% upside) from the stock.

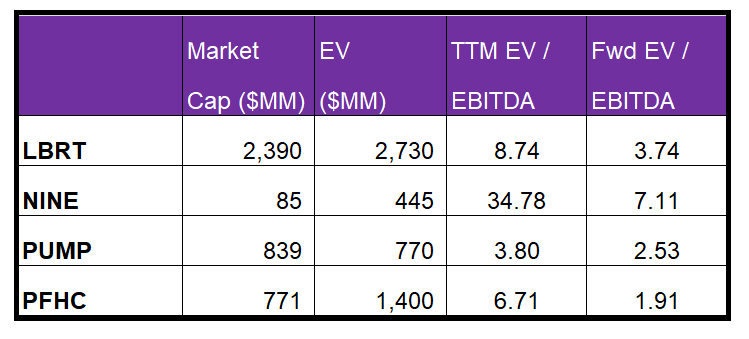
LBRT’s forward EV-to-EBITDA multiple contraction versus the current EV/EBITDA is in line with peers because its EBITDA would rise nearly as much as its peers in the next four quarters. Its EV/EBITDA is lower than its peers’ (NINE, PUMP, and PFHC) average (15.1). So, I think the stock is undervalued versus its peers (with an EV/EBITDA of 8.7x) at this price level.

What’s The Take On LBRT?

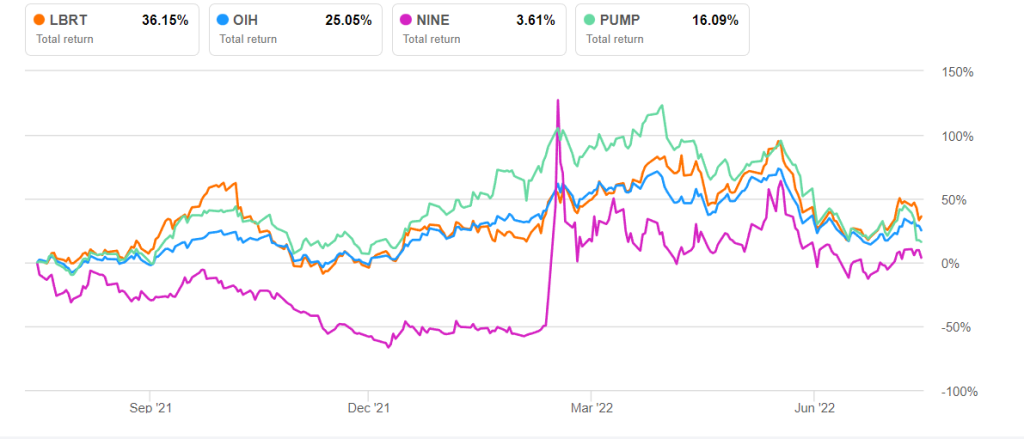
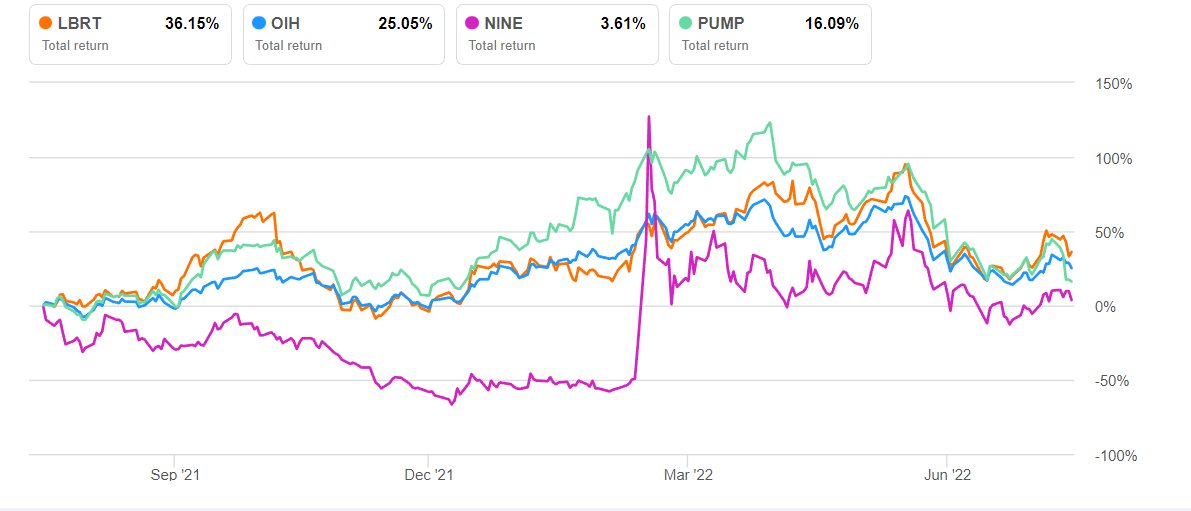
In a market where frac fleets and pressure pump supply remain tight, LBRT, with its suite of ESG-friendly frac fleets, will benefit from high demand due to its stringent emissions standards and fuel savings measures. Liberty can see frac prices improving as the share of ESG-friendly frac fleets rises as it invests heavily into digiFrac fleets and PropX sand handling. As pricing improves, its management indulges in a $250 million share buyback program in Q2, reflecting its confidence in its strength of balance sheet. So, LBRT’s stock price outperformed the VanEck Vectors Oil Services ETF (OIH) in the past year.

Free cash flow turned negative in Q1, raising investors’ concerns. There are few concerns over the demand side as the economy sets inti-inflationary measures which might mitigate energy demand partially. Also, heavy investment in new-age fleets can keep free cash flow low in 2022. Nonetheless, its low leverage (debt-to-equity) will protect it from any possible pressure on cash flows. The stock appears undervalued at the current level relative to its peers. Investors would do well to stay invested in this stock in the medium-to-long term.

Previous Post

Liberty Energy Part 1: Electric Frac Fleet Addition Will Keep Revenue And Margin Growing

Next Post

Energy Markets: Oil, Gas and LNG

Related Posts

Market Sentiment Tracker: Crude Builds, Payroll Misses by 30K, Germany Factory Orders Crash
Market Trends

Market Sentiment Tracker: Crude Builds, Payroll Misses by 30K, Germany Factory Orders Crash

July 9, 2025
Monday Macro View: How does Frac Job Count explain the divergence between global and U.S. inventories?
Market Trends

Monday Macro View: How does Frac Job Count explain the divergence between global and U.S. inventories?

July 7, 2025
Market Sentiment Tracker: Mixed Signals from Global Economy
Market Trends

Market Sentiment Tracker: Mixed Signals from Global Economy

July 1, 2025
Monday Macro View: Is the Global Oil Sector Deteriorating?
Market Trends

Monday Macro View: Is the Global Oil Sector Deteriorating?

June 30, 2025
STEP Energy Services’ Perspective in Q1: KEY Takeaways
Market Trends

STEP Energy Services’ Perspective in Q1: KEY Takeaways

June 30, 2025
KLX Energy Services’ Perspective in Q1: KEY Takeaways
Market Trends

KLX Energy Services’ Perspective in Q1: KEY Takeaways

June 28, 2025
Next Post
Energy Markets: Oil, Gas and LNG

Energy Markets: Oil, Gas and LNG

Please login to join discussion

Recent News

Free Read: Decoding the Latest Job Report

Free Read: Decoding the Latest Job Report

July 10, 2025
Market Sentiment Tracker: Crude Builds, Payroll Misses by 30K, Germany Factory Orders Crash

Market Sentiment Tracker: Crude Builds, Payroll Misses by 30K, Germany Factory Orders Crash

July 9, 2025
Monday Macro View: How does Frac Job Count explain the divergence between global and U.S. inventories?

Monday Macro View: How does Frac Job Count explain the divergence between global and U.S. inventories?

July 7, 2025
Market Sentiment Tracker: Mixed Signals from Global Economy

Market Sentiment Tracker: Mixed Signals from Global Economy

July 1, 2025
Monday Macro View: Is the Global Oil Sector Deteriorating?

Monday Macro View: Is the Global Oil Sector Deteriorating?

June 30, 2025
Primary Vision

Established in 2011, we are renowned for our expert frac data and analytics, providing a rich array of unique indicators and industry commentary.

CONTACT

+1-713-554-4977
info@primaryvision.co

SOCIAL NETWORKS

POLICIES

Privacy Policy
Terms of Use

PARTNERS

Amazon Web Services

TRUSTED SITES

Logo

Logo

RECENT NEWS

Free Read: Decoding the Latest Job Report

Free Read: Decoding the Latest Job Report

July 10, 2025
Market Sentiment Tracker: Crude Builds, Payroll Misses by 30K, Germany Factory Orders Crash

Market Sentiment Tracker: Crude Builds, Payroll Misses by 30K, Germany Factory Orders Crash

July 9, 2025
Monday Macro View: How does Frac Job Count explain the divergence between global and U.S. inventories?

Monday Macro View: How does Frac Job Count explain the divergence between global and U.S. inventories?

July 7, 2025
Market Sentiment Tracker: Mixed Signals from Global Economy

Market Sentiment Tracker: Mixed Signals from Global Economy

July 1, 2025
Monday Macro View: Is the Global Oil Sector Deteriorating?

Monday Macro View: Is the Global Oil Sector Deteriorating?

June 30, 2025
  • HOME
  • ABOUT US
  • EFRACS
  • RESEARCH
  • EVENTS
  • PRESS
  • SUPPORT
  • FAQ
  • LATEST NEWS
  • LOGIN
  • SIGN UP!

© 2025 Primary Vision. All rights reserved.

  • HOME
  • ABOUT US
    • ABOUT US
    • PRIMARY VISION AI INNOVATIONS
  • EFRACS
  • RESEARCH
    • INSIGHTS & ARTICLES
    • FREE ARTICLES
  • EVENTS
  • PRESS
  • SUPPORT
  • FAQ
  • LATEST NEWS
  • LOGIN
  • SIGN UP!
    • FRAC SPREAD COUNT SIGN-UP!
    • ENTERPRISE SUBSCRIPTION PLAN SIGN UP!

© 2025 Primary Vision. All rights reserved.