- Calfrac’s pressure pumping fleet count in the US may remain unchanged, but it may consider reactivating another fleet in Canada in 2022
- Strong utilization following a demand recovery and pricing hike can follow in the rest of 2022 and 2023
- A multi-year contract with increased pricing may begin in Argentina’s Vaca Muerta shale play.
- The company’s leverage is relatively high; free cash flow concerns can add to the risk factors.
Industry And Company Outlook

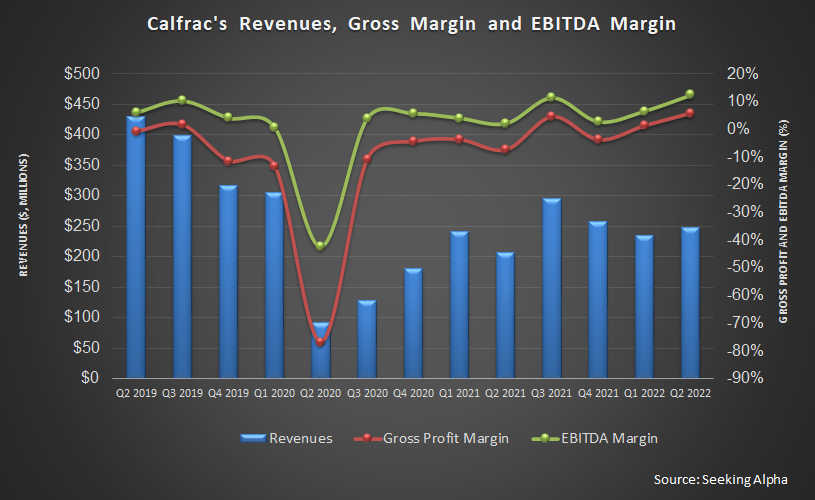
Calfrac’s outlook in the US is built on the positive momentum it experienced in 1H 2022. As we discussed in our previous article, it has been riding on the activity recovery in North America since the start of the year. While the pressure pumping industry remains undersupplied, mining activity has increased, leading to a pricing recovery for the services. So, higher demand can lead to a significant margin expansion. Although the company does not expect to add to its pressure pumping fleet in the US in 2022 and maintain it at nine, it may re-evaluate the environment for further investment later.

In Canada, too, Calfrac should continue to do well, although the seasonal breakup can mitigate some of the upsides. While utilization and pricing are expected to improve, cost inflation can pull down the margin. Because demand should stay robust in 2H 2022, the company may reactivate an additional frac fleet (on top of its current four large fleets). However, the timing of deploying the additional fleet is unconfirmed at this point.
In Argentina, the demand outlook is unshakingly positive, although it will face challenges from currency devaluation, inflationary pressure, and restrictions on capital movement. In Q3, a multi-year contract with increased pricing will see the light of the day in the Vaca Muerta shale play. Calfrac can also benefit from the growth prospects in the Neuquen region of Southern Argentina. As a result, it will likely maintain high utilization for its fleet in 2H 2022 in the area.
Rigs And Frac Spread Count

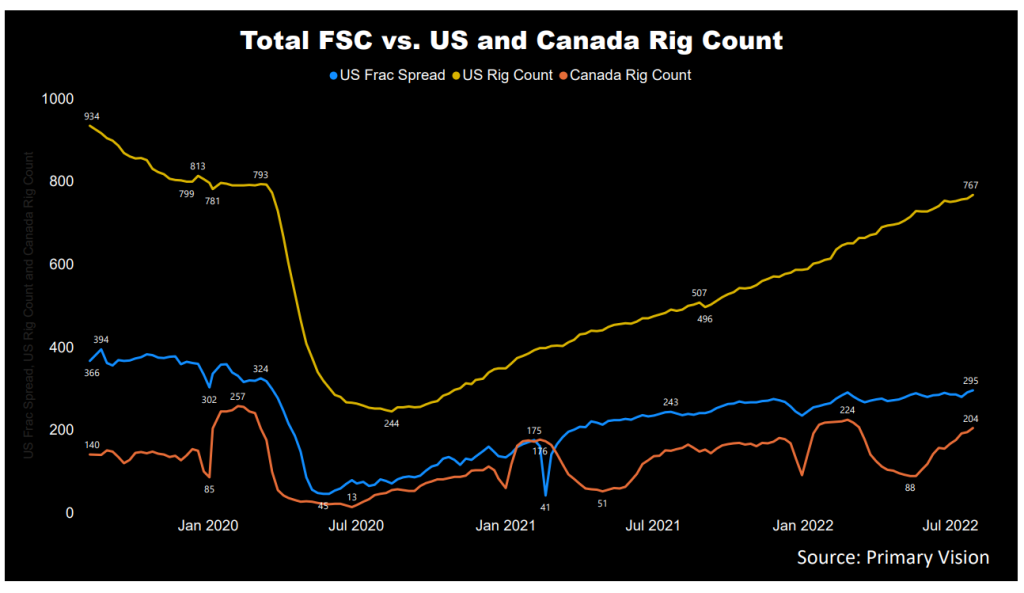
The US active frac spread count year-to-date went up by 20%, according to Primary Vision’s estimates. From December 2021 to July 2022, the drilled and completed well count was higher (34% and 8% up, respectively), while the drilled but uncompleted (or DUC) wells declined by 12%. Many shales saw higher frac spread count addition during this period.
As of now, the US rig count has remained nearly unchanged in Q3. The rig count in Canada has zoomed, rising by 32% in Q3 alone. OPEC’s incapacity to grow production rapidly and quickly following the ban on Russian oil can tighten the energy supply, leading to high crude oil prices sustained.
Canada: Performance And Outlook

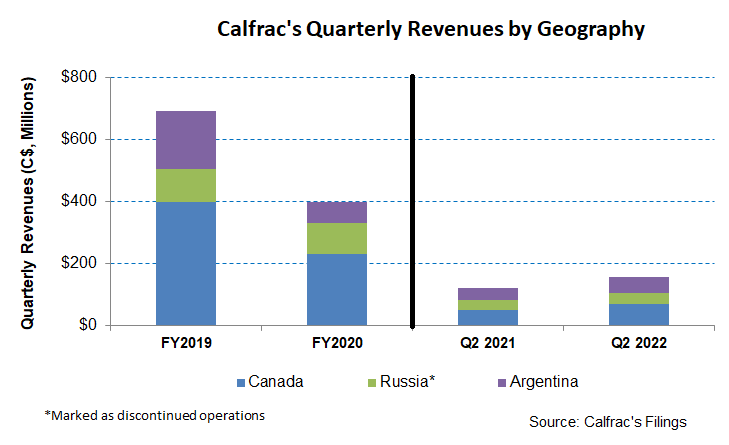
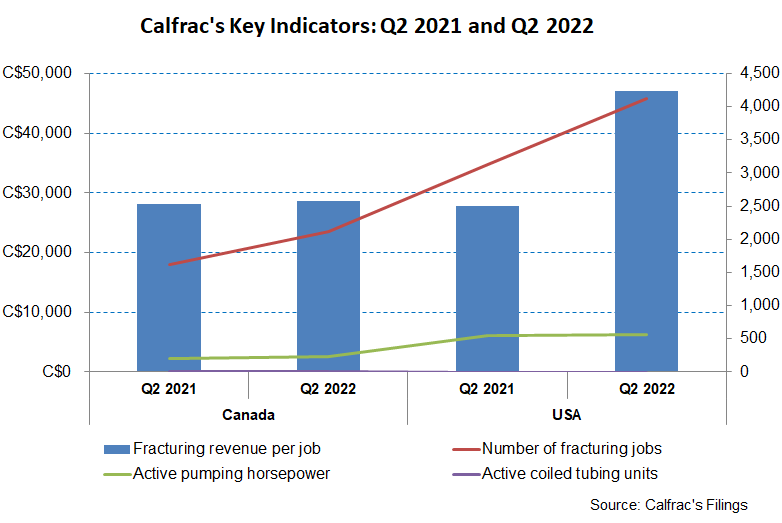
Year-over-year, Calfrac’s revenues from Canada increased by 40% in Q2 2022 due primarily to higher fracturing jobs, although fracturing revenue per job increased marginally in the past year. Plus, the company added to its active pumping horsepower during this period. However, compared to Q1, its revenues decreased due to the seasonal slowdown in activity following the spring breakup. Also, a $3.0 million litigation accrual related to product purchase commitments reduced the segment profit. As a result, the operating profit margin decreased significantly, by 350 basis points, to 5%.
Analyzing Recent Performance in US and Argentina
Calfrac’s revenues from the US increased by 124% in Q2 2022 compared to a year ago. Increased utilization and an average number of fleets contributed to the sales jump. The operating loss recorded a year earlier turned to a very healthy (18.5%) operating profit margin in Q2 2022. Strong utilization and an additional fleet that joined in May contributed to the recovery. During Q2, it implemented pricing increases for its operating fleets.
Its revenues from Argentina made significant progress (48% up) in Q2 despite a slowdown in fracturing and coiled tubing operations. Operating income, however, fell sharply to 3% – a 1000 basis point decrease due to an inflationary salary paid in local currency.
Cash Flows and Balance Sheet
Calfrac’s cash flow from operations (or CFO) improved and turned positive in 1H 2022 compared to a negative CFO a year ago. Although revenues increased in this period, a much higher working capital requirement following a steep appreciation of the Russian ruble led to the fall in CFO. Although free cash flow improved in Q1 2022 versus a year ago, it remained negative.
Calfrac’s debt-to-equity ratio (1.4x) is lower than Nabors Industries (NBR) but higher than some of its peers like Trican Well Services (TOLWF). During Q2, it repaid its CAD25 million secured bridge loan and reduced its funded debt and total debt leverage. As of June 30, 2022, its liquidity (cash plus investments plus availability of borrowings under the revolving credit facility) was $67 million.
Learn about Calfrac’s revenue and EBITDA estimates, relative valuation, and target price in Part 2 of the article.


