Primary Vision
  • HOME
  • ABOUT US
    • ABOUT US
    • PRIMARY VISION AI INNOVATIONS
  • RESEARCH
    • INSIGHTS & ARTICLES
    • FREE ARTICLES
  • EVENTS
  • PRESS
  • SUPPORT
  • FAQ
  • LATEST NEWS
  • LOGIN
  • SIGN UP!
    • FRAC SPREAD COUNT SIGN-UP!
    • ENTERPRISE SUBSCRIPTION PLAN SIGN UP!
  • HOME
  • ABOUT US
    • ABOUT US
    • PRIMARY VISION AI INNOVATIONS
  • RESEARCH
    • INSIGHTS & ARTICLES
    • FREE ARTICLES
  • EVENTS
  • PRESS
  • SUPPORT
  • FAQ
  • LATEST NEWS
  • LOGIN
  • SIGN UP!
    • FRAC SPREAD COUNT SIGN-UP!
    • ENTERPRISE SUBSCRIPTION PLAN SIGN UP!
No Result
View All Result
Primary Vision
Home Market Trends

Mammoth Energy Services Part 2: Estimates And Relative Valuation

Avik Chowdhury by Avik Chowdhury
September 6, 2022
in Market Trends
0
Mammoth Energy Services Part 2: Estimates And Relative Valuation

  • The regression equation suggests a steady revenue growth for TUSK in the next couple of years.
  • EBITDA can turn positive in NTM 2023 and continue to move up in NTM 2024.
  • The model suggests a wide variability in the stock price return potential.

Part 1 of this article discussed Mammoth Energy’s (TUSK) outlook, performance, and financial condition. In this part, we will discuss more.

Linear Regression Based Revenue Forecast

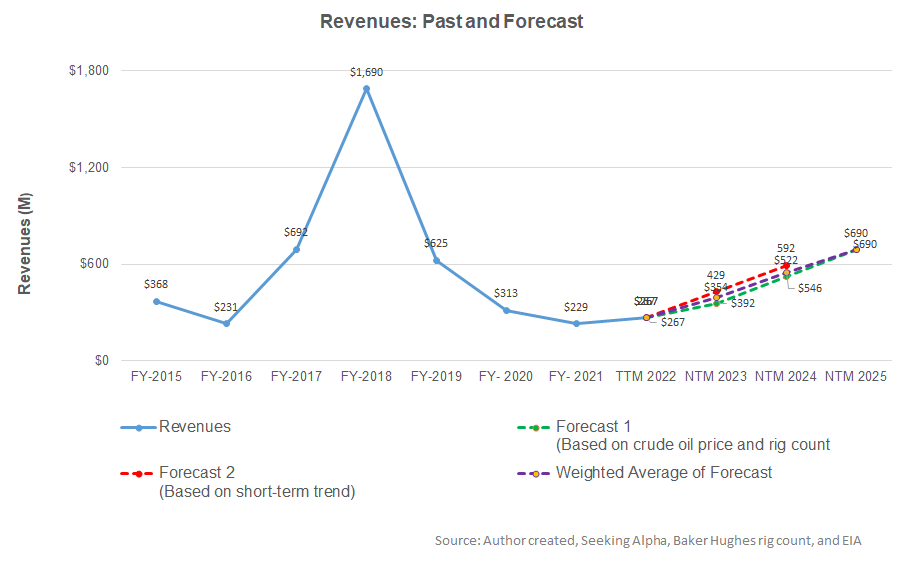
Based on a regression equation between the key industry indicators (crude oil price and rig count) and TUSK’s reported revenues for the past seven years and the previous four quarters, I expect its revenues to increase handsomely in the next 12 months (or NTM) 2023 and NTM 2024.

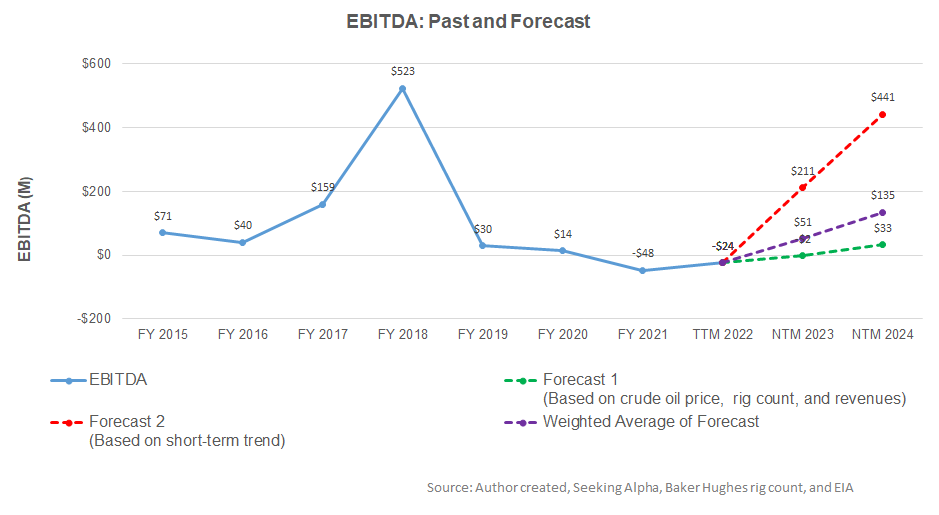
Based on the same regression models and the forecast revenues, I expect the company’s EBITDA to turn positive in NTM 2023. The model suggests that the EBITDA will jump in NTM 2024.

Target Price

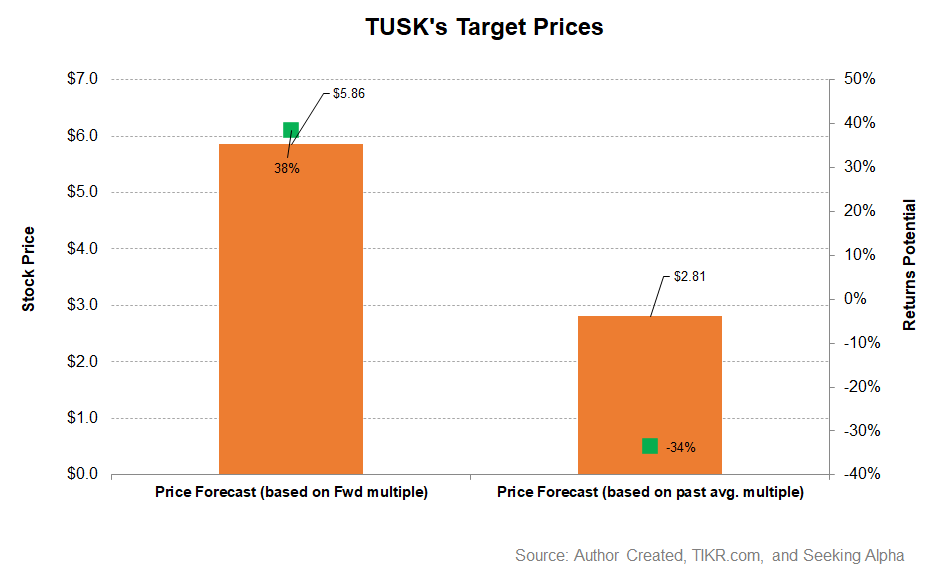
Returns potential using the forward EV/Revenue multiple (0.88x), as derived from the revenue forecast, is much higher (38% upside) than the returns potential using the past average EV/Revenue multiple (34% downside) from the stock.

Relative Valuation

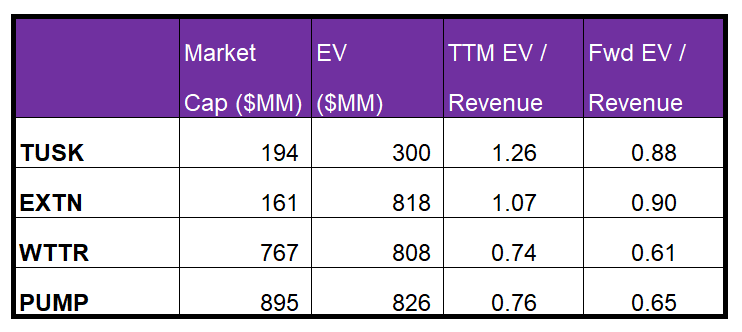
Mammoth Energy’s current EV/Revenue multiple is 1.26x. The stock’s past five-year average EV/EBITDA multiple was 0.89x. So, it is currently trading at a premium to its past average.

TUSK’s EV/Revenue multiple is higher than its peers’ (EXTN, WTTR, and PUMP) average of 0.86x. Because TUSK’s forward EV/EBITDA multiple is contracting more steeply than its peers, it typically reflects a higher EV/EBITDA multiple than its peers. So, the stock is reasonably valued at the current level with a negative bias.

What’s The Take On TUSK?

The oilfield services business brought rich dividends as the fracking business went from strength to strength in the US in 2022. It operated four hydraulic fracturing fleets in Q2, up from three in Q1. The number can rise to five in Q3 and six in Q1 2023. By the end of 2023, its fleet count can increase to seven. The sand business has adopted a vertical integration model, enabling it to switch from T&D equipment to refurbishing frac equipment.

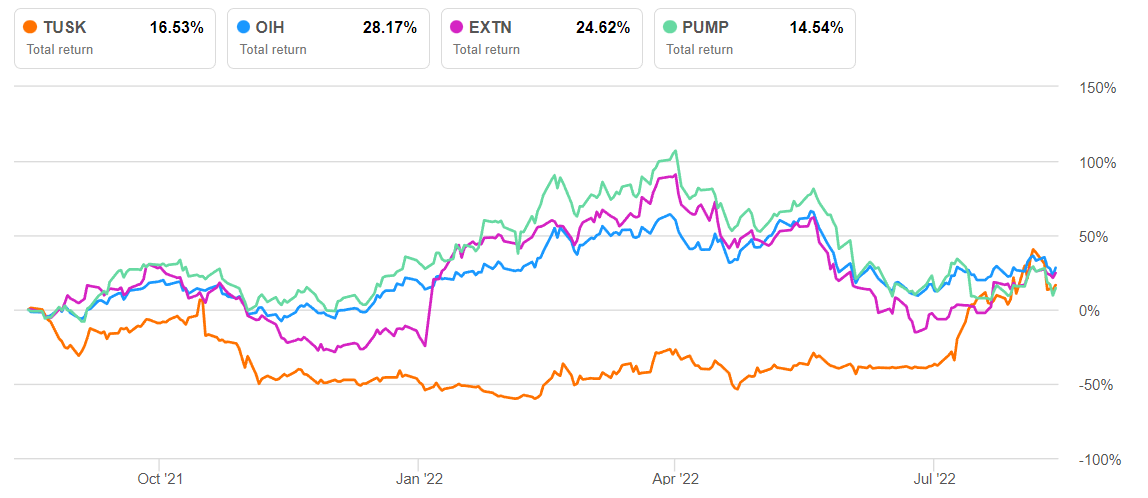
However, the US GDP technically entered a recession in Q2 as the growth rate declined in two successive quarters. Therefore, the company’s infrastructure business faces headwinds, although the government’s increased spending can potentially bring growth back. The PREPA-related matter drags on as the company announced the first appeal response from FEMA. With much of its accounts receivable trapped in the PREPA contracts, negative cash flows in 1H 2022 put some strain on its finances. So, despite the positive drivers, the stock underperformed the VanEck Vectors Oil Services ETF (OIH) in the past year. The company’s balance sheet is free from any immediate impending risks. Given its reasonably well-placed relative valuation, investors might want to hold the stock in the short term.

Previous Post

Mammoth Energy Services Part 1: Frac Fleet Growth Versus Sedate Economic Activity

Next Post

Year-Over-Year Oil Data (USA)

Related Posts

Halliburton’s Perspective in Q1: KEY Takeaways
Market Trends

Halliburton’s Perspective in Q1: KEY Takeaways

May 16, 2025
STEP Energy Services: Q1 TAKE THREE
Market Trends

STEP Energy Services: Q1 TAKE THREE

May 15, 2025
Market Sentiment Tracker: Demand Holds, Cracks Widen
Market Trends

Market Sentiment Tracker: Demand Holds, Cracks Widen

May 14, 2025
Monday Macro View: What is the connection between Frac Job Count and OPEC’s production? Enterprise Subscribers
Market Trends

Monday Macro View: What is the connection between Frac Job Count and OPEC’s production? Enterprise Subscribers

May 12, 2025
Liberty Energy’s Perspective in Q1: KEY Takeaways
Market Trends

Liberty Energy’s Perspective in Q1: KEY Takeaways

May 12, 2025
KLX Energy Services: Q1 TAKE THREE
Market Trends

KLX Energy Services: Q1 TAKE THREE

May 9, 2025
Next Post
Year-Over-Year Oil Data (USA)

Year-Over-Year Oil Data (USA)

Please login to join discussion

Recent News

Halliburton’s Perspective in Q1: KEY Takeaways

Halliburton’s Perspective in Q1: KEY Takeaways

May 16, 2025
STEP Energy Services: Q1 TAKE THREE

STEP Energy Services: Q1 TAKE THREE

May 15, 2025
FREE READ: Oil Markets Trying to find direction

FREE READ: Oil Markets Trying to find direction

May 14, 2025
Market Sentiment Tracker: Demand Holds, Cracks Widen

Market Sentiment Tracker: Demand Holds, Cracks Widen

May 14, 2025
Monday Macro View: What is the connection between Frac Job Count and OPEC’s production? Enterprise Subscribers

Monday Macro View: What is the connection between Frac Job Count and OPEC’s production? Enterprise Subscribers

May 12, 2025
Primary Vision

Established in 2011, we are renowned for our expert frac data and analytics, providing a rich array of unique indicators and industry commentary.

CONTACT

+1-713-554-4977
info@primaryvision.co

SOCIAL NETWORKS

POLICIES

Privacy Policy
Terms of Use

PARTNERS

Amazon Web Services

TRUSTED SITES

Logo

Logo

RECENT NEWS

Halliburton’s Perspective in Q1: KEY Takeaways

Halliburton’s Perspective in Q1: KEY Takeaways

May 16, 2025
STEP Energy Services: Q1 TAKE THREE

STEP Energy Services: Q1 TAKE THREE

May 15, 2025
FREE READ: Oil Markets Trying to find direction

FREE READ: Oil Markets Trying to find direction

May 14, 2025
Market Sentiment Tracker: Demand Holds, Cracks Widen

Market Sentiment Tracker: Demand Holds, Cracks Widen

May 14, 2025
Monday Macro View: What is the connection between Frac Job Count and OPEC’s production? Enterprise Subscribers

Monday Macro View: What is the connection between Frac Job Count and OPEC’s production? Enterprise Subscribers

May 12, 2025
  • HOME
  • ABOUT US
  • RESEARCH
  • EVENTS
  • PRESS
  • SUPPORT
  • FAQ
  • LATEST NEWS
  • LOGIN
  • SIGN UP!

© 2025 Primary Vision. All rights reserved.

  • HOME
  • ABOUT US
    • ABOUT US
    • PRIMARY VISION AI INNOVATIONS
  • RESEARCH
    • INSIGHTS & ARTICLES
    • FREE ARTICLES
  • EVENTS
  • PRESS
  • SUPPORT
  • FAQ
  • LATEST NEWS
  • LOGIN
  • SIGN UP!
    • FRAC SPREAD COUNT SIGN-UP!
    • ENTERPRISE SUBSCRIPTION PLAN SIGN UP!

© 2025 Primary Vision. All rights reserved.