- Solaris Oilfield’s number of fully utilized systems growth can moderate in 2H 2022
- Its top fill system can grow from two in Q2 to ten in Q3
- Its top fill, last mile services, fluid silos, and the AutoBlend units can increase cost absorption and maximize profit in late 2022
- However, increased capex can drain SOI’s free cash flow in 2H 2022
Identifying The Drivers

Please read our previous article to understand the company’s business better. Because the overall addressable market size remained relatively confined to six sand silos, SOI focused on providing valued added services and technologies to supplement its core offering. This, in turn, expands its revenue base. However, frac crew count remains the primary indicator for its operating performance, top fill solution like the AutoBlend unit, water, and chemical silos, and sophisticated last mile offering improved its profitability.
Its management believes that raw material supply, including the design of a low-pressure side of the well site, and integrated sand, water, and chemical storage, can offer superior value to its customers. So, its revenue and profit per frac fleet increased since the 2020 downturn.
AutoBlend And Other Innovations
AutoBlend (an integrated all-electric blender technology for cleaner power sources) led to 50% higher blended revenue days in Q2. As new electric frac fleets are expected to be operational in the market in 2023, the AutoBlend deployment can see SOI capturing the market share faster than many of its peers. The company’s investment is also high in sites where it deploys the top fill, last mile services, fluid silos, and the AutoBlend unit. Its capex increased by 320% in the past year until Q2 2022. Expected returns from the investment are also high (2x-3x the return or contribution margin per frac crew) compared to a single 6-pack sand system.
On top of that, Solaris’s sand silo system can penetrate new or underrepresented markets such as the Rockies and Bakken. Because the company’s integrated sand silo systems are more profitable than the stand-alone systems, the management expects the profit per system to expand over time. In a more recent innovation, SOI started testing the handling of wet sand. Wet sand can only be transported in smaller volumes per truckload, which increases the total delivered cost. The cost can be lowered by reducing trucking distances with more proximal mine locations and eliminating costs. SOI can become a significant player in this market because
What’s The Q3 Outlook?
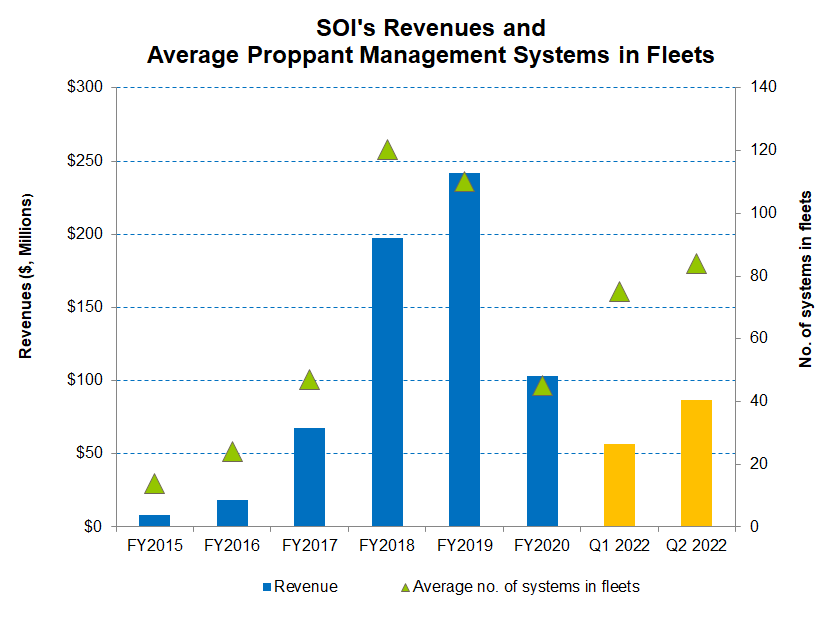
After more than a 12% increase in the average utilized number of systems in fleets, SOI’s management expects the frac fleet count growth to moderate in 2H 2022. It expects a contribution from new technologies, last mile logistics, and improved system cost absorption to lead to a higher margin. The growth will be sharp in the top fill systems, where the average number of fleets can grow from two in Q2 to ten in Q3. It also expects similar growth in Q4.
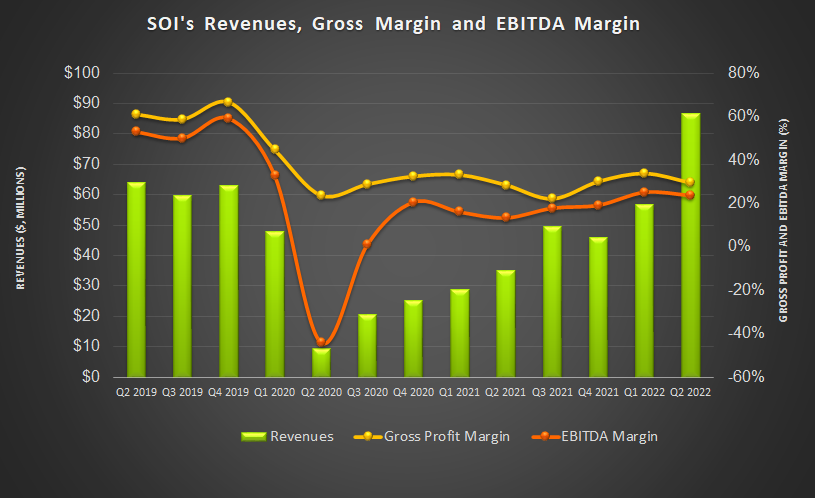
A shortage of people and equipment can lead to a much restrained 5%-10% fleet count rise in Q3 compared to Q2. Near-term headwinds, including an increase in field headcount and associated support costs and repairs and maintenance expenses, can lead to a modest 5% increase in gross profit margin per system from Q2 to Q3.
Analyzing The Q2 Drivers

In Q2 2022, Solaris Oilfield Infrastructure’s total revenues increased by ~52% compared to Q1 2022. During Q2, the higher demand for fracking operations, incremental demand for SOI’s new technologies, and its integrated last-mile logistics offering resulted in higher revenues. The gross profit margin for the fully utilized system was inflated by 18% in Q2 sequentially as it deployed more top fill and AutoBlend units.

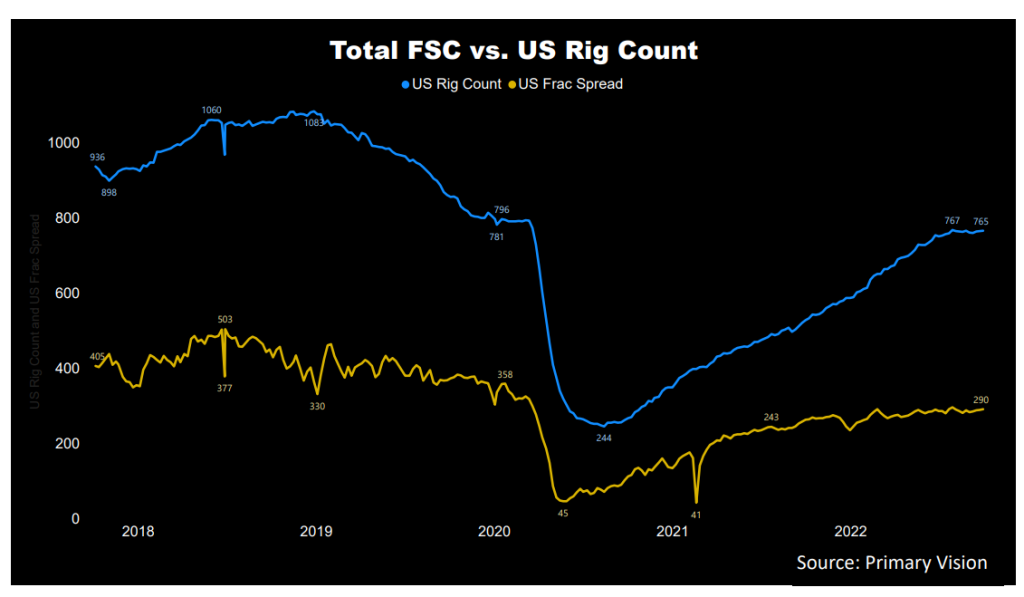
In the past year, the drilled wells increased by 53% until August 2022, according to the EIA’s latest Drilling Productivity Report. In contrast, the drilled but uncompleted wells (or DUC) declined by 26% during the same period. Although higher West Texas Intermediate (WTI crude oil) encouraged the drilled and completed well counts, the crude oil price has weakened over the past month. According to Primary Vision’s forecast, the frac spread count (or FSC) reached 290 by the END of September and increased by 12% in the past year.
Free Cash Flow, Capex, And Dividend
As of June 30, 2022, SOI’s cash & equivalents were $15.4 million, while it has no debt. Its total liquidity amount to $65 million. The liquidity should suffice working capital and growth needs in 2022.
SOI’s cash flow from operations (or CFO) increased substantially in 1H 2022 compared to a year ago. However, its capex also tripled, resulting in free cash flow (or FCF) going further into the negative territory in the past year. A higher capex was led by activity growth and higher trucking payments associated with the integrated last-mile services offering. In FY2022, it plans to commit between $50 million and $60 million in capex, which would be a 180% increase compared to FY2021.
SOI’s forward dividend yield is 4.61%., Schlumberger (SLB), the largest oilfield services company, has a forward dividend yield of 2.0%, while Halliburton’s (HAL) dividend yield is 1.95%.
Learn about SOI’s revenue and EBITDA estimates, relative valuation, and target price in Part 2 of the article.


