- Precision Drilling’s active drilling rig count can increase modestly in Canada in 2H 2022
- Spot market repricing, the positive impact of technologies, and higher fixed cost absorption can improve its operating margin significantly in Q3.
- However, the rising rig prices can divert demand to less-efficient drilling rigs
- Free cash flow turning negative can hamper its plans to slash debt significantly between 2022 and 2025
Strategies And Outlook In Canada And US

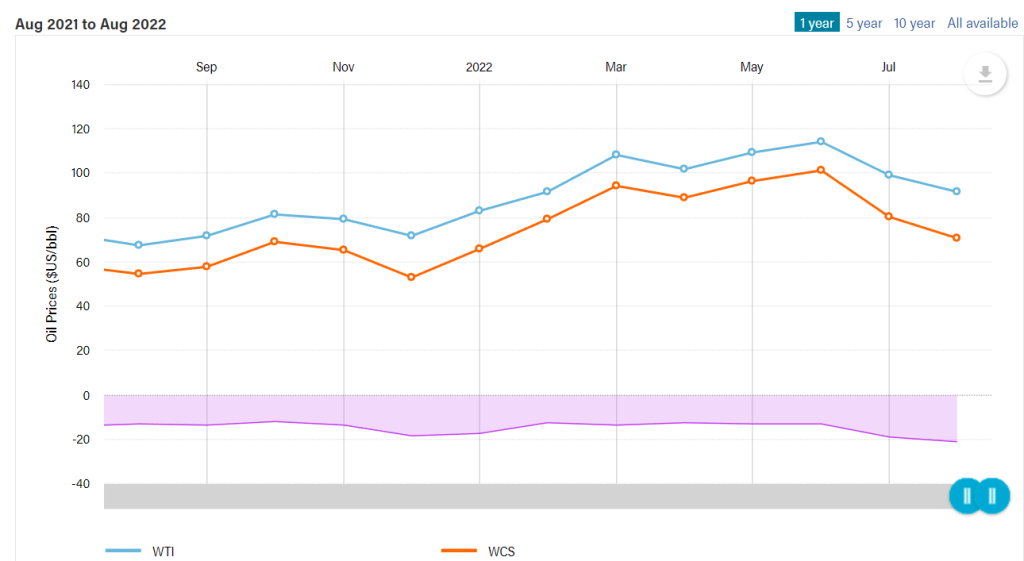
The WCS (Western Canada Select)–WTI (West Texas Intermediate) spread is a crucial indicator of Canadian energy companies performance. The WTI price averaged $99 a barrel from January to August, 56% higher than a year ago. WCS averaged ~$85, or 64% higher than a year ago. Since the spread deteriorated (i.e., the spread expanded) in 2022, expect the impact to be negative in Q3.
Our previous PDS article discussed the benefits of Alpha Automation and Alpha Apps in high-spec ST-1500 rigs. Over two-thirds of its Superior Triple rigs drilling in multi-well pads have adopted these technologies, while some are adopting Alpha Analytics also. The benefits are evident in day rates. The day rates for these rigs are now approaching the mid-30,000 (CAD). Adding Alpha Analytics and managed pressure drilling support can take it to the high-30,000 to 40,000 (CAD) per day range. On top of that, many of the rig upgrade programs the company implemented over the past year are backed by take-or-pay contracts, ensuring a steady return on investment.
Day Rate And International Activity
In Canada, PDS expects its rig count to rise by 9 to 70 by the end of Q3. In many energy-rich shales, the conventional heavy oil and steam-assisted horizontal oil plays are rebounding from their previous lows. Overall, the industry rig count in Canada increased by more than 50% year-to-date. PDS also expects utilization to exceed 80% here, while the leading-edge day rate can touch a low 20,000.
Customer demand has exceeded the available rates for many Super Triples rigs booked until Q1 2023. The leading-edge rates in Canada may push into the 30,000 for these rigs. However, the rising prices of these rigs can divert demand to less-efficient heavy tele-double drilling rigs. In that event, the company may mobilize a couple of rigs to Canada through DJ Basin.
To protect margin and improve cash flows, the company has, in principle, rejected projects where customers are unwilling to increase prices or do not accept take-or-pay contracts to cover rig upgrades. It has adversely affected its market share. It is likely to lose 10 to 12 rigs in Q3 and Q4 following the pursuit of this strategy.
US Market Outlook
The spot market rigs repricing, the positive impact of Alpha Technologies, and higher fixed cost absorption can improve margin in Q3. In the US, PDS’s management expects the operating margin per rig to increase by ~40% to the mid-$9,000s per day in Q3 compared to Q2. It can improve further to $10,000 per day in Q4.
Canada And International Market Outlook
The company will benefit from similar drivers in Canada as in the US. So, the operating margin per rig can increase by ~16% to the mid-$8,500s per day in Q3 compared to Q2. The company’s rigs in Kuwait would be reactivated in the international market with long-term contracts. In Saudi Arabia, its three rigs will continue to operate after being recently renewed for five years.

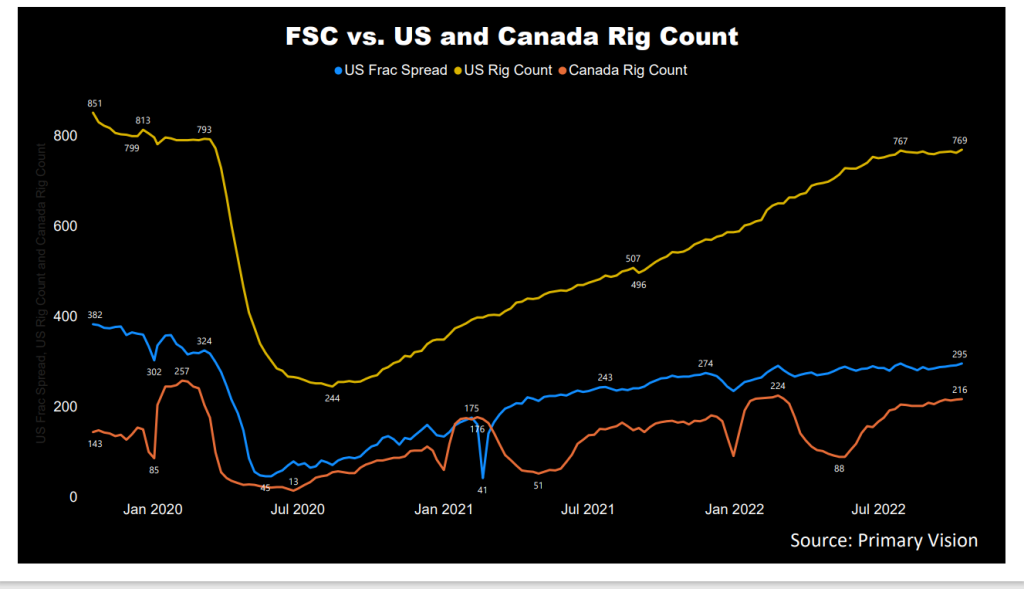
The US active frac spread count went up by 24% in 2022, according to Primary Vision’s estimates. The rig count increased by 30% year-to-date, while the rig count in Canada went up by 53%. The fast recovery in industrial activity, especially in Canada, is a positive for PDS.
Utilization And Other Key Metrics

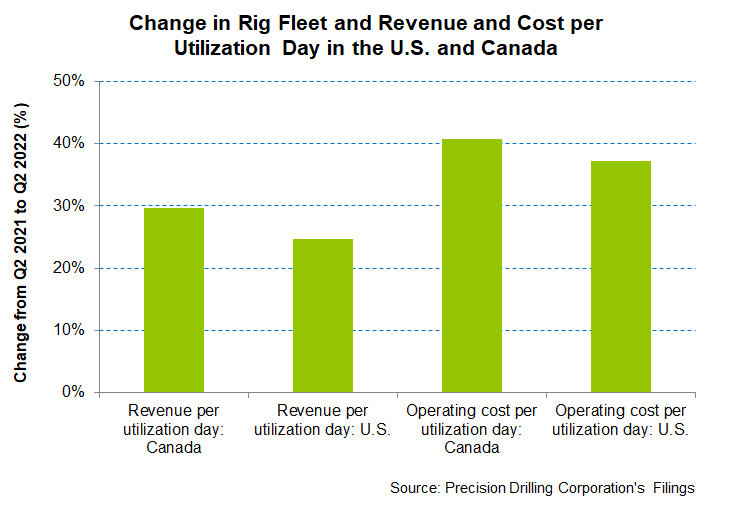
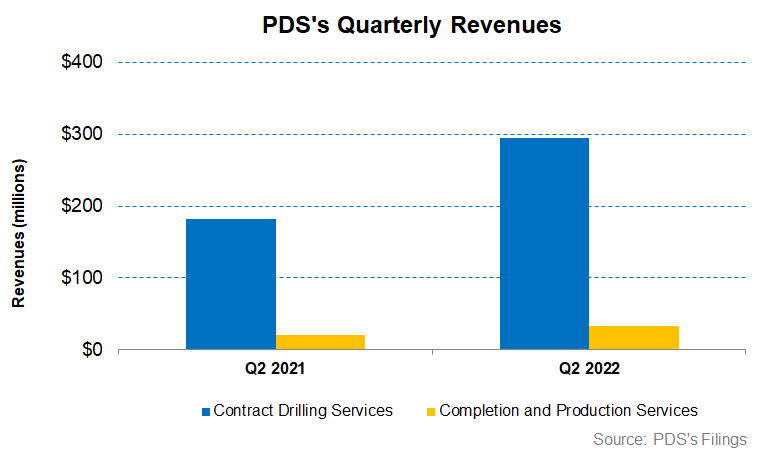
During Q2, PDS benefited from higher day rates, cost control, and cost recoveries. Between Q2 2021 and Q2 2022, the company added ten drilling rigs in Canada. The average revenue per utilization day increased by 30% in Canada in Q2 compared to a year ago. Operating cost per utilization day exceeded the revenue growth (41% rise), leading to an 8.6% operating profit expansion.

The company added 16 drilling rigs in the US between Q2 2021 and Q2 2022. The average revenue per utilization day increased by 25% in the US in Q2 compared to a year ago. Operating cost per utilization day went up by 37%, leading to a nearly unchanged operating profit margin in the past year.
Debt And Cash Flows
FY 2022, it expanded its capital budget to CAD149 million from CAD125 million disclosed earlier. In 1H 2022, PDS’s cash flow from operations (or CFO) increased compared to a year ago, led by a rise in revenues during this period. In 2H 2022, the company expects higher day rates in the take-or-pay term contracts, improving margin and adding to the cash flows. In 1H 2022, capex also increased, leading to a negative free cash flow (or FCF) in 1H 2022 compared to a positive FCF a year ago. So, its free cash flow is unlikely to improve much in 2H 2022.
As of June 30, 2022, the company’s leverage (debt-to-equity ratio) of 0.97x was in line with its peers’ (HP, NBR, PTEN) average of 0.93x. It plans to reduce debt by CAD 400 million between 2022 and 2025. Its net debt to adjusted EBITDA ratio is 4.5x, while it expects to lower it to 3x by 2022-end and further to 1.5x by 2023-end. The available liquidity was $540 million as of June 30. In August, the company repurchased 10% of its publicly floating shares
Learn about PDS’s revenue and EBITDA estimates, relative valuation, and target price in Part 2 of the article.


