- Patterson-UTI Energy plans to add nine rigs from Q3 to early 2023 and reactivate a frac fleet in Q4.
- Average revenue and margin in contract drilling are likely to improve in Q4 but may decline in the pressure pumping operations due to the seasonal holidays.
- Leading-edge pricing and longer contract duration can improve profit margins in the short-to-medium term.
- The company doubles its quarterly dividend and plans to raise shareholders’ returns through dividends and share buybacks.
EBITDA Forecast And Key Drivers
After Q3, PTEN’s management expects more rapid improvements in pricing and acceleration of rig upgrades than anticipated in its previous estimates, which we discussed in our article here. So, it revised its adjusted EBITDA, estimated $50 million to $650 million in FY2022. It also increased its FY2022 capex forecast by 9% to $425 million. It plans to add another Tier 4 pressure pumping fleet to its portfolio.
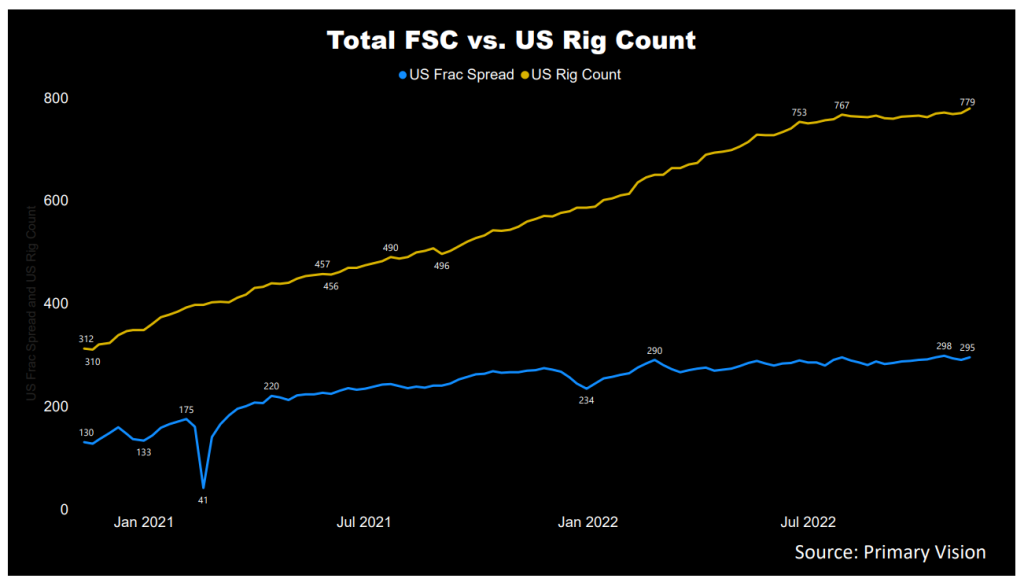
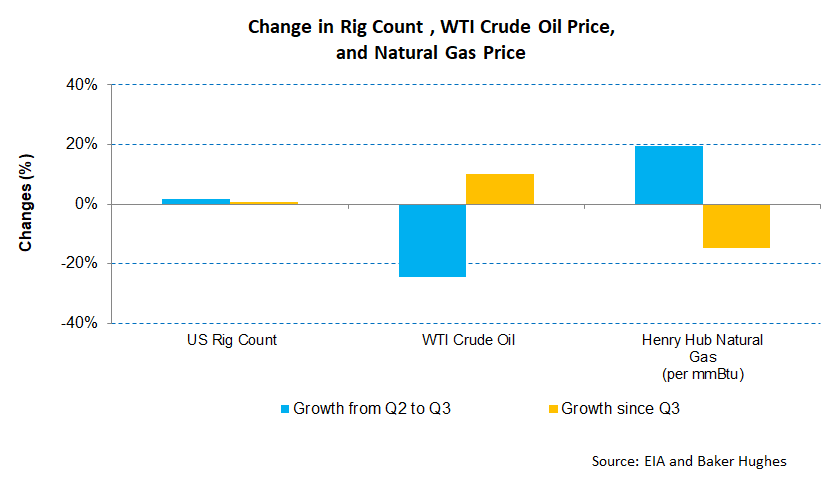
As estimated by Primary Vision, the frac spread count went up by 27%, while the US rig count has gone up by 32% in 2022. The crude oil price, riding through a volatile period, declined 25% in Q3 before rising again in the past few weeks. In consonance with Halliburton’s (HAL) And Schlumberger’s (SLB) views, PTEN’s management believes the industry is in the early stages of a multi-year upcycle. Although upstream capex and E&P will remain constrained, drilling and completion activity will likely pick up in 2023. However, one of the critical challenges for the oilfield services company is the relatively short duration of the energy cycles to earn sufficient profits. Because the OFS industry lags behind its drilling counterpart, the crude oil price volatility interferes with generating profitable growth. The current crude oil price uncertainty can suppress the profitability potential for PTEN.
What Are The Indicators Signaling?
Currently, PTEN expects to operate ~81 rigs under a term contract in Q4, while for Q3 2023, it has 56 rigs under a term contract. In Q3, it added seven rigs, which took the count to 128. In Q4, it has already added three more. It may add a couple more before the end of 2022 and take the count to 137 in early 2023. At the end of Q3, its term contracts for drilling rigs in the US provided $710 million of future day rate drilling revenue or 83% more than a quarter ago.
According to PTEN’s management, the leading-edge pricing for Tier-1 super spec drilling rigs is ~$40,000 per day, much higher than a quarter ago. As pricing improves, the company increases the number of rigs under term contracts, thus improving profitability. During Q3, its US contract drilling backlog increased by 61%. Five rigs saw contracts signed for over three years. Longer contract periods typically beings cash flow stability.
Pressure Pumping and Clean Energy Outlook
It invests in specific technologies. These include Ecostar technology to reduce emissions at the well site. Recently, PTEN purchased a Tier IV engine and reactivated its 13th frac spread. As a result of improved performance, its adjusted EBITDA per spread improved significantly over the past few quarters.
The company also invests in lithium battery hybrid solutions (EcoCell) and automated engine management systems (CORTEX) for drilling operations. The company estimates it will significantly eliminate diesel consumption from drilling operations in 2022.
Contract Drilling Segment: Analyzing Outlook And Performance
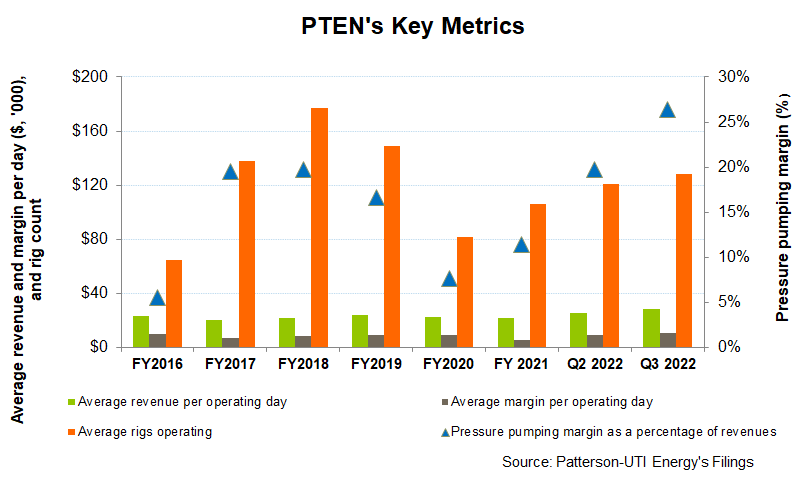
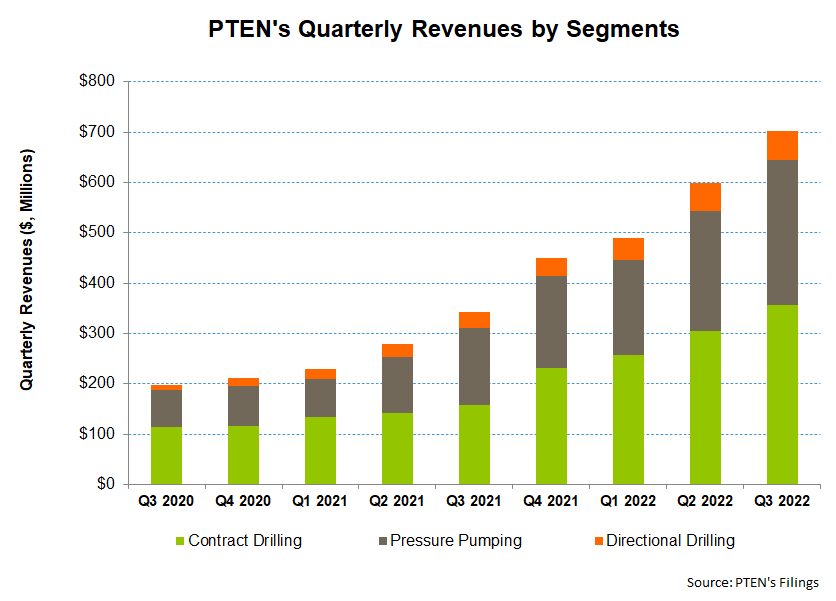
In Q3 2022, PTEN’s average revenue per operating day increased (11% up) quarter-over-quarter. Due to wage inflation and higher repairs and maintenance, operating costs increased nearly as much. This led to a 12% rise in the average margin. In Q4, higher revenue per day can lead to the average adjusted rig margin per day increasing by $1,500 to almost $12,000 per day.
Pressure-pumping revenues, which increased sequentially by 21% in Q3, can see an operating performance deceleration due to the ensuing holiday downtime. So, revenues in this segment can decrease by 9% in Q4. The segment gross profit, which increased by 62% in Q3, can deflate by 18% in Q4. Revenues from the Directional Drilling segment can improve in Q4.
Dividend
PTEN pays an annual dividend of $0.32 per share after it raised its quarterly dividend to be paid in December. Its forward dividend yield is 1.9%. Helmerich & Payne’s (HP) dividend yield (2.0%) is higher.
The company’s key strategy is to raise shareholders’ returns through dividends and share buybacks. It considers a few necessary conditions are being fulfilled that would allow it to increase shareholders’ returns. These include a multi-year upcycle, lower capital intensity following the retooling of the drilling rig fleet to AC-powered high spec and super spec rigs, and increasing cash flow visibility from term contracts. It targets to return nearly half of its free cash flow generation to the shareholders.
Capex And Debt
In 9M 2022, PTEN’s cash flow from operations (or CFO) increased sharply (by 4.1x) compared to 9M 2021, led by 109% higher revenues. However, capex rose tremendously in the past year, offsetting all the gains. As a result, free cash flow (or FCF) steeped further into the negative territory in 9M 2022.
The company had $618 million in liquidity (cash & equivalents plus revolving credit facility available) as of September 30, 2022. Its debt-to-equity (0.52x) is lower than its peers’ (NBR, HP, and LBRT) average of 1.3x. With a further increase in capex, as discussed above, FCF can deteriorate further in Q4. Despite negative FCF, its near-term financial risks remain low because of robust liquidity.
Learn about PTEN’s revenue and EBITDA estimates, relative valuation, and target price in Part 2 of the article.


