- Solaris Oilfield’s utilized systems addition can stabilize in Q4 2022 compared to Q3
- Seasonality, system and startup costs and a reduction in last-mile activity can weigh on its operating margin in the near term
- It focuses on improving market share through integrated services, including top fill, last mile services, and the AutoBlend units in 2023
- Its free cash flow was negative in 9M 2023; however, lower capex can improve FCF in 2023
A Shift In Value Drivers

Please read our previous article to understand the company’s business better. Over the past couple of years, SOI has concentrated on sophisticated last-mile service offerings, water, and chemical silos, top-fill solutions, and the AutoBlend unit. The last-mile services provide a bundled package, including sand storage and delivery. The top-fill solutions have replaced traditional boxes or other bottom-drop solutions. It lets sand handling equipment operate using high-capacity belly dump and pneumatic trucking AutoBlend (an integrated all-electric blender technology for cleaner power sources) provides an all-electric solution for many electric frac operators.
During Q3, it improved its market share and achieved growth by deploying additional top-fill units. By using belly dump trucks, it increased per truck payload, leading to a reduction in total truck miles per job. As a result, the overall trucking costs were reduced. On top of that, the system helped SOI focus on the Rockies and Bakken, which had a smaller presence. Because of higher payload allowances, using bottom-drop trucks in these regions can be profitable. According to its estimates, total truck miles can reduce by up to 20% to 40%, depending on the shale basins. It helps drive a backlog of demand for the top-fill technology in the legacy shales and the relatively untapped areas like the Rockies.
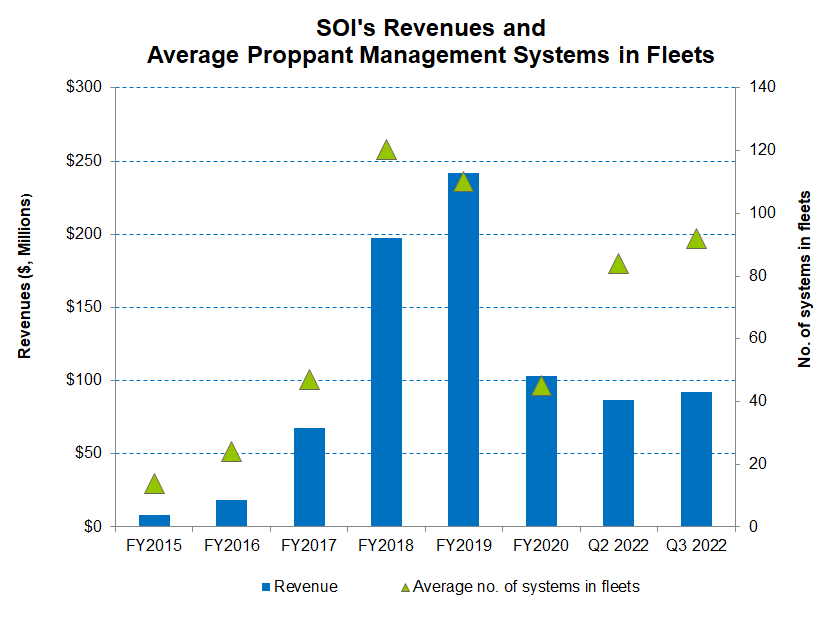
During Q3, SOI added seven fully utilized top fill units versus Q2. However, the rate of system addition declined sharply in Q3 compared to Q2. It expects to deploy additional units at a similar pace over the coming quarters. Approximately one-third of its top fill units will drive underutilized pull-through sand systems.
What’s The Q4 Outlook?
SOI’s management expects a slight divergence in the sand system and frac market outlook. While the sand system demand is likely to pull through, seasonality can lower demand for frac equipment in the near term. Sand systems, however, will remain fully utilized.
A rise in demand for electric fracs will augur well for SOI’s AutoBlend deployment. The roll-out of the top-fill equipment jibes well for integrated last-mile offerings and helps improve margin. However, the volatility in job mix can be challenging for any efforts to improve last-mile profitability because seasonality can lower the flat-thin system counts. So, the potential seasonality effect, continued system and startup costs, and a reduction in last-mile activity can weigh on its operating profitability in Q4. Nonetheless, the frac demand should be able to see through all the short-term hiccups, and its earning potential per frac crew is expected to strengthen in 2023.
Analyzing The Q3 Drivers

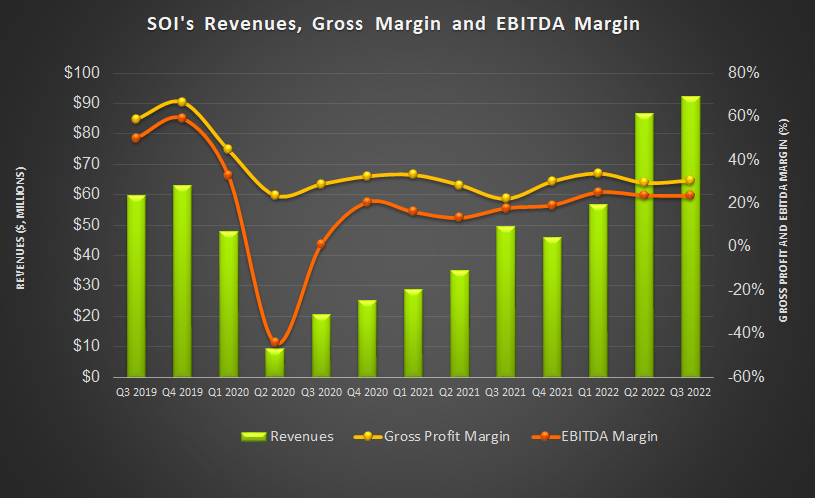
In Q3 2022, Solaris Oilfield Infrastructure’s sequential revenue growth moderated compared to the previous quarter’s growth rate. It increased by ~6.5% compared to Q2. During Q3, its fully utilized system count increased 12% quarter-over-quarter as demand for traditional and new technologies grew. Despite stronger top fill and sand system deployments, lower volume and adverse changes in last-mile logistics offering mitigated the positive effect on the operating margin. So, its adjusted EBITDA margin remained nearly unchanged in Q3 (at 23.5%).

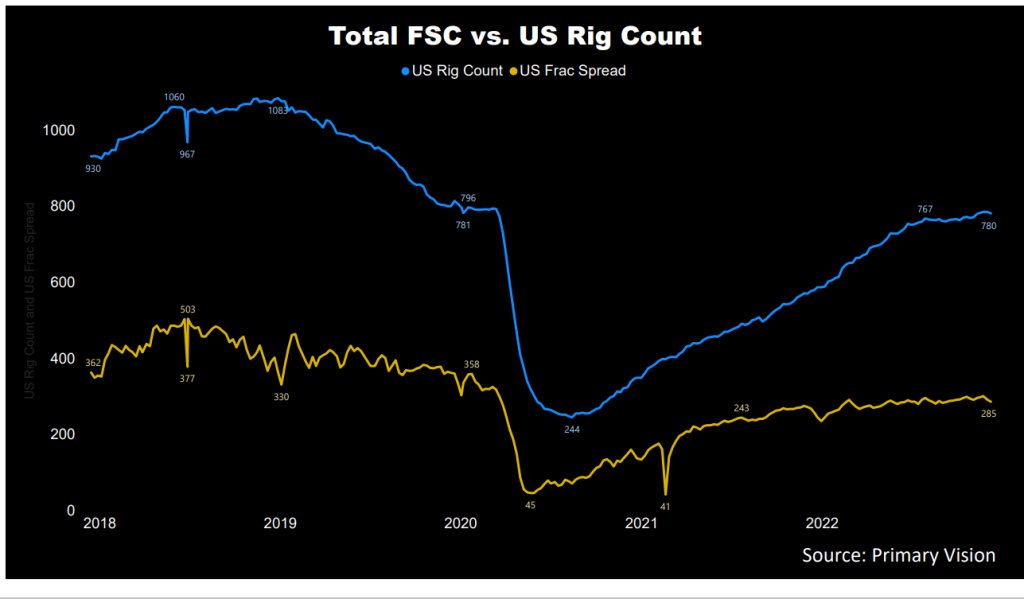
In the past year, the drilled wells increased by 32% until October 2022, according to the EIA’s latest Drilling Productivity Report. In contrast, the drilled but uncompleted wells (or DUC) declined by 11% during the same period. However, the crude oil price has weakened over the past month, which can lower drilled well count’s growth. According to Primary Vision’s forecast, the frac spread count (or FSC) reached 285 by the second week of December and increased by 22% year-to-date.
Free Cash Flow, Capex, And Dividend
As of September 30, 2022, SOI’s cash & equivalents were $10.4 million, while it has no debt. Its total liquidity amount to $54 million. The liquidity should suffice working capital and growth needs in 2022.
SOI’s cash flow from operations (or CFO) increased substantially in 9M 2022 compared to a year ago. However, its capex more than tripled, resulting in free cash flow (or FCF) going further into the negative territory in the past year. In Q4, it plans to commit between $15 million and $20 million in capex, which would be a 36% fall compared to Q3. In FY 2023, it plans to spend $75 million in capex, which would be 9% lower than the FY2022 capex budget. The FY2023 capex program is geared toward the year’s first half.
SOI’s forward dividend yield is 3.84%., Schlumberger (SLB), the largest oilfield services company, has a forward dividend yield of 1.4%, while Halliburton’s (HAL) dividend yield is 1.32%.
Learn about SOI’s revenue and EBITDA estimates, relative valuation, and target price in Part 2 of the article.


