Primary Vision
  • HOME
  • ABOUT US
    • ABOUT US
    • PRIMARY VISION AI INNOVATIONS
  • RESEARCH
    • INSIGHTS & ARTICLES
    • FREE ARTICLES
  • EVENTS
  • PRESS
  • SUPPORT
  • FAQ
  • LATEST NEWS
  • LOGIN
  • SIGN UP!
    • FRAC SPREAD COUNT SIGN-UP!
    • ENTERPRISE SUBSCRIPTION PLAN SIGN UP!
  • HOME
  • ABOUT US
    • ABOUT US
    • PRIMARY VISION AI INNOVATIONS
  • RESEARCH
    • INSIGHTS & ARTICLES
    • FREE ARTICLES
  • EVENTS
  • PRESS
  • SUPPORT
  • FAQ
  • LATEST NEWS
  • LOGIN
  • SIGN UP!
    • FRAC SPREAD COUNT SIGN-UP!
    • ENTERPRISE SUBSCRIPTION PLAN SIGN UP!
No Result
View All Result
Primary Vision
Home Market Trends

Mammoth Energy Services Part 2: Estimates And Relative Valuation

Avik Chowdhury by Avik Chowdhury
December 13, 2022
in Market Trends
0
Mammoth Energy Services Part 2: Estimates And Relative Valuation

  • Our regression equation suggests a steep revenue growth for TUSK in NTM 2023 and steady growth afterward.
  • EBITDA, too, can increase sharply in NTM 2023 and continue to move up in NTM 2024.
  • The stock is reasonably valued versus its peers.

Part 1 of this article discussed Mammoth Energy’s (TUSK) outlook, performance, and financial condition. In this part, we will discuss more.

Linear Regression Based Revenue Forecast

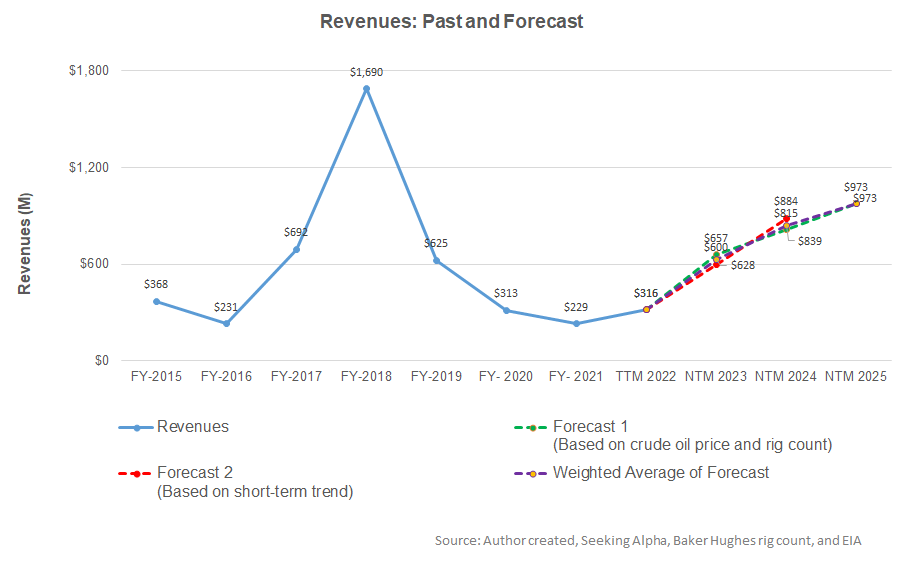
Based on a regression equation between the key industry indicators (crude oil price and rig count) and TUSK’s reported revenues for the past seven years and the previous four quarters, I expect its revenues to nearly double in the next 12 months (or NTM) 2023. The growth rate can moderate in NTM 2024.

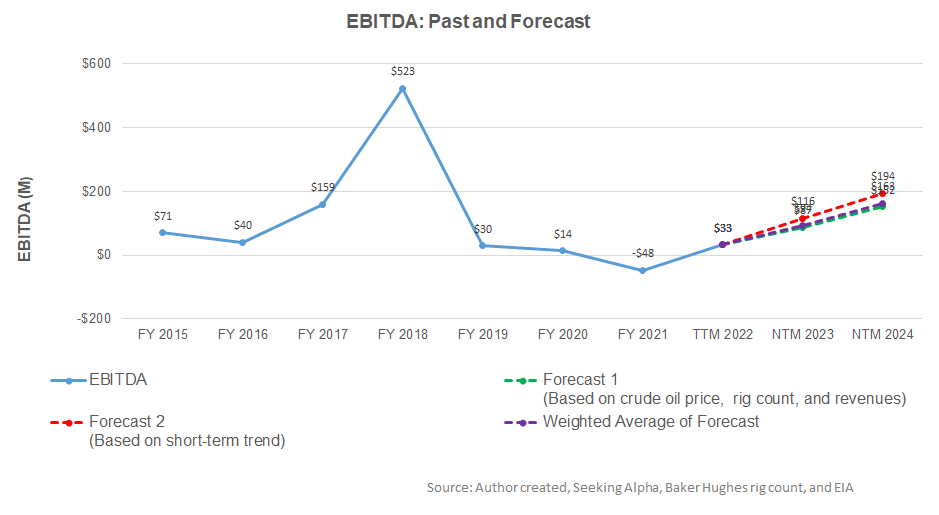
Based on the same regression model and the forecast revenues, I expect the company’s EBITDA to increase by 185% in NTM 2023. The model suggests that the EBITDA growth rate will decelerate to 73% in NTM 2024.

Target Price And Relative Valuation

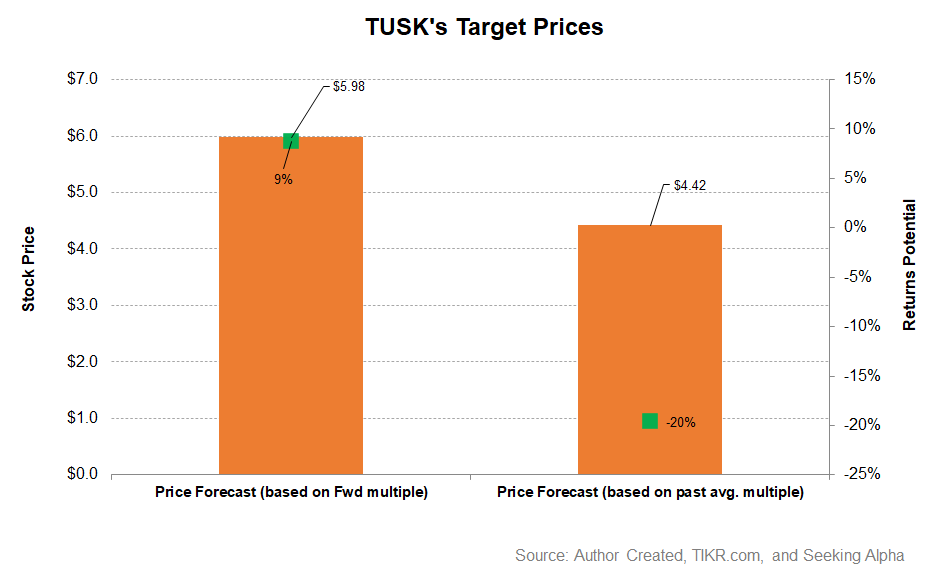
Returns potential using the forward EV/Revenue multiple (0.60x), as derived from the revenue forecast, is much higher (9% upside) than the returns potential using the past average EV/Revenue multiple (20% downside) from the stock.

Relative Valuation

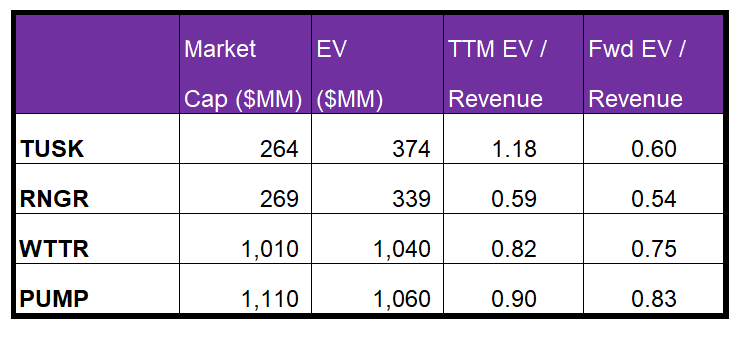
Mammoth Energy’s current EV/Revenue multiple is 1.2x. The stock’s past five-year average EV/EBITDA multiple was 0.81x. So, it is currently trading at a premium to its past average.

TUSK’s EV/Revenue multiple is higher than its peers’ (EXTN, WTTR, and PUMP) average of 0.77x. Because TUSK’s forward EV/Revenue multiple is contracting more steeply than its peers (because the revenue growth is higher), it typically reflects a higher EV/Revenue multiple than its peers. So, the stock is reasonably valued at the current level.

What’s The Take On TUSK?

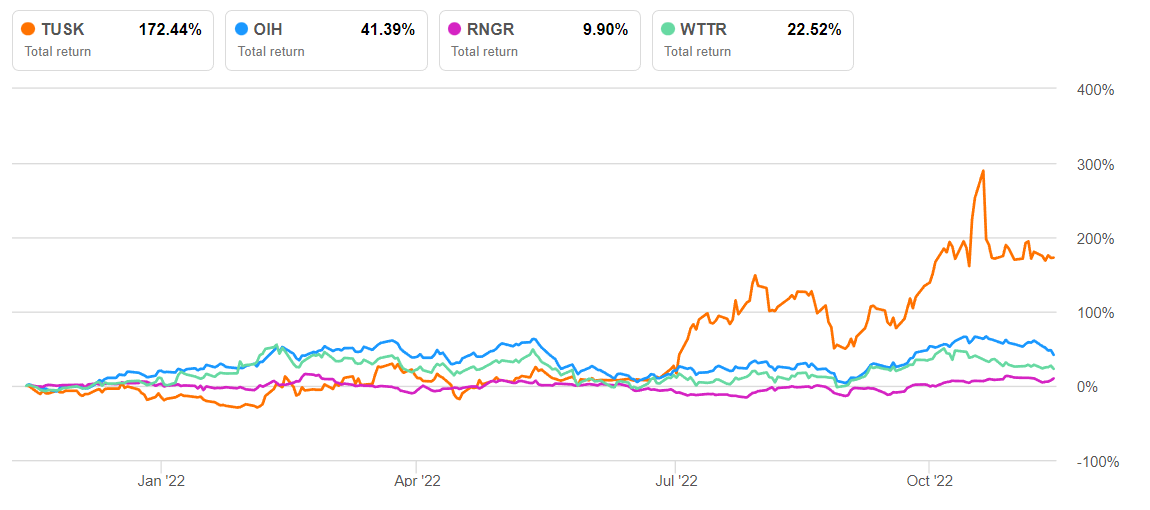
As the economy and energy industry faces uncertainty over the Ukraine war, global economic slowdown, or a possible recession, Mammoth Energy takes prudent measures. It held on to the number of frac fleets in Q3, although it disclosed to add a couple more by Q1 2023. The sand business faced a hurdle related to railroad logistics, adversely affecting volume. However, there were plenty of opportunities recently as hydraulic fracturing activity strengthened in the US. TUSK cashed in with its vertical integration model. A competitive advantage achieved through a wet sand pile can boost its pricing capability in the sand business. So, the stock outperformed the VanEck Vectors Oil Services ETF (OIH) in the past year.

Similarly, the company’s infrastructure will benefit from seasonal storm restoration services and overall infrastructure project opportunities. The company’s balance sheet is free from any immediate impending risks, although negative FCF can a concern. Given its reasonably well-placed relative valuation, investors might want to hold the stock in the short term.

Previous Post

Mammoth Energy Services Part 1: Pricing Gains Can Boost Profitability

Next Post

Year-Over-Year Oil Data (USA)

Related Posts

Halliburton’s Perspective in Q1: KEY Takeaways
Market Trends

Halliburton’s Perspective in Q1: KEY Takeaways

May 16, 2025
STEP Energy Services: Q1 TAKE THREE
Market Trends

STEP Energy Services: Q1 TAKE THREE

May 15, 2025
Market Sentiment Tracker: Demand Holds, Cracks Widen
Market Trends

Market Sentiment Tracker: Demand Holds, Cracks Widen

May 14, 2025
Monday Macro View: What is the connection between Frac Job Count and OPEC’s production? Enterprise Subscribers
Market Trends

Monday Macro View: What is the connection between Frac Job Count and OPEC’s production? Enterprise Subscribers

May 12, 2025
Liberty Energy’s Perspective in Q1: KEY Takeaways
Market Trends

Liberty Energy’s Perspective in Q1: KEY Takeaways

May 12, 2025
KLX Energy Services: Q1 TAKE THREE
Market Trends

KLX Energy Services: Q1 TAKE THREE

May 9, 2025
Next Post
Year-Over-Year Oil Data (USA)

Year-Over-Year Oil Data (USA)

Please login to join discussion

Recent News

Halliburton’s Perspective in Q1: KEY Takeaways

Halliburton’s Perspective in Q1: KEY Takeaways

May 16, 2025
STEP Energy Services: Q1 TAKE THREE

STEP Energy Services: Q1 TAKE THREE

May 15, 2025
FREE READ: Oil Markets Trying to find direction

FREE READ: Oil Markets Trying to find direction

May 14, 2025
Market Sentiment Tracker: Demand Holds, Cracks Widen

Market Sentiment Tracker: Demand Holds, Cracks Widen

May 14, 2025
Monday Macro View: What is the connection between Frac Job Count and OPEC’s production? Enterprise Subscribers

Monday Macro View: What is the connection between Frac Job Count and OPEC’s production? Enterprise Subscribers

May 12, 2025
Primary Vision

Established in 2011, we are renowned for our expert frac data and analytics, providing a rich array of unique indicators and industry commentary.

CONTACT

+1-713-554-4977
info@primaryvision.co

SOCIAL NETWORKS

POLICIES

Privacy Policy
Terms of Use

PARTNERS

Amazon Web Services

TRUSTED SITES

Logo

Logo

RECENT NEWS

Halliburton’s Perspective in Q1: KEY Takeaways

Halliburton’s Perspective in Q1: KEY Takeaways

May 16, 2025
STEP Energy Services: Q1 TAKE THREE

STEP Energy Services: Q1 TAKE THREE

May 15, 2025
FREE READ: Oil Markets Trying to find direction

FREE READ: Oil Markets Trying to find direction

May 14, 2025
Market Sentiment Tracker: Demand Holds, Cracks Widen

Market Sentiment Tracker: Demand Holds, Cracks Widen

May 14, 2025
Monday Macro View: What is the connection between Frac Job Count and OPEC’s production? Enterprise Subscribers

Monday Macro View: What is the connection between Frac Job Count and OPEC’s production? Enterprise Subscribers

May 12, 2025
  • HOME
  • ABOUT US
  • RESEARCH
  • EVENTS
  • PRESS
  • SUPPORT
  • FAQ
  • LATEST NEWS
  • LOGIN
  • SIGN UP!

© 2025 Primary Vision. All rights reserved.

  • HOME
  • ABOUT US
    • ABOUT US
    • PRIMARY VISION AI INNOVATIONS
  • RESEARCH
    • INSIGHTS & ARTICLES
    • FREE ARTICLES
  • EVENTS
  • PRESS
  • SUPPORT
  • FAQ
  • LATEST NEWS
  • LOGIN
  • SIGN UP!
    • FRAC SPREAD COUNT SIGN-UP!
    • ENTERPRISE SUBSCRIPTION PLAN SIGN UP!

© 2025 Primary Vision. All rights reserved.