Primary Vision
  • HOME
  • ABOUT US
    • ABOUT US
    • PRIMARY VISION AI INNOVATIONS
  • RESEARCH
    • INSIGHTS & ARTICLES
    • FREE ARTICLES
  • EVENTS
  • PRESS
  • SUPPORT
  • FAQ
  • LATEST NEWS
  • LOGIN
  • SIGN UP!
    • FRAC SPREAD COUNT SIGN-UP!
    • ENTERPRISE SUBSCRIPTION PLAN SIGN UP!
  • HOME
  • ABOUT US
    • ABOUT US
    • PRIMARY VISION AI INNOVATIONS
  • RESEARCH
    • INSIGHTS & ARTICLES
    • FREE ARTICLES
  • EVENTS
  • PRESS
  • SUPPORT
  • FAQ
  • LATEST NEWS
  • LOGIN
  • SIGN UP!
    • FRAC SPREAD COUNT SIGN-UP!
    • ENTERPRISE SUBSCRIPTION PLAN SIGN UP!
No Result
View All Result
Primary Vision
Home Market Trends

Calfrac Well Services Part 2: Estimates And Relative Valuation

Avik Chowdhury by Avik Chowdhury
January 4, 2023
in Market Trends
0

  • Our revenue estimates suggest a moderate revenue rise in the following two years.
  • EBITDA can increase significantly in NTM 2023 and decelerate afterward.
  • The stock is relatively undervalued versus its peers.

Part 1 of this article discussed Calfrac’s (CFWFF) outlook, performance, and financial condition. In this part, we will discuss more.

Linear Regression Based Revenue Forecast

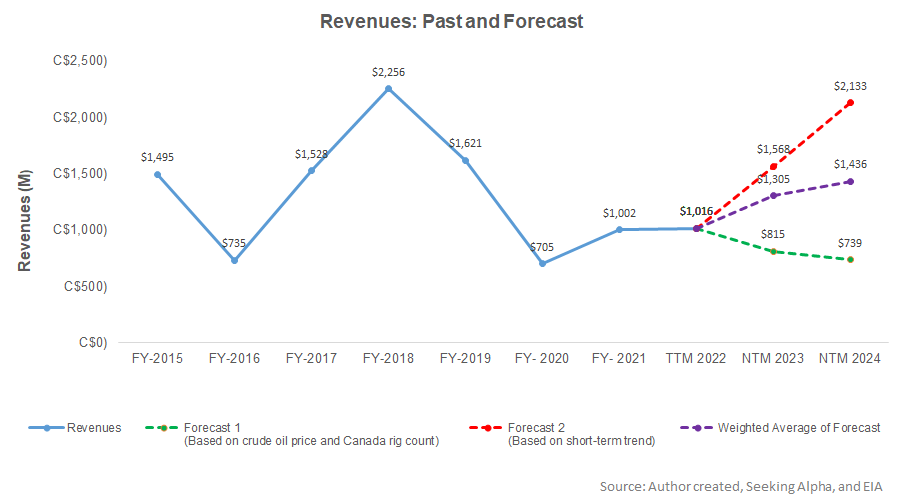
Based on a regression equation between the key industry indicators (crude oil price and Canada rig count) and Calfrac’s reported revenues for the past seven years and the previous four quarters, its revenues are likely to increase by 28% in the next 12 months (or NTM 2023) and by 10% in NTM 2024.

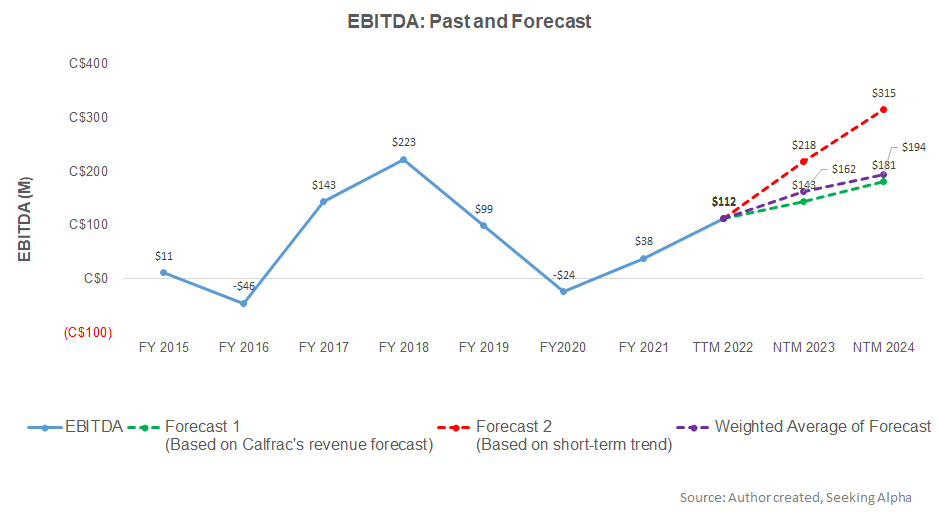
Based on the same regression models and the forecast revenues, I expect the company’s EBITDA to increase substantially (195%) in the next 12 months (or NTM) in 2023. The model suggests that the EBITDA growth rate will slow to 45% in NTM 2024.

Target Price And Relative Valuation

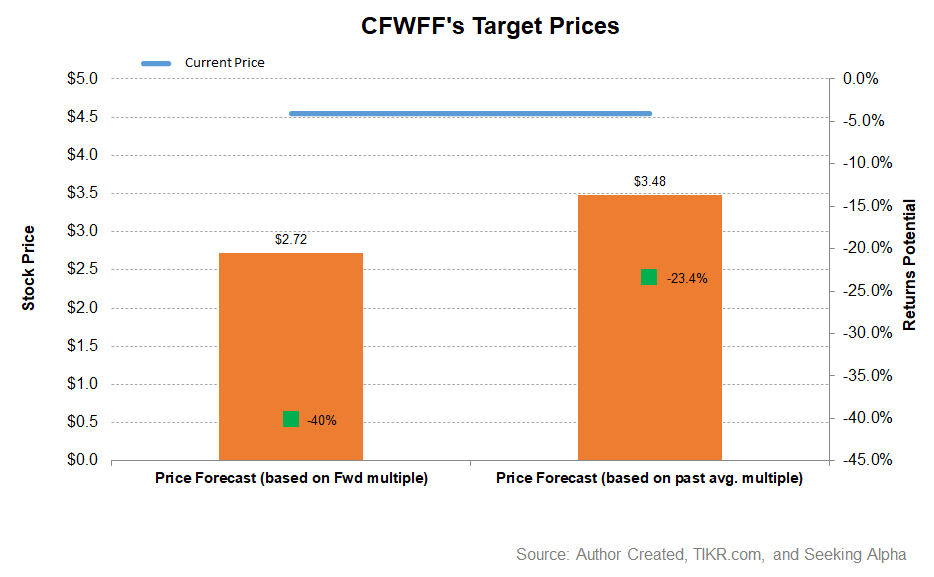
Based on revenues and EBITDA estimates derived from the model, the returns potential using the past average EV/EBITDA multiple (6.0x) is higher (23% downside) than the returns potential using the forward EV/EBITDA multiple (40% downside).

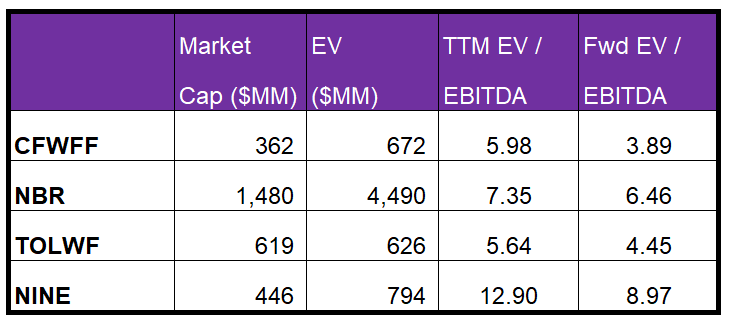
Calfrac’s forward EV-to-EBITDA multiple contraction versus the adjusted EV/EBITDA is steeper than its peers because its EBITDA is expected to increase more sharply in the next year. This should typically result in a higher EV/EBITDA multiple than its peers. However, the company’s EV/EBITDA multiple (6x) is lower than its peers’ (NBR, TOLWF, and NINE) average of 8.6x. The stock is relatively undervalued versus its peers.

What’s The Take On Calfrac?

The positive momentum in the oilfield services industry can carry on in 2023. Calfrac is optimizing the fracturing schedule for its operating crews, which resulted in the average adjusted EBITDA per fleet more than tripling in the past year. It also plans to reactivate the 10th pressure pumping fleet in Q4. In Canada, it is evaluating equipment expansion options to activate additional fleets. So, the stock outperformed the VanEck Vectors Oil Services ETF (OIH) in the past year.

Although it deleveraged in recent months, its liquidity is not robust. However, its cash flow from operations turned positive in 9M 2022, resulting in a considerable improvement in FCF. Relative valuation-wise, the stock is undervalued versus its peers. Although the near-term returns from the stock look shaky, considering the valuation angle, investors can hold it with the prospect of higher returns in the medium to long term.

To unlock the content you need a
Premium
or Enterprise
Account!

Previous Post

Calfrac Well Services Part 1: Margin Expansion And Cash Flow Improvement Propel

Next Post

Primary Vision Insights – Premium Subscribers

Related Posts

Halliburton’s Perspective in Q1: KEY Takeaways
Market Trends

Halliburton’s Perspective in Q1: KEY Takeaways

May 16, 2025
STEP Energy Services: Q1 TAKE THREE
Market Trends

STEP Energy Services: Q1 TAKE THREE

May 15, 2025
Market Sentiment Tracker: Demand Holds, Cracks Widen
Market Trends

Market Sentiment Tracker: Demand Holds, Cracks Widen

May 14, 2025
Monday Macro View: What is the connection between Frac Job Count and OPEC’s production? Enterprise Subscribers
Market Trends

Monday Macro View: What is the connection between Frac Job Count and OPEC’s production? Enterprise Subscribers

May 12, 2025
Liberty Energy’s Perspective in Q1: KEY Takeaways
Market Trends

Liberty Energy’s Perspective in Q1: KEY Takeaways

May 12, 2025
KLX Energy Services: Q1 TAKE THREE
Market Trends

KLX Energy Services: Q1 TAKE THREE

May 9, 2025
Next Post
Primary Vision Insights – Premium Subscribers

Primary Vision Insights - Premium Subscribers

Please login to join discussion

Recent News

Halliburton’s Perspective in Q1: KEY Takeaways

Halliburton’s Perspective in Q1: KEY Takeaways

May 16, 2025
STEP Energy Services: Q1 TAKE THREE

STEP Energy Services: Q1 TAKE THREE

May 15, 2025
FREE READ: Oil Markets Trying to find direction

FREE READ: Oil Markets Trying to find direction

May 14, 2025
Market Sentiment Tracker: Demand Holds, Cracks Widen

Market Sentiment Tracker: Demand Holds, Cracks Widen

May 14, 2025
Monday Macro View: What is the connection between Frac Job Count and OPEC’s production? Enterprise Subscribers

Monday Macro View: What is the connection between Frac Job Count and OPEC’s production? Enterprise Subscribers

May 12, 2025
Primary Vision

Established in 2011, we are renowned for our expert frac data and analytics, providing a rich array of unique indicators and industry commentary.

CONTACT

+1-713-554-4977
info@primaryvision.co

SOCIAL NETWORKS

POLICIES

Privacy Policy
Terms of Use

PARTNERS

Amazon Web Services

TRUSTED SITES

Logo

Logo

RECENT NEWS

Halliburton’s Perspective in Q1: KEY Takeaways

Halliburton’s Perspective in Q1: KEY Takeaways

May 16, 2025
STEP Energy Services: Q1 TAKE THREE

STEP Energy Services: Q1 TAKE THREE

May 15, 2025
FREE READ: Oil Markets Trying to find direction

FREE READ: Oil Markets Trying to find direction

May 14, 2025
Market Sentiment Tracker: Demand Holds, Cracks Widen

Market Sentiment Tracker: Demand Holds, Cracks Widen

May 14, 2025
Monday Macro View: What is the connection between Frac Job Count and OPEC’s production? Enterprise Subscribers

Monday Macro View: What is the connection between Frac Job Count and OPEC’s production? Enterprise Subscribers

May 12, 2025
  • HOME
  • ABOUT US
  • RESEARCH
  • EVENTS
  • PRESS
  • SUPPORT
  • FAQ
  • LATEST NEWS
  • LOGIN
  • SIGN UP!

© 2025 Primary Vision. All rights reserved.

  • HOME
  • ABOUT US
    • ABOUT US
    • PRIMARY VISION AI INNOVATIONS
  • RESEARCH
    • INSIGHTS & ARTICLES
    • FREE ARTICLES
  • EVENTS
  • PRESS
  • SUPPORT
  • FAQ
  • LATEST NEWS
  • LOGIN
  • SIGN UP!
    • FRAC SPREAD COUNT SIGN-UP!
    • ENTERPRISE SUBSCRIPTION PLAN SIGN UP!

© 2025 Primary Vision. All rights reserved.