- Multi-pad drilling and LNG production growth will likely carry the topline and margin momentum in 2023.
- Its revenue growth from the US coiled tubing operations was steep in Q3.
- The company’s cash flows from operations surged, while free cash flows turned around in 9M 2022.
- It has reduced its debt balance significantly since 2018.
Explaining Strategy And Key Drivers
In Canada, the energy operators are increasing their E&P budgets while completion activity related to the LNG Canada project ramps up. Some operators will load their completion budgets by Q2 2023. Higher demand strengthens pricing, and STEP will take advantage of the improved pricing following its decision to activate the ninth coiled tubing unit in Q4. In Q3, the company had eight active coiled tubing units spread across Alberta and northeast British Columbia in Canada. The fleet size has remained unchanged since Q2. In the US, the company’s fleet size increased to 11 in Q3 from 8 in Q2, spread across the Permian, the Eagle, the Bakken, and the Uinta-Piceance and Niobrara-DJ basins.
In the US, the fracturing market remains tight, primarily because of the short supply of equipment. There is a growing focus on efficiency gains, including multi-pad drilling, which should bring in a favorable mix of business in Q4. LNG production has received a shot in the arm following the Ukraine war. STEP’s recent acquisition of the deep coiled tubing in the Southern US will give it further exposure to the natural gas market. It plans to increase natural gas deliveries into LNG Canada and other smaller LNG projects in Canada. It has devised a strategy to form a strategic partnership with the global pressure pumping company to help upgrade pressure pumps with dynamic gas blending, or DGB, engine technology.
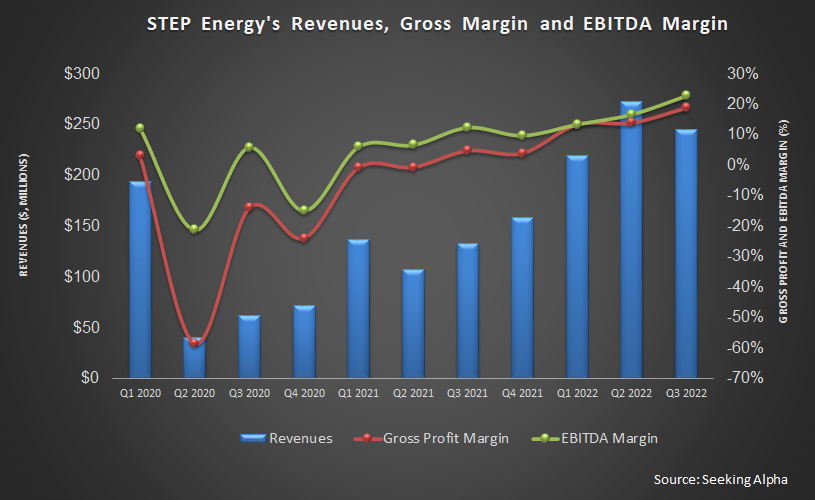
The other key driver for STEP is its focus on North American coiled tubing operation. Revenue growth from the US coiled tubing operations was the steepest among its service lines in Q3, aided by the topline contribution from the recent acquisition. The company’s financial results also benefited from the US dollar’s appreciation because it is denominated into the Canadian dollar. The company’s cross-border business model will facilitate margin growth. In Q3 2022, its gross margin and adjusted EBITDA margin expanded by 490 basis points and 610 basis points, respectively, compared to Q2.
Industry Activity
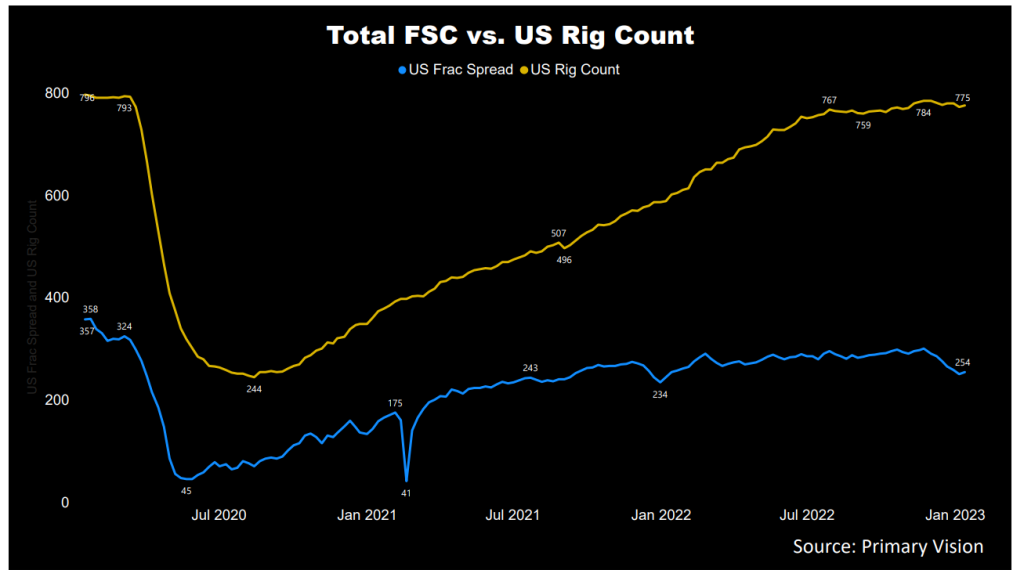
The US rig count has increased by 32% in the past year, although it remained somewhat volatile in Q4 2021. The crude oil price curve gave up much of the gains late in 2022. As estimated by Primary Vision, the frac spread count has lagged behind the rig count’s growth, clocking just 8.5% growth.
The Q3 Drivers And Segment Performance
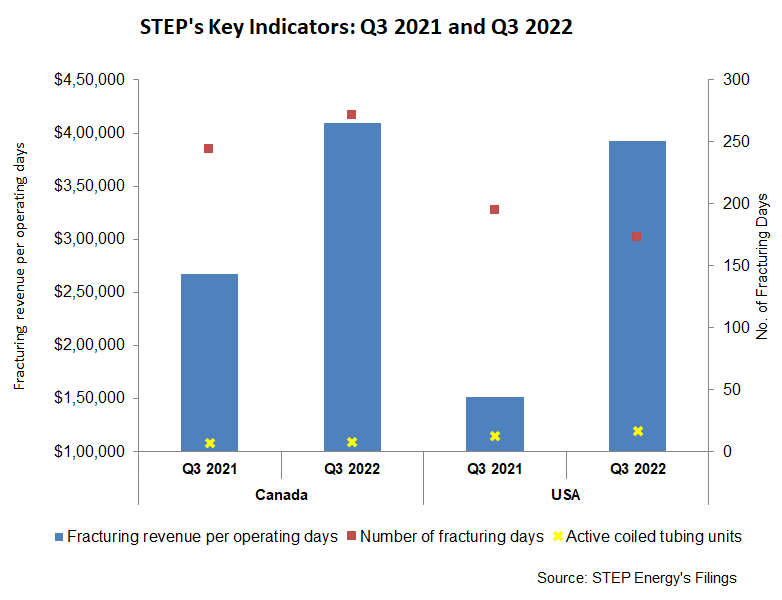
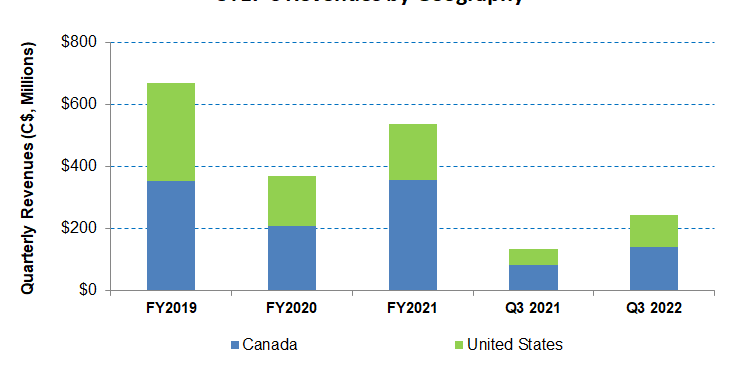
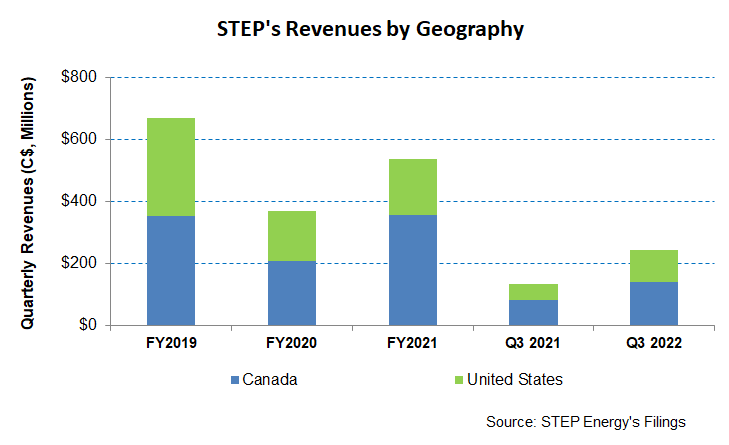
Revenues from STEP’s Canada and US regions in fracturing and Coiled tubing increased in Q3 2022. Year-over-year, revenues in Canada increased by 69% in Q3. The company’s fracturing jobs in Canada gradually shift to smaller pad works. Although total revenues from this job are low, internal operational efficiencies and pricing improvements led to better operating margins in Q3. So, its adjusted EBITDA margin expanded by 800 basis points in Q3. In coiled tubing, ramp-up from spring break up led to a 20% rise in revenues from this operation in Canada.
Year-over-year, revenues in the US more than doubled in Q3 2022. Its revenues from fracturing operations were relatively low in Q3 because of lower utilization due to planned maintenance days. However, revenues from Coiled tubing in the US increased more than in Canada (40% up) due to robust utilization and pricing in the US market. The acquisition in September also boosted the topline. Higher revenues and more robust pricing led to a 120-basis point expansion in the adjusted EBITDA margin in the US.
Cash Flows And Debt
STEP’s cash flow from operations (or CFO) increased by more than 300% in 9M 2022 compared to a year ago, led by significantly higher revenues in the past year. Although capex increased, free cash flow turned positive. Improved cash flow enabled the company to reduce leverage. As of September 30, 2022, STEP’s debt-to-equity (0.53x) is moderate compared to its peers. Its reduced net debt to $148 million earlier than anticipated. It has shed $160 million from its debt balance since 2018.
Learn about STEP’s revenue and EBITDA estimates, relative valuation, and target price in Part 2 of the article.

