Primary Vision
  • HOME
  • ABOUT US
    • ABOUT US
    • PRIMARY VISION AI INNOVATIONS
  • RESEARCH
    • INSIGHTS & ARTICLES
    • FREE ARTICLES
  • EVENTS
  • PRESS
  • SUPPORT
  • FAQ
  • LATEST NEWS
  • LOGIN
  • SIGN UP!
    • FRAC SPREAD COUNT SIGN-UP!
    • ENTERPRISE SUBSCRIPTION PLAN SIGN UP!
  • HOME
  • ABOUT US
    • ABOUT US
    • PRIMARY VISION AI INNOVATIONS
  • RESEARCH
    • INSIGHTS & ARTICLES
    • FREE ARTICLES
  • EVENTS
  • PRESS
  • SUPPORT
  • FAQ
  • LATEST NEWS
  • LOGIN
  • SIGN UP!
    • FRAC SPREAD COUNT SIGN-UP!
    • ENTERPRISE SUBSCRIPTION PLAN SIGN UP!
No Result
View All Result
Primary Vision
Home Market Trends

Baker Hughes Part 2: Estimates And Relative Valuation

Avik Chowdhury by Avik Chowdhury
January 25, 2023
in Market Trends
0

  • Our regression model suggests a decelerating revenue trend in the next two years.
  • EBITDA can increase sharply in NTM 2023 but can stagnate in NTM 2024.
  • The stock is mildly overvalued at the current level.

Part 1 of this article discussed Baker Hughes’s (BKR) outlook, performance, and financial condition. In this part, we will discuss more.

Linear Regression Based Forecast

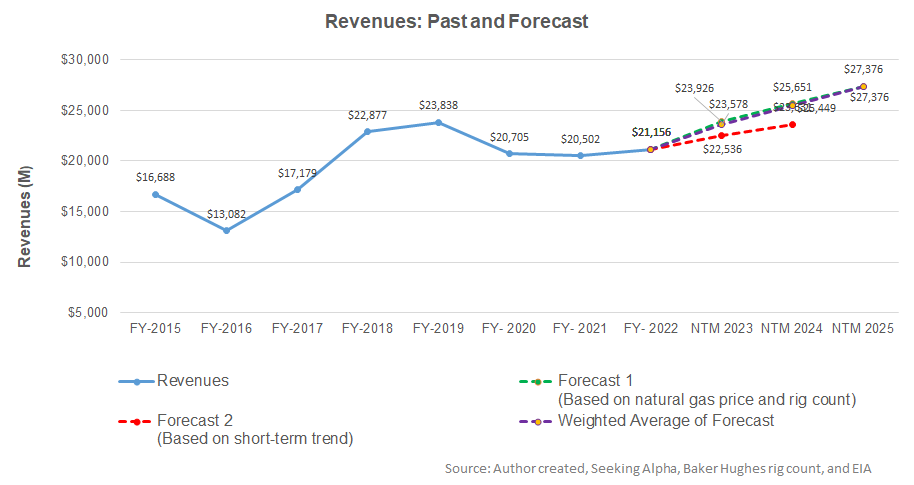
Based on a regression equation among the natural gas price, global rig count, and BKR’s reported revenues for the past seven years and the previous eight-quarters, revenues will increase by 11% in the next 12 months (or NTM 2023) and further by 7.9% in NTM 2024, before reaching a 7.6% growth rate in NTM 2025. For the short-term trend, we have also considered seasonality.

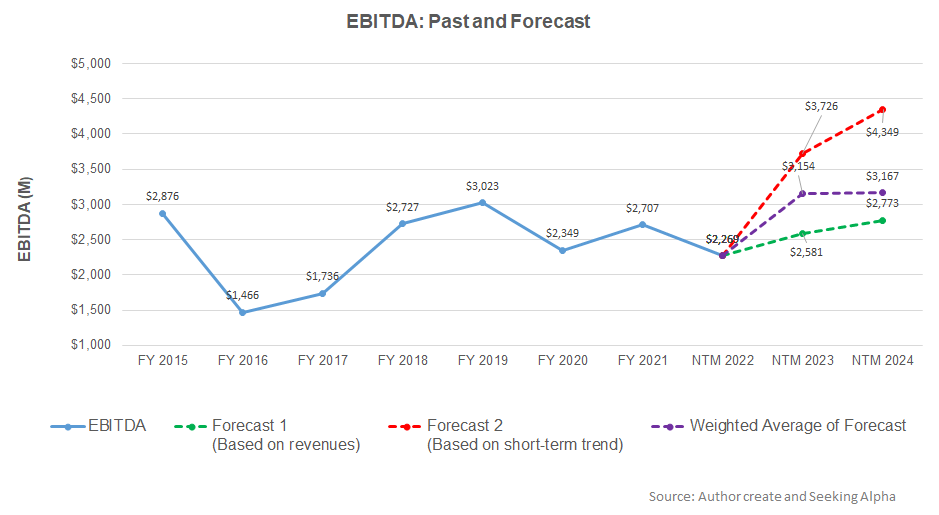
Based on the regression model using the average forecast revenues, the company’s EBITDA is expected to increase by 39% in NTM 2023. However, in NTM 2024, it can remain unchanged.

Target Price And Relative Valuation

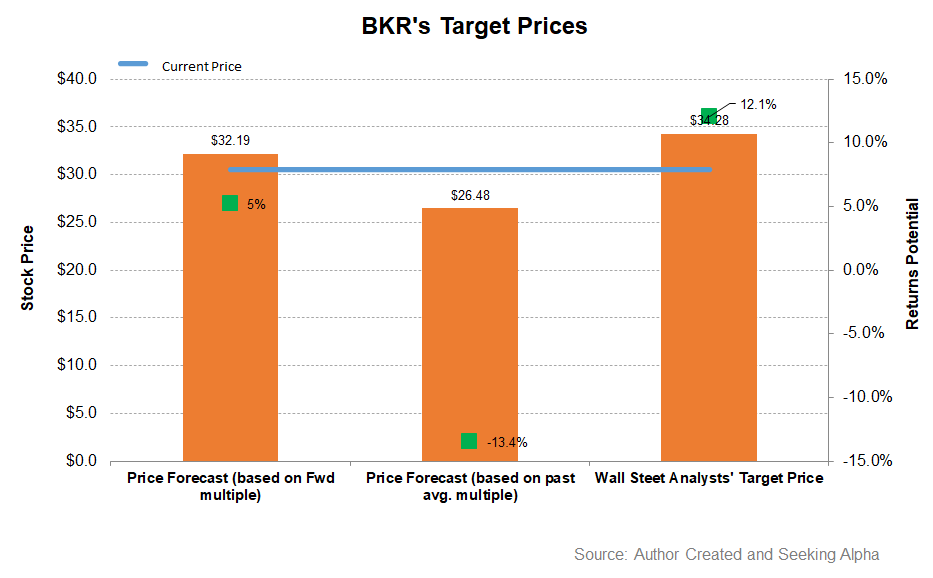
Returns potential using BKR’s forward EV/EBITDA multiple (11.6x) is lower (5% upside) compared to returns potential using the past average multiple (13% upside). The Wall Street analysts have higher return expectations (12% upside).

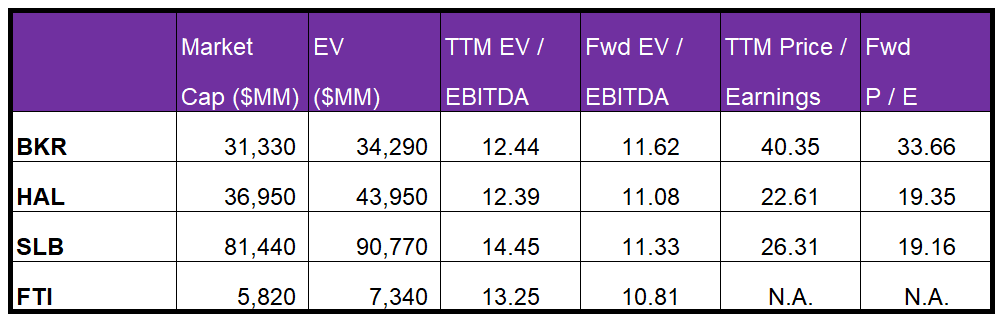
Baker Hughes is currently trading at an EV-to-adjusted EBITDA multiple of 12.4x. Based on sell-side analysts’ EBITDA estimates, the forward EV/EBITDA multiple is 11.6x. The current multiple is lower than the past five-year average EV/EBITDA multiple of 11.4x.

BKR’s forward EV-to-EBITDA multiple contraction versus the current EV/EBITDA is less steep than peers because the company’s EBITDA is expected to increase less sharply in the next four quarters. This would typically result in a lower EV/EBITDA multiple than peers. The stock’s EV/EBITDA multiple is marginally lower than its peers’ (HAL, SLB, and FTI) average. So, the stock is mildly overvalued versus its peers.

Analyst Rating

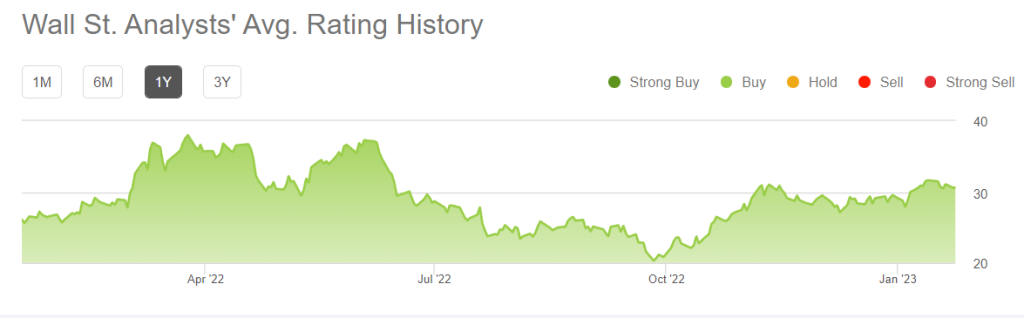
According to data provided by Seeking Alpha, 20 sell-side analysts rated BKR a “Buy” or “Strong Buy” in the past 90 days, while five of them rated it a “Hold.” None of the sell-side analysts rated a “Sell.” The consensus target price is $34.3, which yields 12% returns at the current price.

What’s The Take On BKR?

While the new FIDs and order bookings in LNG remain consistently high, BKR will gain the most in its Industrial & Energy Technology segment from new orders. The pipeline of new orders lies in LNG, onshore/offshore, and new energy. The new energy has recently booked an order in Malaysia to supply CO2 compression equipment. Along with the topline growth, it has restructured the business in recent times, which can reduce operating costs by $150 million in 2023. Over the next two to three years, it aims to achieve an EBITDA margin target of 20%.

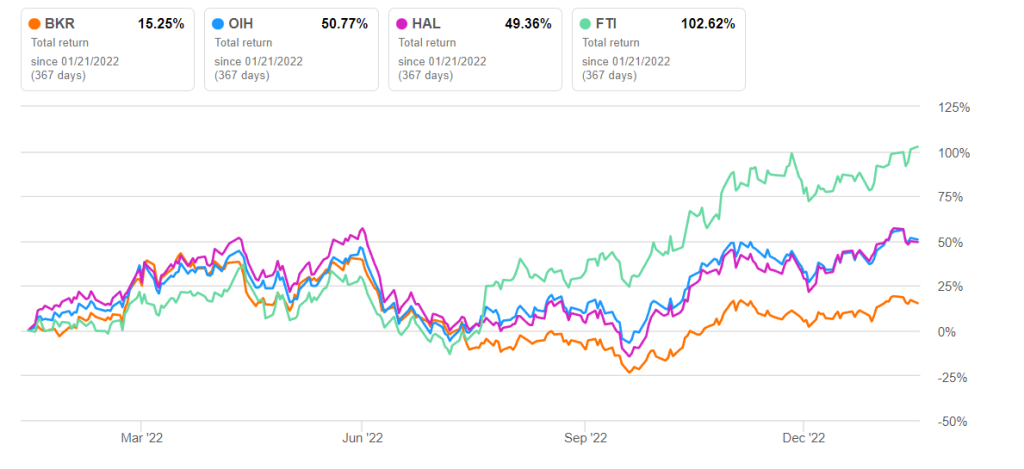
However, the lack of new orders in the Oilfield Services & Equipment segment and the global economic recession are causes of worries for BKR. The drop in cash flow is also something investors need to watch out for. The stock is reasonably valued, with a mild negative bias, versus its peers. So, the stock underperformed the VanEck Vectors Oil Services ETF (OIH) in the past year. The balance sheet is relatively robust due to low leverage, while the management expects to return 60%-80% of FCF to shareholders through dividends and share buybacks. Investors might want to “hold” the stock for steady returns in the long term.

To unlock the content you need a
Premium
or Enterprise
Account!

Previous Post

Baker Hughes Part 1: LNG Projects And Operating Profit Growth To Drive BKR

Next Post

Halliburton Part 1: Growth Opportunities Would Push Back The Short-Term Margin Concerns

Related Posts

Market Sentiment Tracker: Is the U.S. Economy Quietly Rebounding?
Market Trends

Market Sentiment Tracker: Is the U.S. Economy Quietly Rebounding?

June 3, 2025
Monday Macro View: Electric Fleets Keep Expanding, Even as Completions Slow
Market Trends

Monday Macro View: Electric Fleets Keep Expanding, Even as Completions Slow

June 2, 2025
Patterson UTI’s Perspective in Q1: KEY Takeaways
Market Trends

Patterson UTI’s Perspective in Q1: KEY Takeaways

June 2, 2025
Market Sentiment Tracker: Credit Card Delinquencies Hit 14-Year High
Market Trends

Market Sentiment Tracker: Credit Card Delinquencies Hit 14-Year High

May 27, 2025
Monday Macro View: Is U.S. Shale Activity About to Slow Down
Market Trends

Monday Macro View: Is U.S. Shale Activity About to Slow Down

May 26, 2025
RPC’s Perspective in Q1: KEY Takeaways
Market Trends

RPC’s Perspective in Q1: KEY Takeaways

May 26, 2025
Next Post
Halliburton Part 1: Growth Opportunities Would Push Back The Short-Term Margin Concerns

Halliburton Part 1: Growth Opportunities Would Push Back The Short-Term Margin Concerns

Please login to join discussion

Recent News

Market Sentiment Tracker: Is the U.S. Economy Quietly Rebounding?

Market Sentiment Tracker: Is the U.S. Economy Quietly Rebounding?

June 3, 2025
Monday Macro View: Electric Fleets Keep Expanding, Even as Completions Slow

Monday Macro View: Electric Fleets Keep Expanding, Even as Completions Slow

June 2, 2025
Patterson UTI’s Perspective in Q1: KEY Takeaways

Patterson UTI’s Perspective in Q1: KEY Takeaways

June 2, 2025
Market Sentiment Tracker: Credit Card Delinquencies Hit 14-Year High

Market Sentiment Tracker: Credit Card Delinquencies Hit 14-Year High

May 27, 2025
Monday Macro View: Is U.S. Shale Activity About to Slow Down

Monday Macro View: Is U.S. Shale Activity About to Slow Down

May 26, 2025
Primary Vision

Established in 2011, we are renowned for our expert frac data and analytics, providing a rich array of unique indicators and industry commentary.

CONTACT

+1-713-554-4977
info@primaryvision.co

SOCIAL NETWORKS

POLICIES

Privacy Policy
Terms of Use

PARTNERS

Amazon Web Services

TRUSTED SITES

Logo

Logo

RECENT NEWS

Market Sentiment Tracker: Is the U.S. Economy Quietly Rebounding?

Market Sentiment Tracker: Is the U.S. Economy Quietly Rebounding?

June 3, 2025
Monday Macro View: Electric Fleets Keep Expanding, Even as Completions Slow

Monday Macro View: Electric Fleets Keep Expanding, Even as Completions Slow

June 2, 2025
Patterson UTI’s Perspective in Q1: KEY Takeaways

Patterson UTI’s Perspective in Q1: KEY Takeaways

June 2, 2025
Market Sentiment Tracker: Credit Card Delinquencies Hit 14-Year High

Market Sentiment Tracker: Credit Card Delinquencies Hit 14-Year High

May 27, 2025
Monday Macro View: Is U.S. Shale Activity About to Slow Down

Monday Macro View: Is U.S. Shale Activity About to Slow Down

May 26, 2025
  • HOME
  • ABOUT US
  • RESEARCH
  • EVENTS
  • PRESS
  • SUPPORT
  • FAQ
  • LATEST NEWS
  • LOGIN
  • SIGN UP!

© 2025 Primary Vision. All rights reserved.

  • HOME
  • ABOUT US
    • ABOUT US
    • PRIMARY VISION AI INNOVATIONS
  • RESEARCH
    • INSIGHTS & ARTICLES
    • FREE ARTICLES
  • EVENTS
  • PRESS
  • SUPPORT
  • FAQ
  • LATEST NEWS
  • LOGIN
  • SIGN UP!
    • FRAC SPREAD COUNT SIGN-UP!
    • ENTERPRISE SUBSCRIPTION PLAN SIGN UP!

© 2025 Primary Vision. All rights reserved.