Primary Vision
  • HOME
  • ABOUT US
    • ABOUT US
    • PRIMARY VISION AI INNOVATIONS
  • RESEARCH
    • INSIGHTS & ARTICLES
    • FREE ARTICLES
  • EVENTS
  • PRESS
  • SUPPORT
  • FAQ
  • LATEST NEWS
  • LOGIN
  • SIGN UP!
    • FRAC SPREAD COUNT SIGN-UP!
    • ENTERPRISE SUBSCRIPTION PLAN SIGN UP!
  • HOME
  • ABOUT US
    • ABOUT US
    • PRIMARY VISION AI INNOVATIONS
  • RESEARCH
    • INSIGHTS & ARTICLES
    • FREE ARTICLES
  • EVENTS
  • PRESS
  • SUPPORT
  • FAQ
  • LATEST NEWS
  • LOGIN
  • SIGN UP!
    • FRAC SPREAD COUNT SIGN-UP!
    • ENTERPRISE SUBSCRIPTION PLAN SIGN UP!
No Result
View All Result
Primary Vision
Home Market Trends

NOV Part 2: Estimates And Relative Valuation

Avik Chowdhury by Avik Chowdhury
February 12, 2023
in Market Trends
0

  • Our regression model suggests a steady revenue growth in NTM 2023, but the rate can plateau in NTM 2024 and then decline in NTM 2025.
  • The EBITDA growth rate will stay steady over the next two years.
  • The relative multiples indicate the stock is reasonably valued at this level.

Part 1 of this article discussed the NOV’s (NOV) outlook, performance, and financial condition. In this part, we will discuss more.

Linear Regression Based Revenue Forecast

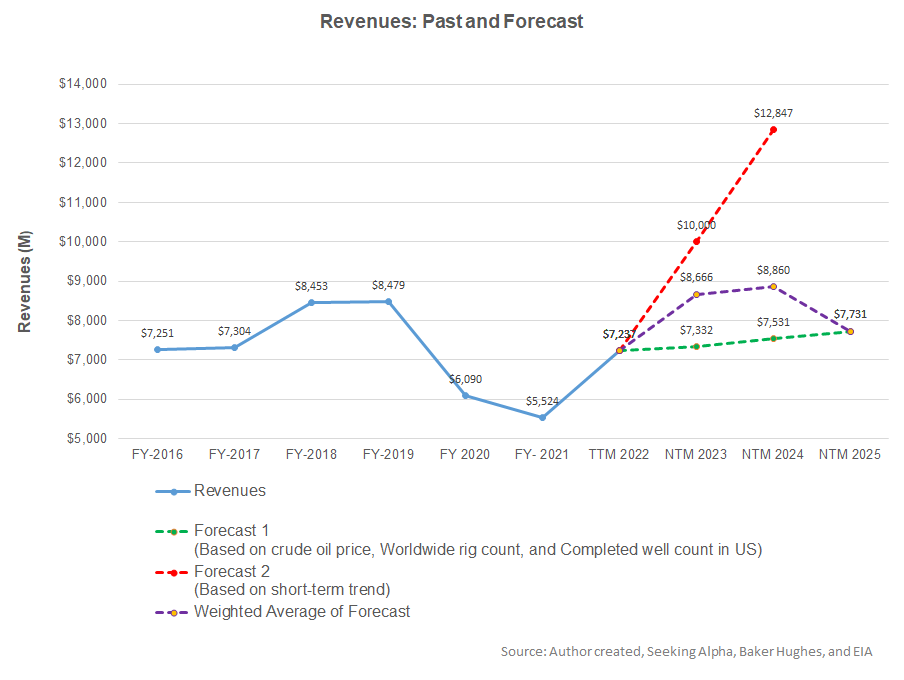
Our model is based on a regression equation between the key industry indicators (crude oil price, the global rig count, and the US completed well count) and NOV’s reported revenues for the past eight years and the previous four quarters. The model suggests that NOV’s revenues will increase by 20% in the next 12 months (or NTM) in 2023. The growth rate can decelerate to a mere 2% in NTM 2024 and decline by 13% in NTM 2025. For the short-term trend, we have also considered seasonality.

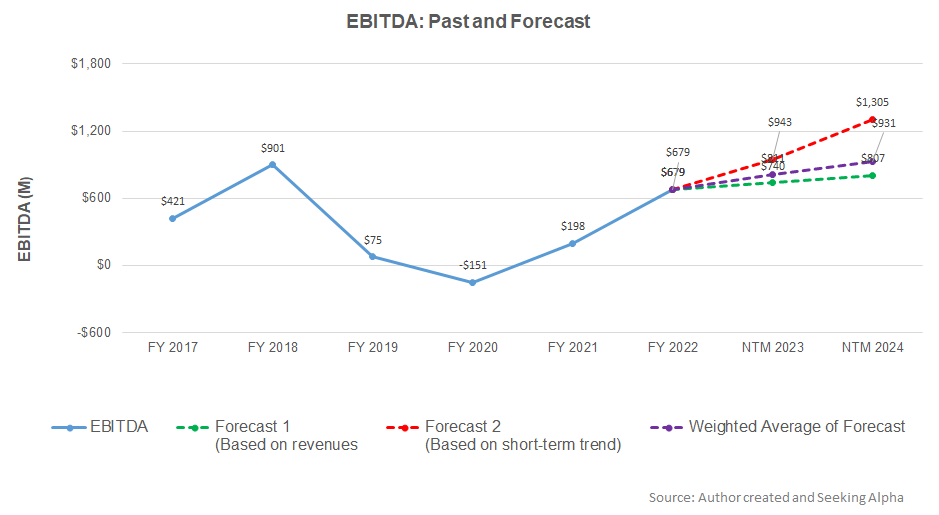
Based on the same regression models and the forecast revenues, I expect the company’s EBITDA to increase by 19% in NTM 2023. In NTM 2024, it can rise further by 15%.

Target Price

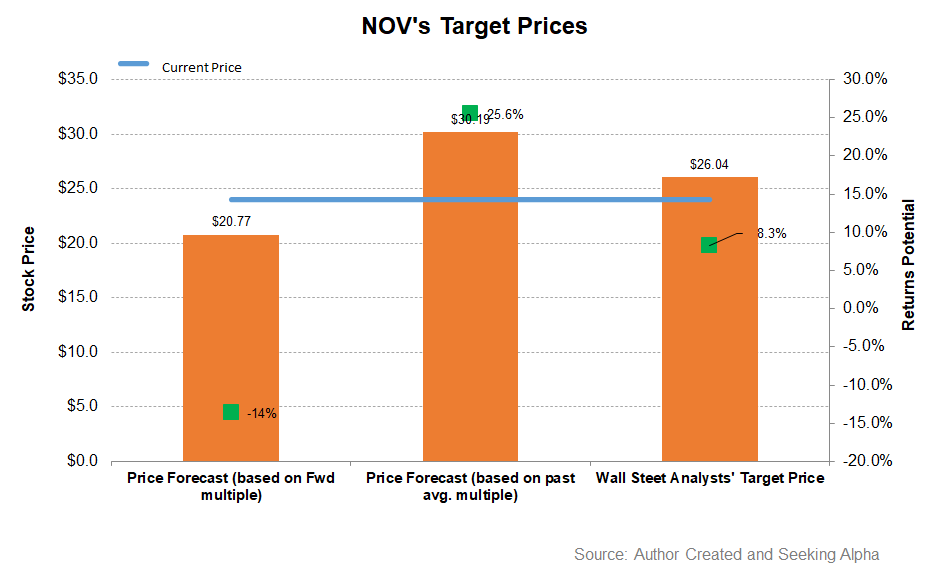
Returns potential using the forward EV/EBITDA multiple (10.9x) is lower (14% downside) than the returns potential (25.6% upside) using the past average EV/ EBITDA multiple (35.4x). The sell-side analysts’ expected returns (8% upside) from the stock are lower.

What Does The Relative Valuation Imply?

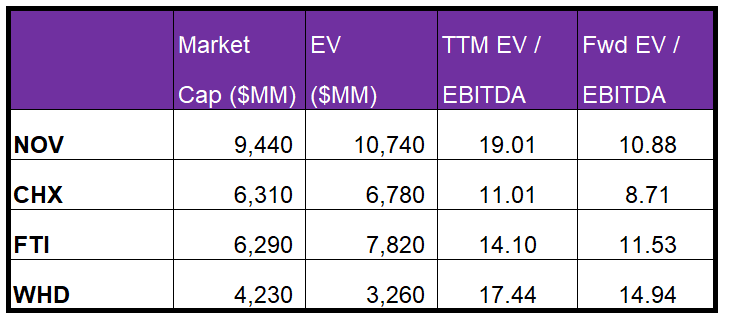
NOV’s current EV/EBITDA multiple is lower than the past five-year average EV/EBITDA multiple of 35x. So, it is currently trading at a discount to its past average.

NOV’s EV/EBITDA multiple is higher than its peers’ (CHX, FTI, and WHD) average of 14.2x. Because NOV’s forward EV/EBITDA multiple contraction is steeper than its peers, it typically reflects in a higher EV/EBITDA multiple than its peers. So, the stock is reasonably valued versus its peers at the current level.

Analyst Rating And Target Price

According to data provided by Seeking Alpha, 16 sell-side analysts rated NOV a “buy” in the past 90 days (including “Strong Buy”), while eight of the analysts rated it a “hold.” Only one analyst rated it a “sell.” The consensus target price is $26.0, suggesting an 8% upside at the current price.

What’s The Take On NOV?

At the start of 2023, NOV’s management underlined the long-term bullish outlook in the energy sector, as did many of its counterparts in the oilfield services industry. The company highlights development activities in Brazil, West Africa, and Guyana, as shallow water activity in Mexico, the Arabian Gulf, and India. It also expects brownfield tiebacks in the Gulf of Mexico and the North Sea. The Middle East and Argentina have also started adopting advanced technology, like converting traditional drilling fleets to higher capability AC rigs and fit-for-purpose frac spreads. As the day rate in the US and the company’s book-to-bill ratio improved, the stock outperformed the VanEck Vectors Oil Services ETF (OIH) in the past year.

However, investors should note that reactivating the offshore industry will be full of challenges. Demand for new builds and project executions can take time. The operating cost headwinds can shave its margin in the near term. Also, discounts extended earlier would be sticky to overcome through pricing hikes. Its cash flows were negative in FY2022, although the company expects cash flows to turn around in FY2023. The stock is reasonably valued relative to its peers. Investors might want to hold it because the positive momentum should offset the near-term obstacles.

To unlock the content you need a
Premium
or Enterprise
Account!

Previous Post

NOV Part 1: The Short-Term Headwinds Fade Into Offshore Growth Opportunities

Next Post

Nabors Industries Part 1: Rig Additions In Saudi Arabia To Counter Natural Gas’s Weaknesses  

Related Posts

STEP Energy Services: Q1 TAKE THREE
Market Trends

STEP Energy Services: Q1 TAKE THREE

May 15, 2025
Market Sentiment Tracker: Demand Holds, Cracks Widen
Market Trends

Market Sentiment Tracker: Demand Holds, Cracks Widen

May 14, 2025
MMV: What is the connection between Frac Job Count and OPEC’s production? Enterprise Subscribers
Market Trends

MMV: What is the connection between Frac Job Count and OPEC’s production? Enterprise Subscribers

May 12, 2025
Liberty Energy’s Perspective in Q1: KEY Takeaways
Market Trends

Liberty Energy’s Perspective in Q1: KEY Takeaways

May 12, 2025
KLX Energy Services: Q1 TAKE THREE
Market Trends

KLX Energy Services: Q1 TAKE THREE

May 9, 2025
Nine Energy Service: Q1 TAKE THREE
Market Trends

Nine Energy Service: Q1 TAKE THREE

May 8, 2025
Next Post
Nabors Industries Part 1: Rig Additions In Saudi Arabia To Counter Natural Gas’s Weaknesses  

Nabors Industries Part 1: Rig Additions In Saudi Arabia To Counter Natural Gas’s Weaknesses  

Please login to join discussion

Recent News

STEP Energy Services: Q1 TAKE THREE

STEP Energy Services: Q1 TAKE THREE

May 15, 2025
FREE READ: Oil Markets Trying to find direction

FREE READ: Oil Markets Trying to find direction

May 14, 2025
Market Sentiment Tracker: Demand Holds, Cracks Widen

Market Sentiment Tracker: Demand Holds, Cracks Widen

May 14, 2025
MMV: What is the connection between Frac Job Count and OPEC’s production? Enterprise Subscribers

MMV: What is the connection between Frac Job Count and OPEC’s production? Enterprise Subscribers

May 12, 2025
Liberty Energy’s Perspective in Q1: KEY Takeaways

Liberty Energy’s Perspective in Q1: KEY Takeaways

May 12, 2025
Primary Vision

Established in 2011, we are renowned for our expert frac data and analytics, providing a rich array of unique indicators and industry commentary.

CONTACT

+1-713-554-4977
info@primaryvision.co

SOCIAL NETWORKS

POLICIES

Privacy Policy
Terms of Use

PARTNERS

Amazon Web Services

TRUSTED SITES

Logo

Logo

RECENT NEWS

STEP Energy Services: Q1 TAKE THREE

STEP Energy Services: Q1 TAKE THREE

May 15, 2025
FREE READ: Oil Markets Trying to find direction

FREE READ: Oil Markets Trying to find direction

May 14, 2025
Market Sentiment Tracker: Demand Holds, Cracks Widen

Market Sentiment Tracker: Demand Holds, Cracks Widen

May 14, 2025
MMV: What is the connection between Frac Job Count and OPEC’s production? Enterprise Subscribers

MMV: What is the connection between Frac Job Count and OPEC’s production? Enterprise Subscribers

May 12, 2025
Liberty Energy’s Perspective in Q1: KEY Takeaways

Liberty Energy’s Perspective in Q1: KEY Takeaways

May 12, 2025
  • HOME
  • ABOUT US
  • RESEARCH
  • EVENTS
  • PRESS
  • SUPPORT
  • FAQ
  • LATEST NEWS
  • LOGIN
  • SIGN UP!

© 2025 Primary Vision. All rights reserved.

  • HOME
  • ABOUT US
    • ABOUT US
    • PRIMARY VISION AI INNOVATIONS
  • RESEARCH
    • INSIGHTS & ARTICLES
    • FREE ARTICLES
  • EVENTS
  • PRESS
  • SUPPORT
  • FAQ
  • LATEST NEWS
  • LOGIN
  • SIGN UP!
    • FRAC SPREAD COUNT SIGN-UP!
    • ENTERPRISE SUBSCRIPTION PLAN SIGN UP!

© 2025 Primary Vision. All rights reserved.