- Solaris Oilfields walks a tightrope between increased demand for its top fill systems and completion demand shortfall.
- The return potential of a fully integrated system on a per frac crew basis to increase substantially following the use of electric trucks.
- Seven incremental top fill units will be fully utilized in Q1 2023; however, its sand system count can decline in Q1 following the natural gas price dip.
- Its free cash flow was negative in FY2022; however, lower capex can improve FCF in 2023.
The Long-Term Value Drivers

Please read our previous article to understand the technological innovations SOI has brought in to gain advantages over its competitors. In particular, the company’s top fill systems and belly dump solution, following multi-year investments, helped it proliferate in relatively less-active basins like the Rockies and sand storage facilities in other onshore Basins. Belly dump trucking increases the number of turns per truck and allows for increased sand volume per truckload. Such technologies allowed it to broaden the customer base and pull-through sand silo work to gain longer-term visibility.
SOI has inked long-term agreements with many clients to continue using top fill solution and AutoBlend, its electric hydrated delivery system. These features helped reduce downtime caused by traditional blenders through increased pumping hours and lower maintenance. This would be particularly beneficial when pumping equipment and labor availability are tight, thus protecting the margin. In the future, the operators can improve savings by tying all electric equipment to the same power source as electric truck fleets. The management estimates that the share of electric truck fleets will increase considerably in the medium term. So, the return potential of a fully integrated system on a per frac crew basis is to increase substantially compared to today’s single six-pack system. It is estimated that by increasing investment in a sand system, a fluid system, top fill, AutoBlend, and last-mile service by 2x-3x, its return on core contribution margin per frac crew can increase by 2x-3x.
What’s The Q1 Outlook?
SOI’s management plans to return incremental capital to shareholders following its investment in creating top-fill equipment where demand has grown faster than supply. It has kept investments flexible to adjust to the demand pattern. The FY2023 capital plans are weighted towards 1H 2023. It estimates that approximately seven incremental top-fill units will be fully utilized in Q1 2023. However, due to the natural gas price’s weakness in recent times, its sand system count declined by a few systems in Q1.
Investors may note that the natural gas price declined by 50% in 2023, which drove a decline in gas-directed drilling activity. As a result, natural-gas-directed completion activity can be adversely affected in the near term. Because SOI operates in many US basins, the weakness in completion activity will also affect it. Nonetheless, increased demand for its top-fill systems can mitigate the demand shortfall.
Analyzing The Q4 Drivers

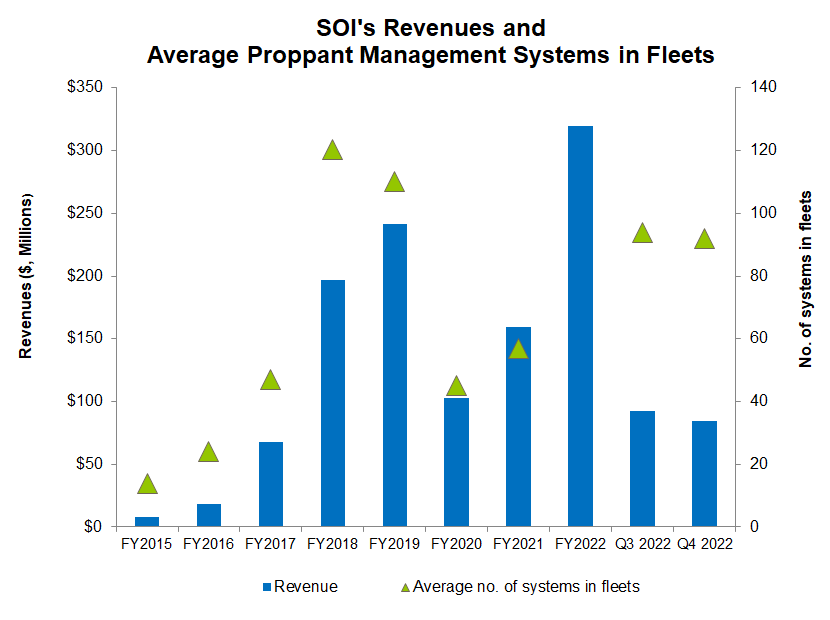
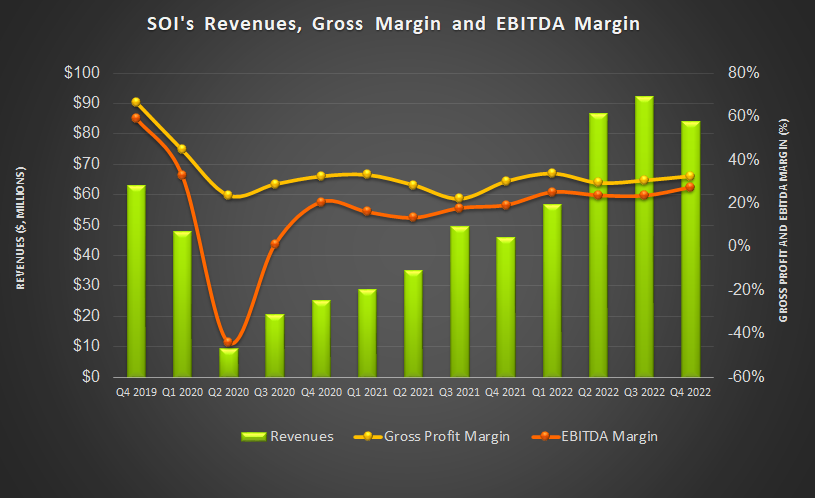
In Q4 2022, Solaris Oilfield Infrastructure took a U-turn and declined after growing in the previous two quarters. It decreased by 9% compared to Q3. During Q4, its fully utilized system count decreased by 2% quarter-over-quarter as weather disruption delayed job startup. Despite that, the operating margin expanded by 390 basis points due to increased systems deployed with new technologies and increased systems deployed with new top-fill solutions. Operating costs, however, increased, leading to a 30% drop in net income in Q4 over Q3.

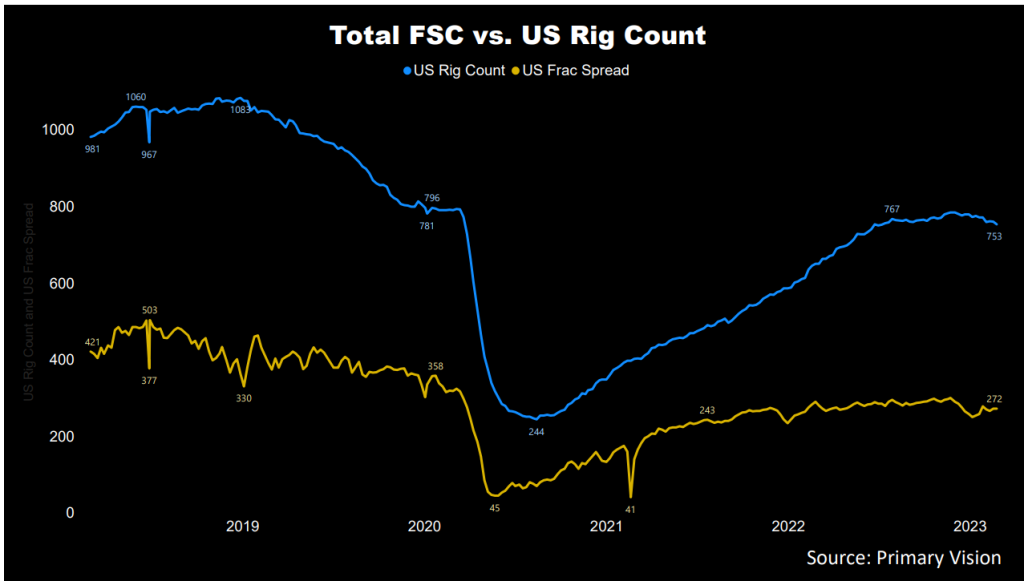
The drilled wells increased by 35% in the past year until January 2023, according to the EIA’s latest Drilling Productivity Report. In contrast, the drilled but uncompleted wells (or DUC) declined by 8% during the same period. However, the crude oil price has weakened over the past few months, which can lower drilled well count’s growth. According to Primary Vision’s forecast, the frac spread count decreased by 3.4% to 272 compared to the start of the year. The lower frac count can pull down SOI’s topline in Q1 2023.
Free Cash Flow, Capex, And Dividend
As of December 31, 2022, SOI’s cash & equivalents were $8.8 million, with no debt. Its total liquidity amount to $51 million. The liquidity should suffice working capital and growth needs in 2023.
SOI’s cash flow from operations (or CFO) increased substantially in FY2022 compared to a year ago. However, its capex more than tripled, resulting in free cash flow (or FCF) going further into the negative territory in the past year. In FY2023, it plans to commit between $65 million and $75 million in capex, which would be a 14% fall compared to FY2022. Although total capex can decline, it plans to maintain prior capex estimates for top-fill system growth.
SOI’s forward dividend yield is 4.42%., Schlumberger (SLB), the largest oilfield services company, has a forward dividend yield of 1.9%, while Halliburton’s (HAL) dividend yield is 1.79%. The company returned about $112 million in cash to shareholders through dividends and share repurchases since 2018.
Learn about SOI’s revenue and EBITDA estimates, relative valuation, and target price in Part 2 of the article.


