
I hope everyone had a great week. There is a lot going around but the main attention was on the U.S. job report that came out better than expected – again! It is actually a mystery that how, when all of the economic indicators coming out of the U.S. are either plunging or stalled. Another important data set that came out and disappointed was from China which also showed contraction in factory output. The upcoming news is the OPEC+ meeting where another announcement of production cuts is expected (I will cover it in our Monday Macro View on Monday night). We do not know what is going to be the result but one thing for sure is that Saudi Arabia seems to be growing irritated with Russia as they now harbor opposing ambitions. I will give a short overview of these developments below for the benefit of our readers in order to provide a snapshot of where the global economy stands at the moment.
Chinese Economic Data
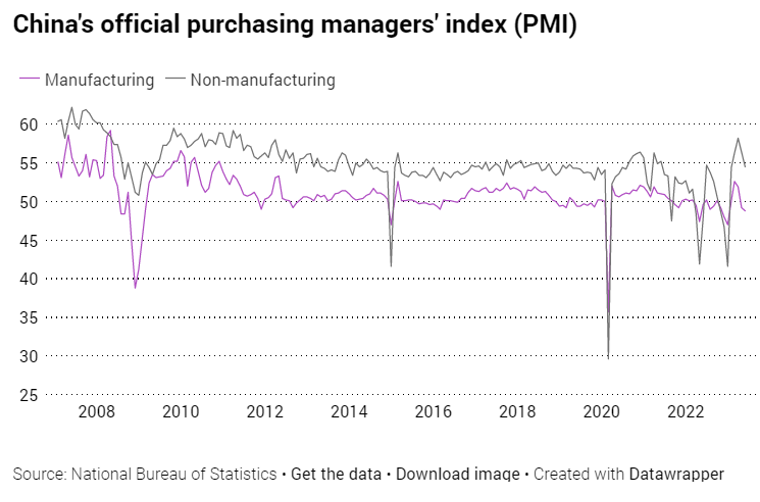
Recently recorded data revealed a significant downturn in Chinese manufacturing activity, reaching its nadir since the country’s post-lockdown reopening. Official statistics revealed a manufacturing PMI of 48.8, lower than the 49.2 recorded in April, suggesting a continuing decline in economic performance. Parallelly, the unofficial manufacturing PMI experienced a dip from 56.4 in April to 54.5 in May, marking the weakest showing in the past quarter.
The cooling global economy, particularly in regions like the United States, has also taken a toll on China’s performance, with export growth slowing to 8.5% in April, a sharp drop from the 14.8% surge in March.
The ripple effect of the gloomy data on China’s manufacturing and services sectors was palpable in the world stock market. Hong Kong’s Hang Seng Index nosedived 2.4% in the afternoon trading session, hitting its lowest point in half a year and reflecting a steep 20% drop from its zenith on January 27. Japan’s Nikkei 225 (N225) mirrored a similar trend, declining by 1.4%. The Shanghai Composite Index in China also recorded a modest 0.6% drop, while South Korea’s Kospi vacillated before settling for a 0.3% decrease. Consequently, the Chinese yuan dipped against the US dollar, both offshore and onshore, with the former down by 0.5% to 7.126 and the latter losing 0.4%.
As pointed out by Russell, this sluggish performance in the world’s second-largest economy and a major oil consumer may only manifest in the oil markets with a lag, as future shipment arrivals will reflect the current buying (or lack thereof).
The economic downturn has not just restrained manufacturing but has rippled across multiple sectors. In April, property investment saw a staggering 16.2% decline YoY, marking the steepest downturn since November 2022. Property sales, quantified by floor area, reported an 11.8% YoY drop in April, the highest slump this year. Additionally, industrial profits recorded a hefty fall of 20.6% during the first trimester compared to the same period last year.
Regarding China’s consumption of metals such as iron and copper, construction and manufacturing sectors play a major role as these are primary users of steel. As these sectors experience a slowdown, an ensuing impact on commodity imports is anticipated, although existing imports are predicted to maintain strength due to the inherent nature of lagging indicators. For instance, maritime iron ore imports are projected to reach nearly 93.29 million tonnes in May, slightly exceeding April’s 90.44 million tonnes.
Expectations also point to a modest increase in crude oil imports to 11.22 million barrels per day (bpd) in May, up from April’s 10.36 million bpd, albeit lower than the record 12.37 million bpd in March. Similarly, coal imports are projected to inch up to 34.33 million tonnes in May from April’s 33.61 million tonnes. However, the continued deterioration of economic indicators might prompt Chinese importers to reconsider their future buying decisions.
Data from the U.S. also disappoints
The U.S. manufacturing sector and freight activities have been on a downward trajectory for the past seven months. This slump is visibly affecting the demand for diesel and other distillate fuel oils, and it’s also impacting industrial electricity usage.
In the most recent monthly survey conducted by the Institute for Supply Management (ISM), manufacturers reported another sweeping decline in May. The ISM’s manufacturing index dipped to 46.9, which situates it in the 14th percentile of all months since 1980. This index has been consistently under the crucial 50-point mark since November.
In terms of duration, the index has been beneath the 50-point benchmark for a period longer than most mid-cycle slowdowns (typically less than eight months), but not yet matching most recessions (usually 11 months or more).
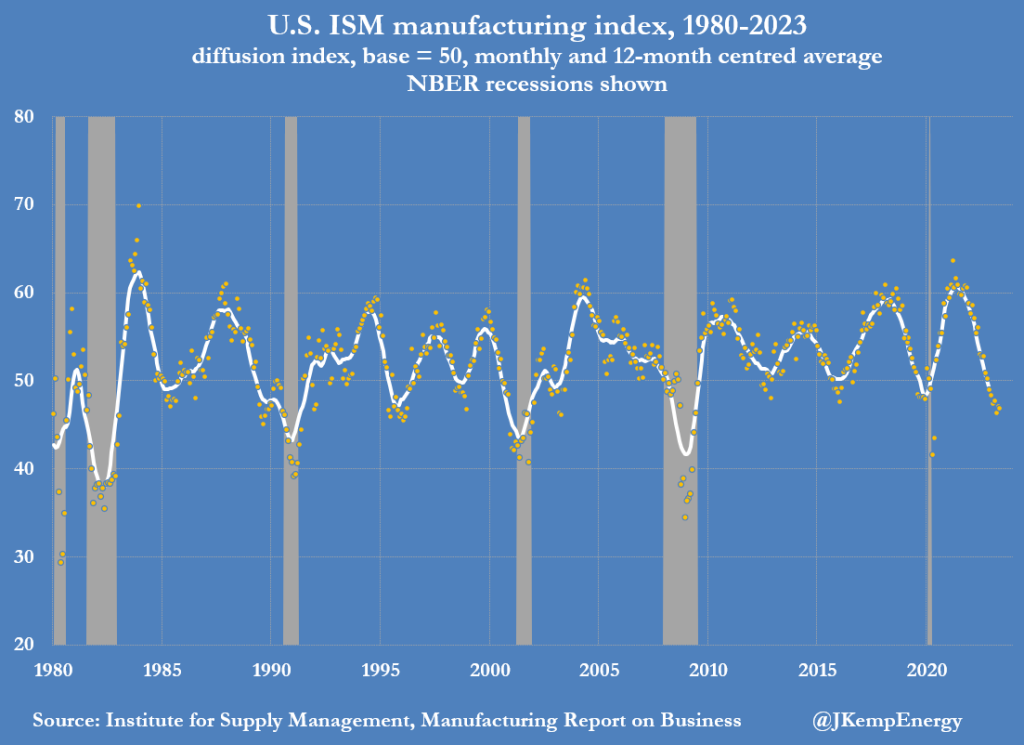
The new orders component, a forward-looking indicator, plunged to a mere 42.6 (6th percentile), suggesting the downturn in activity will persist for several more months.
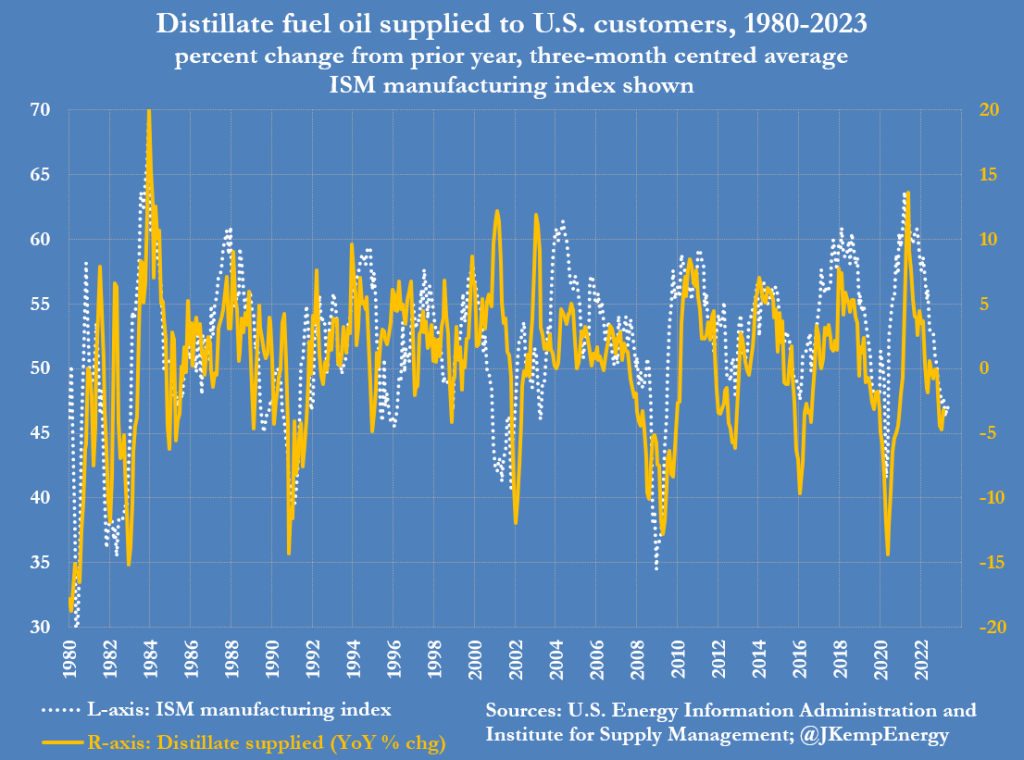
Considering the strong correlation between manufacturing output and distillate fuel oils consumption as well as industrial electricity usage, the downturn is leading to considerable reductions in energy consumption as that of distillate fuel oil has decreased in seven out of the eight months leading up to March 2023. Q1 of 2023 saw distillate usage drop by 3% compared to the same period in 2022, placing it in the 22nd percentile for all three-month overlapping periods since 1980.
Electricity sales to industrial customers also showed a decrease for seven out of the eight months ending in February 2023. Industrial power sales were down more than 2.4% between December 2022 and February 2023, compared to the previous year, placing it in the 14th percentile for all three-month periods since 1980.
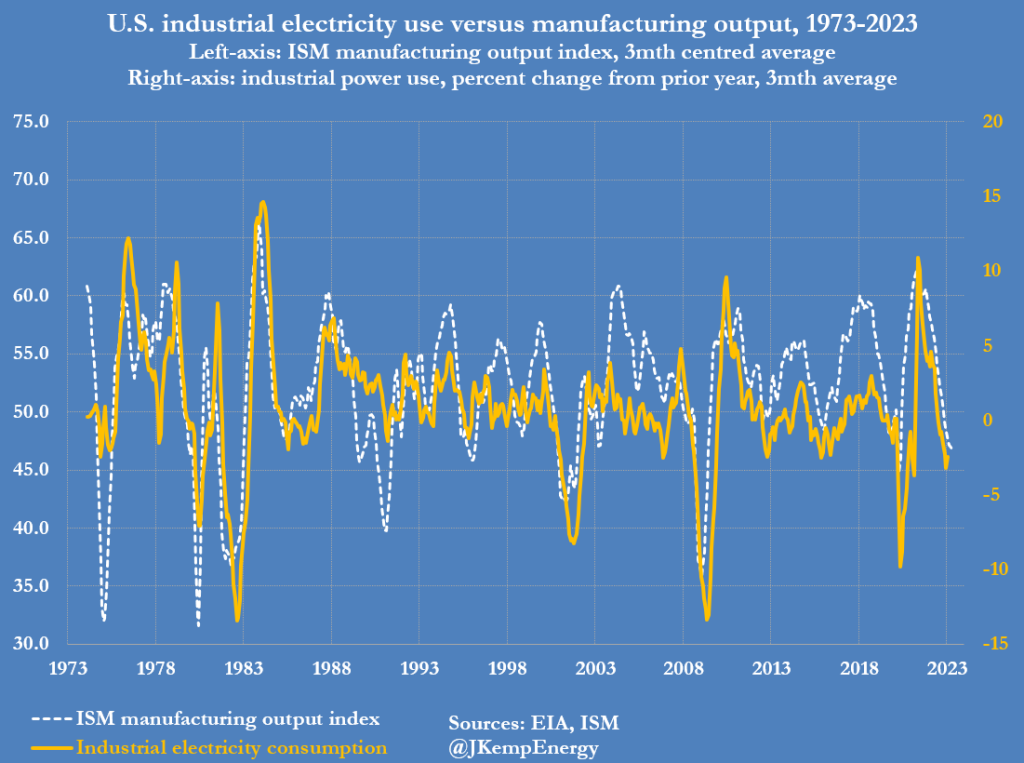
This decrease in energy consumption aligns with other indicators that suggest a widespread and enduring cyclical downturn in the industrial economy.
Reflecting this trend of weakening industrial demand, the total quantity of shipping containers transported by leading U.S. railroads saw a decrease of over 10% in the first 21 weeks of 2023, compared to the same period in 2022.
Given the persistent decline in new orders coupled with the relatively high levels of business inventories in relation to sales, it is likely that the downturn will continue at least through the third quarter of 2023.
Oil Markets – KSA vs Russia
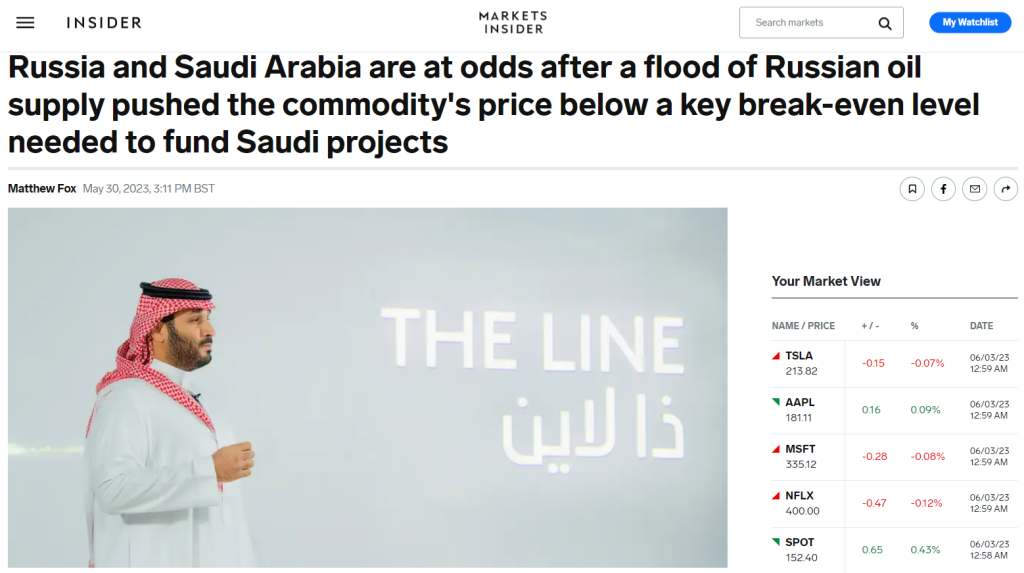
Saudi Arabia seems to be getting annoyed with Russia as the latter’s continued high exports and failure to comply to a 500,000 bpd cut is putting downward pressure of oil prices something that doesn’t align with Kingdom’s mega/giga projects.
I will talk more about it after the OPEC+ meeting.
Happy Sunday, Happy Reading!