The crude markets have readjusted a bit following some wild swings started by an “erroneous” Reuters article saying that Saudi was going to extend their 1M barrel a day voluntary cut through the end of the year. This was quickly reversed as a mistake, and the crude markets calmed back down following the adjustment. It’s an interesting backdrop because KSA and others within OPEC+ like to “leak” stories to see how the market reacts to the news. If you remember, many members of the media weren’t invited to the past OPEC meeting, and could this “mistake” have been an ask to get back in the good graces of KSA and by default OPEC? It’s hard to say, but it isn’t the easiest to get that kind of headline past multi-layers of screening. Regardless, the information was rescinded and now we have brent hovering between $78-$82 with little in the near term to break it out of the range.
After Saudi announced the extension of the cut, differentials spiked across the board, which has quickly started to adjust back down. OPEC reported that OECD commercial crude and product inventories have increased by more than 200mb since March 2022. In the same time frame, China has increased their storage to about 985mb with more coming every day given their lower runs and ramping imports. When we look at pricing here is a good breakdown of how things have normalized by looking at North Sea CFDs moving back into contango.
- Forties differential is at $-.20, where in previous tight markets it has spiked to about $1-$2
- The rest of the BFOET crudes are also showing something more normal because in a tight physical market they should be closer to $2.
- The Mediterranean diffs as well as WAF are showing something that is elevated vs when KSA made the announcement but not at “tight” levels.
We did get a nice spike in Norway’s Johan Scerdrup trading above $3 premium dated brent, but the floating storage in the region is showing some of that spike has slowed. We are also seeing some excess cargoes still remaining in West Africa. They started to move a bit faster after a sluggish start, but we still see several Congo Djeno crudes available- which normally move quickly.
WAF SALES:
- About 16 shipments of Nigerian crude for August loading are still searching for buyers, or roughly a third of the total of about 50 cargoes scheduled
- That compared with more than 80% unsold as of July 7
- Prices have also improved for West African grades in recent weeks due to healthy purchases from Asia; demand also seen in Europe for distillate-rich varieties
- Nigerian crudes such as Bonga, Egina and Erha could also get a further lift if the Forcados halt proves prolonged, the traders said
- Around 4-5 cargoes of Angolan crude for loading next month are yet to find final buyers, out of 35 scheduled
- Declined from 8-10 unsold as of July 7
- The preliminary program for September crude exports is due over the coming days
- Some 3 consignments of the Republic of the Congo’s Djeno crude are still looking for purchasers, out of seven planned
- The next Djeno program is due around July 24
Angola has already announced their September plan that show a small deferral from August.
ANGOLA PROGRAM:
- September’s plan includes 33 shipments of crude carrying a combined 31.35m bbl
- That’s slightly lower than the revised rate of 1.06m b/d for August, which has 34 cargoes
- One shipment of Saxi and one cargo of Saturno were deferred from August into September
- The final September schedule is due around July 26
The huge spike in West Africa floating storages came after they ran up differentials, but as they have slowly brought them down- additional cargoes have started to clear. They are selling above the price from before the KSA announcement, but by no means at the levels they pushed them too.
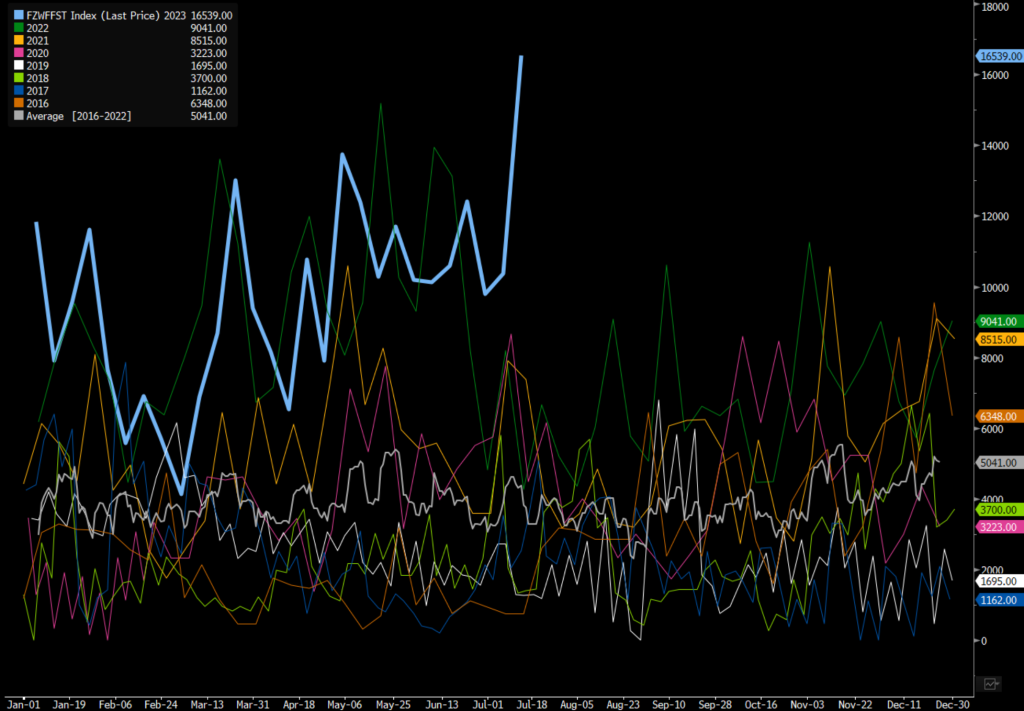
Middle East floating storage also saw a bit of a bounce in storage as countries/companies turn to alternatives.
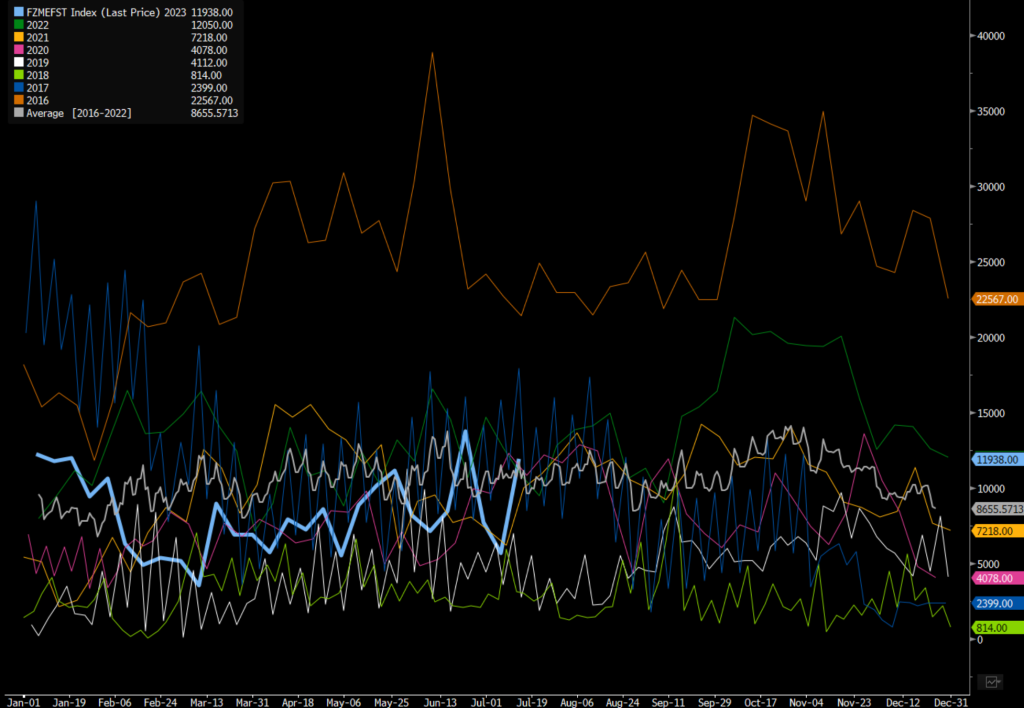
The shift away from Middle Eastern grades has pushed the discount of Dubai vs Brent further. The discount should help move some of these additional barrels- especially from the UAE.

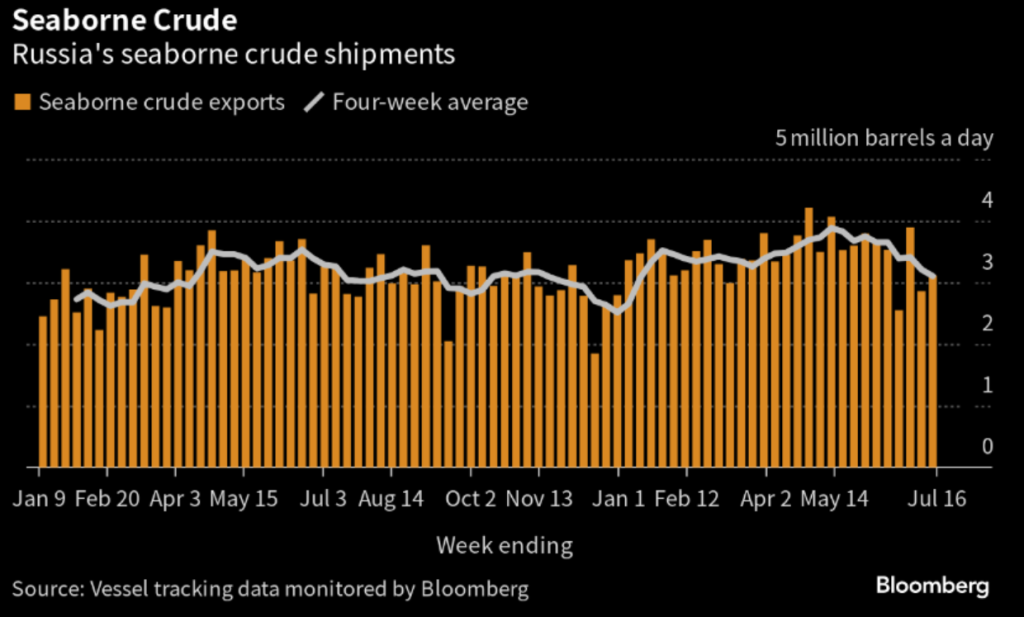
Another driver of recent volatility was Russian commentary about their “reduction” in crude exports. “On a four-week average basis, overall seaborne exports in the period to July 16 were down by 105,000 barrels a day to 3.1 million barrels a day. This compares with an average of 3.38 million barrels a day in the four weeks to Feb. 26. More volatile weekly flows moved in the opposite direction, rising by about 260,000 barrels a day to 3.11 million barrels a day.” They did reduce flows a bit, but some of the drops were replaced by refined product (mostly diesel) flows.
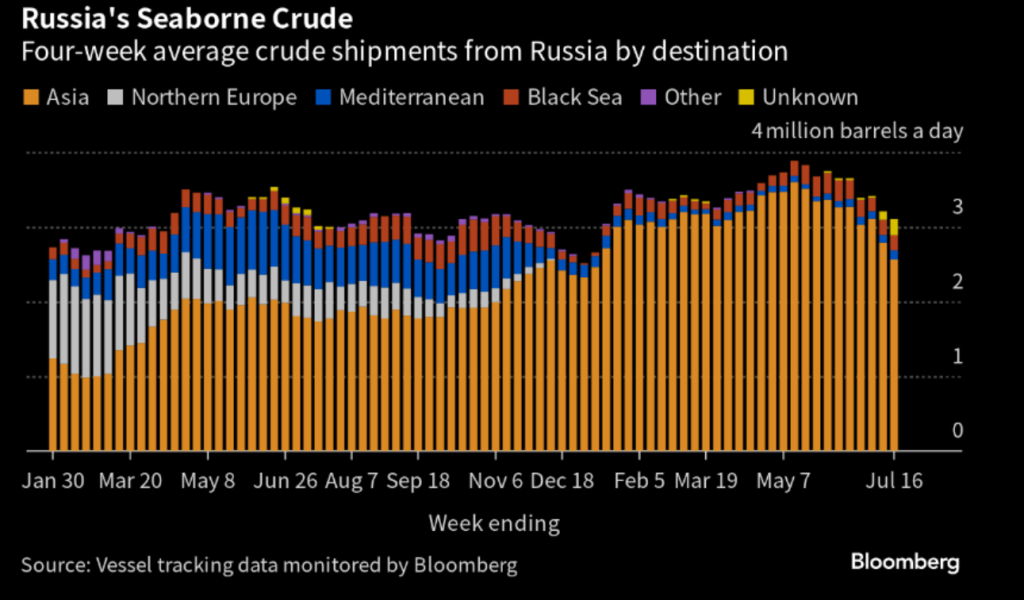
“In the first 15 days of July, Russia’s refined fuel cargoes rose about 81,000 barrels a day compared with June’s total, according to data compiled by Bloomberg from analytics firm Vortexa Ltd. They’re at about 2.49 million barrels so far, heading for a three-month high amid a ramp-up in refinery operations in the country. Shipments of diesel or gasoil — the top export product — rose 8.5% to about 1.27 million barrels a day. That’s near the 1.3 million barrels a day seen in March when flows reached the highest in Vortexa data since the start of 2016. Daily average flows are so far about 33% higher than year-ago levels. Russian refiners have prioritized production and exports of diesel amid strong profits, further limiting gasoline output from the country’s relatively simple refinery setup, Energy Aspects said in a note.” It’s always important to look at both sides of the equation- crude and products- when addressing exports. We have said from day 1 that it’s paramount to track both products and crude coming from Russia. They are trying to manage flows- so they have increased runs (absorbing more crude) and increasing the export of product instead of crude.

It’s also interesting to see some of these flows go to the Middle East because it will just be flipped back into the market under their flag. Another alternative- the country uses the cheaper Russian product allowing them to export the higher priced, locally created product.

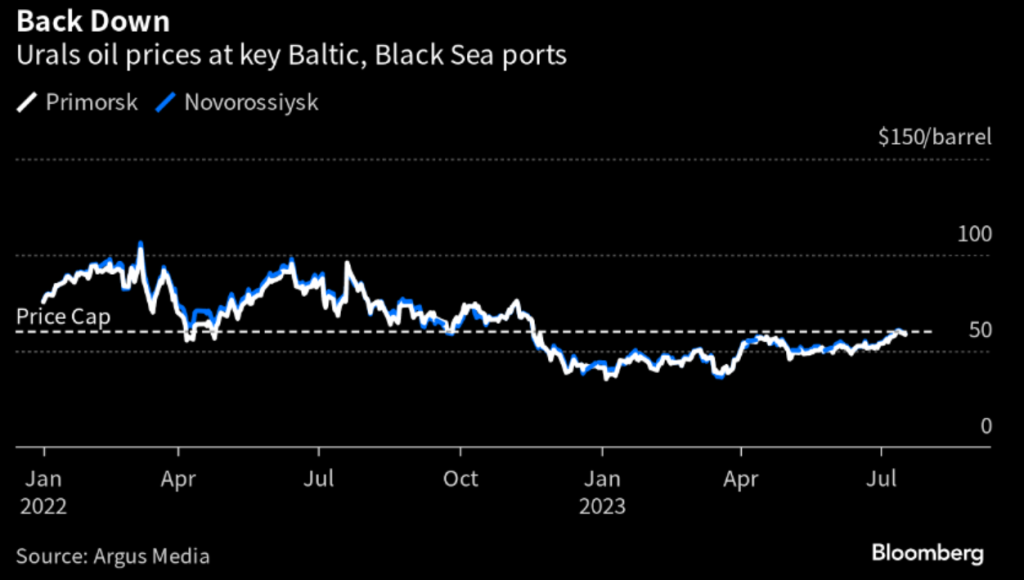
When we put together the product and crude exports, the “cut” by Russia is closer to 350k barrels, and will likely become less as more product is exported and crude flows rise. It’s also worth pointing out that Urals saw their price spike above the price cap, so it also became “expensive” to purchase the barrels. ESPO has been trading above the cap the whole time, but this was one of those times we saw Urals get a nice little spike. If you do the math though- it would cost about $62 to move Urals vs about $84 to move KSA to Asia. This will keep the Asian markets moving Russian and Iranian barrels well before anything Saudi is moving into the market.
The increase by KSA has also given another lifeline to U.S. exports into Asia. My view was that Europe was still going to be a main destination, but given the price spikes- U.S. crudes are still viable heading into Asia. “Asia is pulling the most US crude in four months after Saudi Arabia’s price hike and improving gasoline margins made WTI more attractive, according to people with knowledge of the situation.
- So far 20-22 supertankers have been booked to load US crude to Asia in August, the highest since April, when 27 VLCCs sailed on these routes
- August charterers include Chevron, Unipec, Phillips 66 and Occidental
- Compares to 14 ships each month in May, June and July, according to Kpler data
- Click here to see the list
- Asian buyers sought more US barrels after Saudi Arabia hiked prices and as a narrowing sweet-sour spread is making sweet oils like WTI too cheap to pass”
Sour crudes will still trade at a premium given the shortages in the market, but U.S. light sweet is still finding a home in Asia at the moment. China is also importing way more Iranian crude vs previous years under the guise of “Malaysian Crude.”

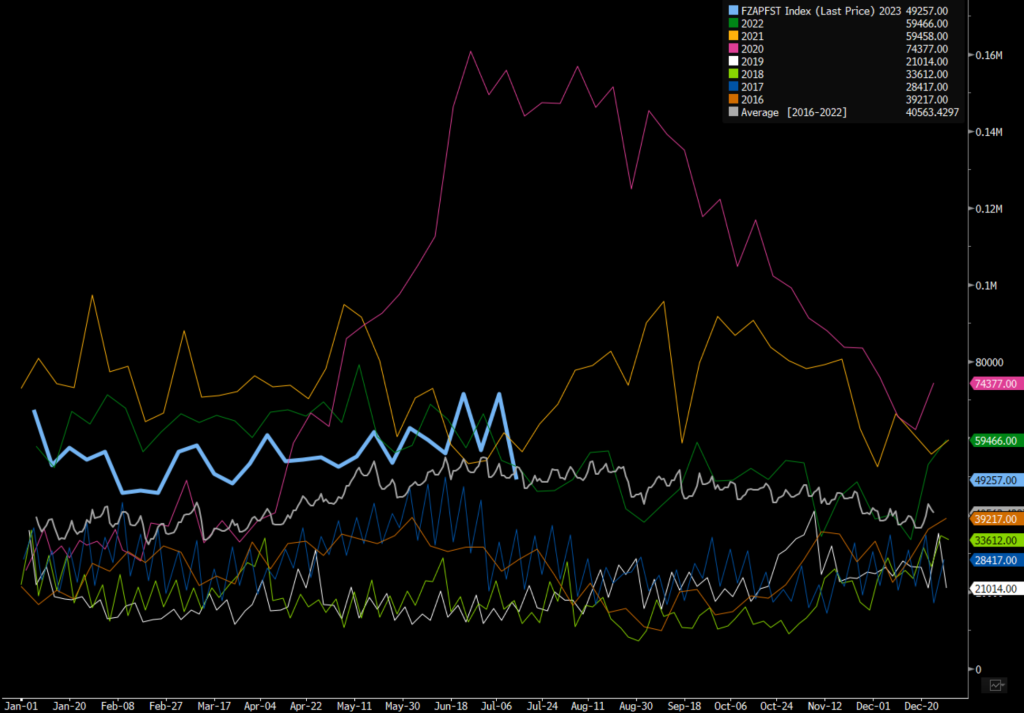
China is importing well above their “normal” levels, which will help provide more than enough physical crude heading into the second half of the year. The view that their demand will surge into the end of the year just doesn’t match up with the current flows. The below chart looks at supertanker crude imports, which are showing a sizeable increase vs historics.

Their refiners are still operating below seasonal norms as demand remains below market expectations. The rise in shipments flagging China will push floating storage back up over the next few weeks and track closer to 2021.
Chinese driving is also tracking exactly as we expected it would with some additional reductions along the lines of 2022. Given the recent Chinese economic data, we don’t see any meaningful pivot in demand. Even with some sort of “stimulus,” economic growth will weaken further and fall flat.

The rest of the world isn’t in a much better position when we look at underlying activity. The movements in the other regions follow exactly what we have been describing. Europe will start to flatline around these levels as the U.S. and Asia Pacific track about 10%-12% below normal.

U.S. activity will keep increasing along seasonal lines, just at a much slower pace and end at a lower level of activity. Trucking continues to drift lower with more pressure across the board.
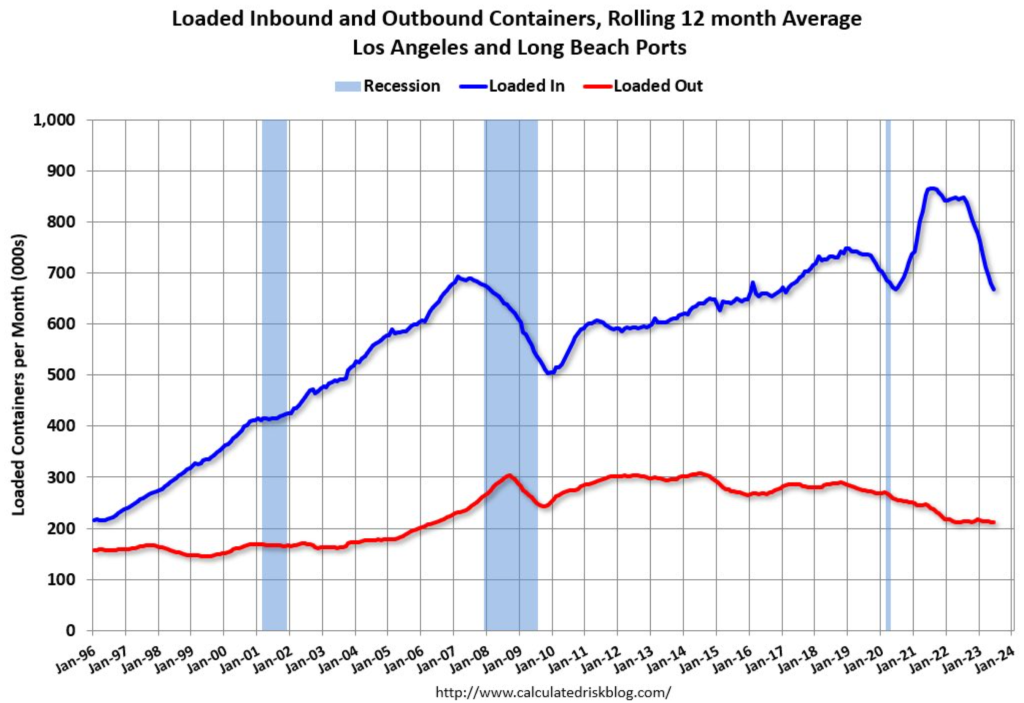
Port traffic – both inbound and outbound – continues to plummet at the Port of Los Angeles “On a rolling 12-month basis, inbound traffic decreased 1.8% in June compared to the rolling 12 months ending in May. Outbound traffic decreased 0.3% compared to the rolling 12 months ending the previous month.” The general activity in the U.S. is moving lower, which will put more pressure on trucking and shipping.
The below chart puts into perspective where we sit against historical norms during this time of year. We are trending at 2022 levels as gasoline demand falls flat and trucking remains sluggish for the remainder of the year.
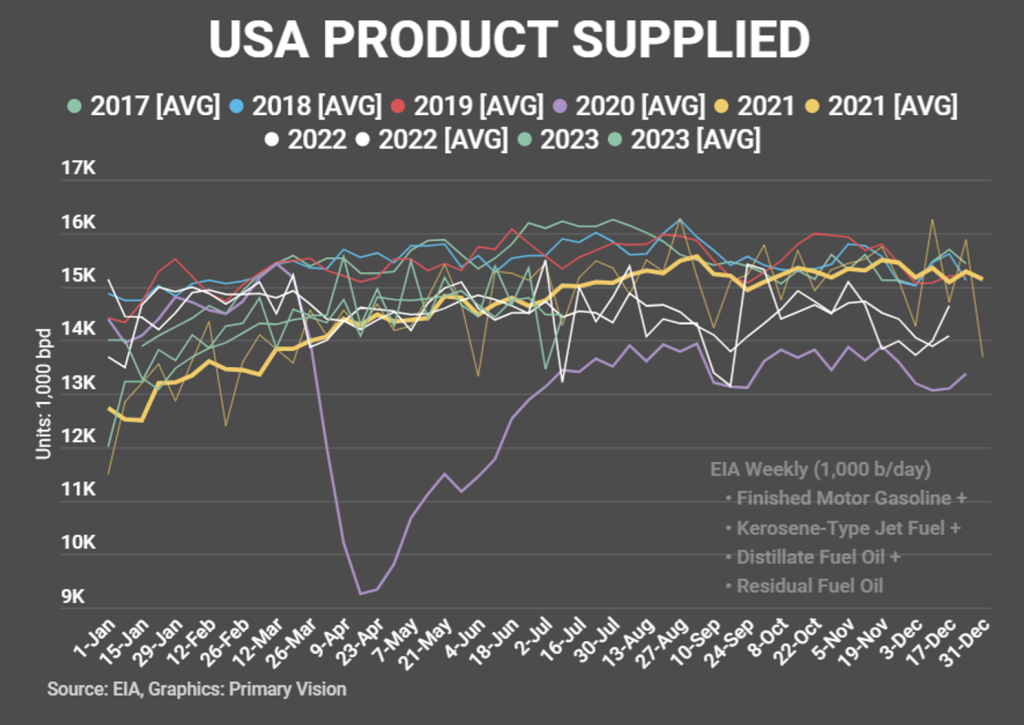
The potential strikes will likely make things worse when we roll in UPS and Yellow trucking.
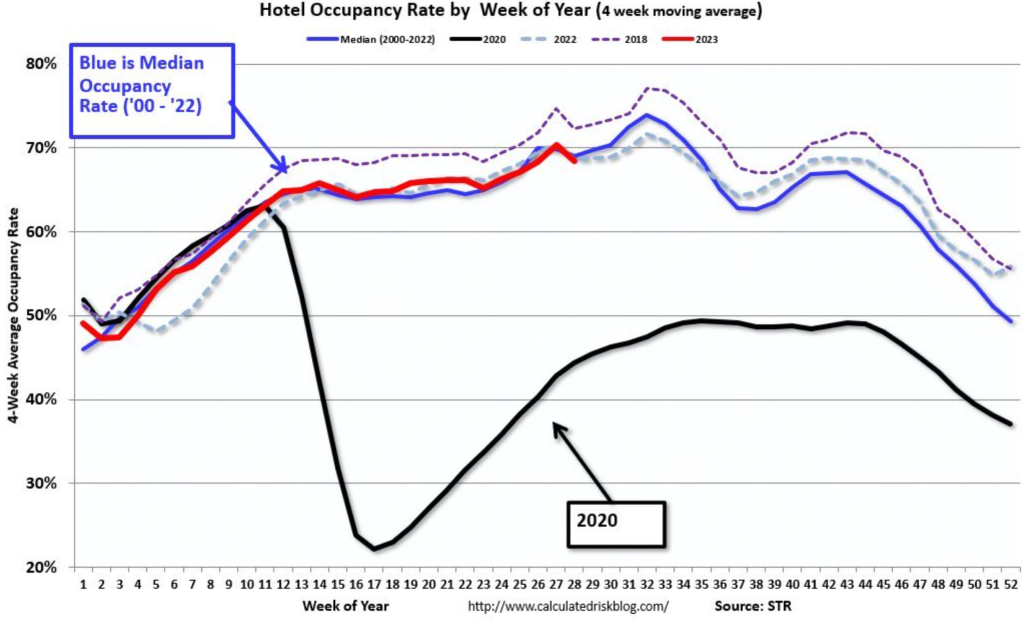
We are also seeing hotel occupancy fall further as activity dwindles faster on the hotel front. Our base case is that occupancy doesn’t increase over the next few weeks, instead staying mostly flat through the “peak” periods. Right now- we are about 2.3% below last year with other hotels reporting something closer to 12%-15% below last year.
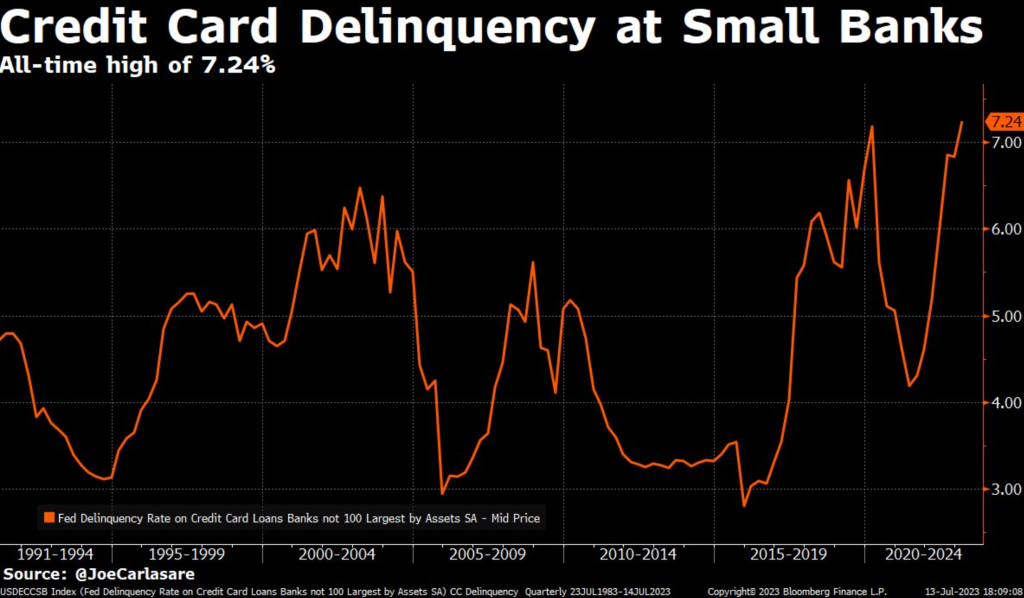
We are seeing card delinquencies moving higher as interest rates have surged to over 22%. This is just the beginning of the pain as balances move up and interest rates increase the pain. We are already seeing slippage in credit scores as individuals carry larger balances.

There are also more auto loans moving into serious delinquencies. These are two pre-cursors to a much bigger drop off in underlying consumer activity.

It will also put more pressure at small banks that haven’t seen this level of stress in decades.
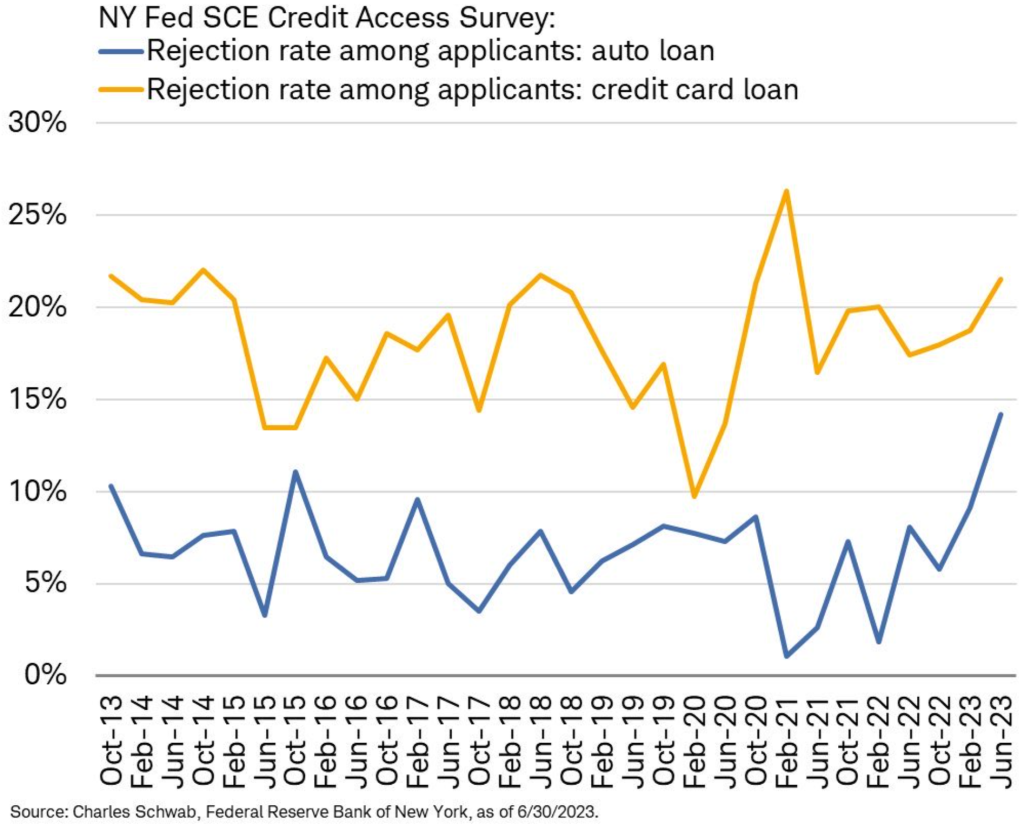
Across the board- loan application rejection rates have spiked across the board: Average loan rejection probability reaches new highs! The readings for auto loans (30.7%), mortgages (46.1%), and credit card limit increase requests (42.4%) are all new series highs. (Sourve: SCE CREDIT ACCESS SURVEY). Credit Access Survey from New York Fed shows more stress building for consumers … record-high rejection rate for autos reported in June, alongside tick higher for credit card rejections (survey only goes back about a decade).

One of the big spenders is higher-income households, but they are starting to worry about making their minimum debt payments.

It’s no surprise to see another drop in same store sales from Redbook, which is the worse drop since Sept 2020.

Looking at similar data slightly differently below- US Same-Store Sales Down 0.2% Y/y in Week: Redbook – Bloomberg *Sales at stores open at least a year, or same-store sales, fell 0.2% in the July 15 week compared to a year earlier, Johnson Redbook says. *Month-to-date sales through July 15 fell 0.3%.
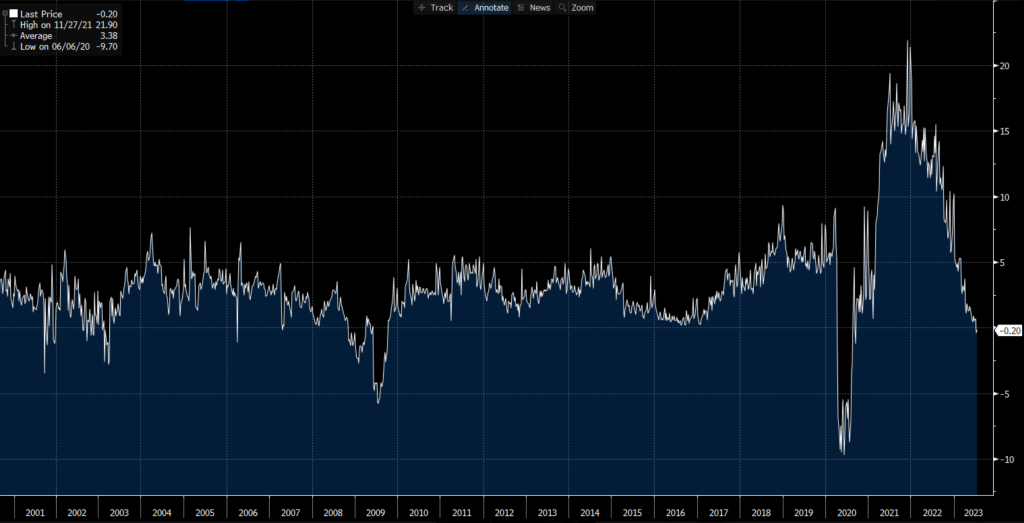
We have been highlighting that the pressure was mounting, and even though it was positive- you can see how it has drop down and has “officially” hit negative territory.
This points to July being a negative month for retail sales after another weak print in June, which was still positive but softening. “Retail sales softer with +0.2% m/m gain vs. +0.5% est. & +0.5% in prior month … sales ex-autos +0.2% vs. +0.3% in prior month … control group (which is what’s used for GDP calculation) +0.6% vs. +0.3% in prior month.”

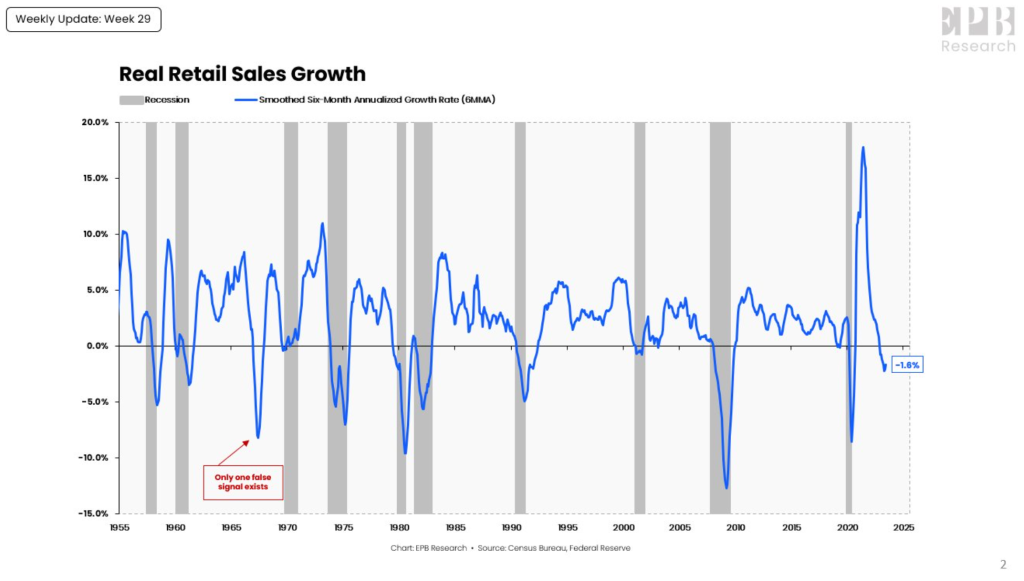
After adjusting for inflation, US retail sales fell 2.5% over the last year, the 8th consecutive YoY decline. That’s the longest down streak since 2009. Nominal retail sales increased 0.5% YoY vs. historical average of 4.7%.

Consumer spending momentum is still positive but softening:
Retail sales momentum has slowed markedly from 7.4% y/y at the start of the year to 1.5% y/y in June
Core retail sales still holding up at 3.8% y/y
Sales are **down** 1.5% y/y in inflation-adjusted terms.
The only saving grace for the control group was the “nonstore retail”, which is dissipating when you look at the Philly Fed data, CAPEX expectations, and leading indicators.


“Real retail sales have remained in persistent contraction. Over the last 70 years, sustained contractions in real retail sales overlapped with recessionary periods. One false signal occurred in 1967.”
It isn’t surprising to see the leading economic index drop again: “Leading Economic Index from Conference Board fell in June by -0.7% m/m, worse than -0.6% in prior month … year/year decline (shown in chart) slipped to -7.8% and continues to be consistent with declines in prior recessions.”
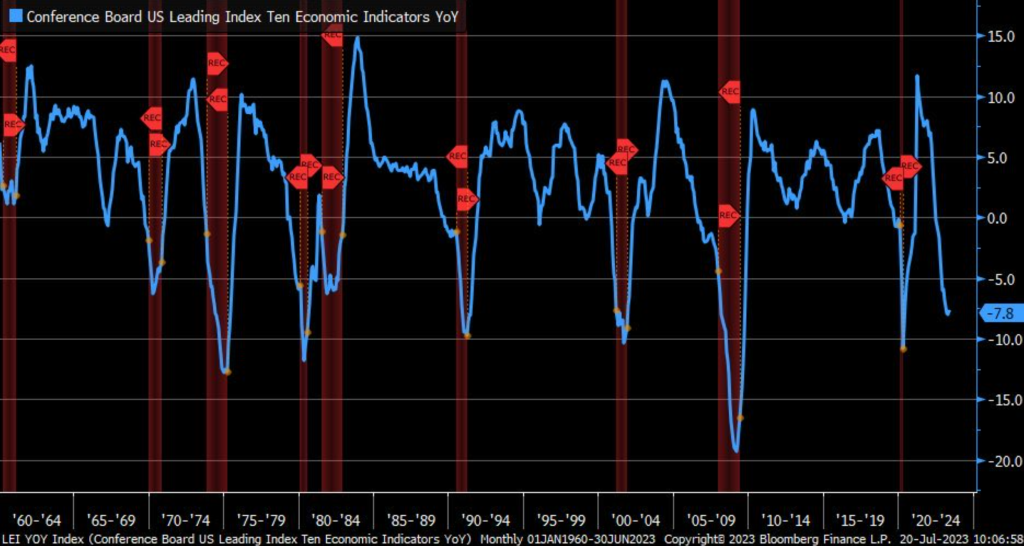
The data continues to point towards more pain ahead, which we don’t see adjusting at this point.
We also have more pressure points with the end of the Black Sea Grain deal as well as India stopping the export of white, non-basmati rice.
India, the world’s biggest rice exporter, banned shipments of non-basmati white rice to maintain domestic prices at comfortable levels ahead of the general election due in early 2024.
India Bans Some Non-Basmati Rice Exports to Control Prices
- The nation accounts for about 40% of the global rice trade
- Domestic rice prices have increased more than 8% this year


The below chart shows the difference between the two, and you can see the sheer size of the non-basmati rice vs basmati. This will have huge ramifications across the globe give the fact that it’s a staple for more than 3B people.
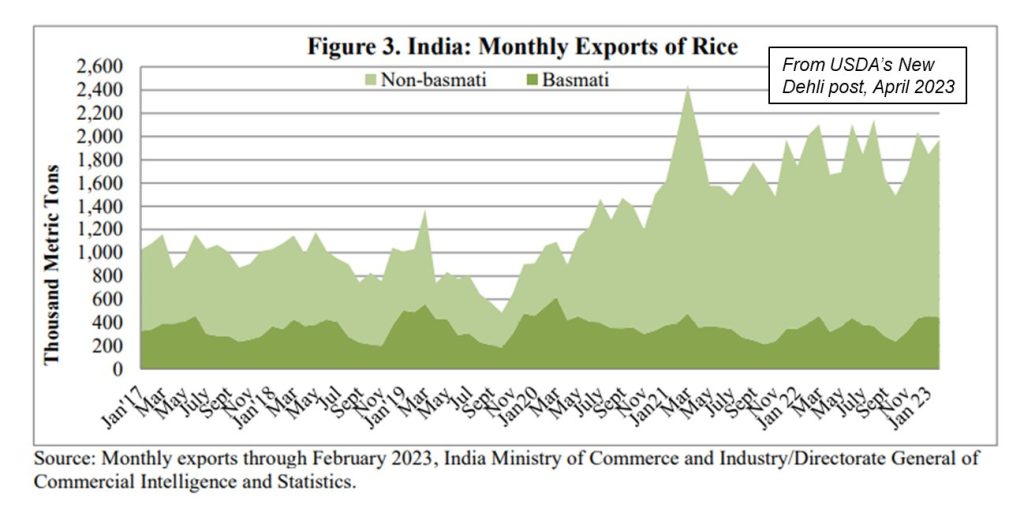
We have been stating FOR YEARS that the world is facing down the barrel of a gun when it comes to food. The issues span more than just the geopolitical, but also hit home when you look at underlying yields and availability. “Top rice exporter India has banned exports of non-basmati white rice after heavy monsoon rains damaged the crop. India accounts for 40% of world rice exports and most of it is non-basmati. Top buyers are Africa, Middle East and other Asian nations.”
This is all happening as Russie launches missile strikes against Odesa in Ukraine following the end to the Black Sea Grain deal. They have hit storage, loading, and other port assets impacting the ability to load ships. Russia has also been mining the region and threatening to fire upon any vessel that gets near the Ukrainian coast. Despite the war, Ukraine was still the third largest corn shipper, which we always expected to fade even with the deal. This is driven by the lack of access to fertilizer, mined fields, destroyed/damaged infrastructure.

Regardless, this is impacting even more on a global level when we look at the total availability of grains.

This will also impact China, which saw another round of problematic economic data. We have been very specific about our views of China, and they continue to come to pass when we look at the recent releases.
The headlines:
- The economy expanded 6.3% y/y in Q2, compared with 4.5% y/y in Q1 of this year.
- GDP was up 0.8% on a seasonally adjusted basis versus the previous three months.
The GDP print was a big miss: The consensus forecast was for 7.3% y/y growth.
- In nominal terms, GDP growth last quarter actually fell from 5.0% y/y growth in Q1 to 4.8% y/y in Q2.
The monthly econ data in June is bleak, with consumption growth dropping off:
- Retail sales rose only 3.1% y/y in June.
- Fixed asset investment (FAI) rose only 3.1% y/y in June.
- Value-added output at industrial firms rose only 4.4% y/y in June.
Growth is increasingly reliant on the state sector:
- While SOEs increased investment 7.4% y/y in June, private firms cut investment 0.6% y/y.
- Infrastructure spending growth hit a four-month high of 11.7% y/y last month, but real estate investment dropped 10.3% y/y.
State-led spending can only get the economy so far.
- The private sector is vital for job creation.
- Economic malaise means businesses are reluctant to hire new staff – graduate unemployment climbed even higher last month, to 21.3%.
Get smart: The dire performance of the economy in Q2 means that without effective stimulus measures, there is a genuine risk China won’t hit this year’s GDP growth target of 5%.
Get smarter: To avoid this outcome, the need to support the private sector – particularly households – should be
On Friday, the State Council called for constructing “civilian-emergency dual use” infrastructure in large cities.
- Sounds fancy, but this refers to hotels that can be adapted into quarantine and treatment centers during public emergencies (NDRC).
Don’t panic – the government isn’t prepping for another round of lockdowns.
- This investment splurge is part of the government’s (failing) efforts to revive the economy.
Specifically, the guideline calls for (Gov.cn):
- Encouraging more private firms to participate in the construction, adaptation, operation, and maintenance of the facilities
- Revitalizing inefficient and idle state assets in metropolises
Get smart: The impact on the macroeconomy will be muted.
- For one thing, the policy is only focused on large cities.
- For another, cash-strapped local governments – who we assume will be asked to stump up cash – will slowball the rollout.
Get smarter: This policy speaks volumes about the lack of coherent econ strategy.
- Policymakers are desperate to get the economy moving – but don’t know how.
Dig deeper: We’ve long argued policymakers need to boost household incomes, confidence, and spending to get the economy on a firm footing.
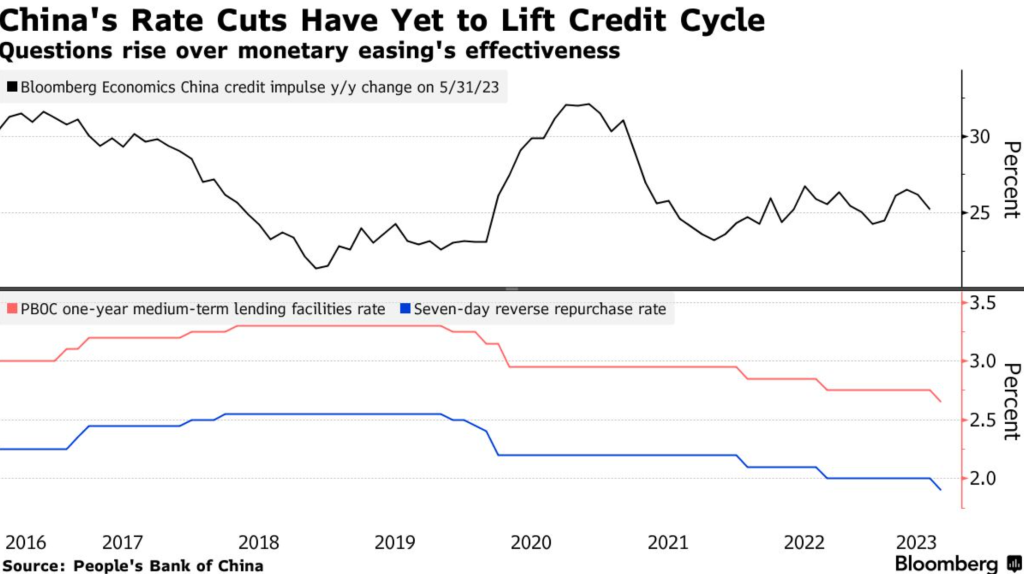
A big issue remains the private market, which is shrinking at a rapid pace. The SOE’s aren’t capable of bridging the gap- especially as the consumer continues to reduce their total spending. As we said from the beginning, China’s rate cuts won’t lift credit cycles and won’t drive additional demand.

The pace of the recovery is losing steam, and we see more headwinds as any attempt at “stimulus” will fall flat.

I was told that “private companies don’t matter in China because everything is centered at the top.” This is factually and actually incorrect when you look at where most of the jobs and GDP is generated. It’s another reason the CCP is trying to make a hard pivot back to the private world.
“China’s Communist Party and government issued a joint pledge to improve conditions for private businesses in a signal that Beijing wants to bolster corporate confidence as economic growth wanes. China vowed to treat private companies the same as state-owned enterprises, according to a joint statement from the party’s central committee and the state council on Wednesday. Governments at various levels are also encouraged to invite entrepreneurs for consultation before drafting and evaluating policies. China has shifted its tone toward the private sector after wrapping up a multi-year crackdown on tech firms and imposing fines of over $1 billion on Ant Group Co. and Tencent Holdings Ltd. this month. The Communist Party’s evolving stance under President Xi Jinping has become one of the most closely watched developments in global markets, with some observers calling China’s sprawling internet sector uninvestable. China’s efforts to revive growth, ranging from lower interest rates, easier access to credit and a series of measures to kick-start the moribund housing market have all done little to bolster the economy in the wake of crippling pandemic restrictions. The government added to the efforts this week with an 11-point plan aimed at boosting consumer spending. China’s recovery lost momentum in the second quarter — expanding just under 1% from the prior three months, putting Beijing’s 5% growth target at risk and prompting several economists to downgrade their forecasts for the year.”
This desire to drive more growth is hitting another brick wall as more high-yield bonds suffered another huge loss. China’s high-yield dollar bonds suffered their sharpest three-day selloff this year, with a fresh default from a state-backed developer underscoring how a liquidity crisis is worsening even for those with funding access. Greenland Holding Group Co., which is partially owned by local government entities, has defaulted on a 6.75% dollar bond it guaranteed, according to a notice sent to bondholders and seen by Bloomberg News. That comes as state-backed Sino-Ocean Group Holding Ltd. proposed repaying a local note over one year.

What I love about all of this- these are ALL either state-backed, government owned, or a partial government entity.
China is relying “again” on the LGFVs to delivery needed stimulus, BUT they are essentially a dead end as many are struggling to service interest payments.
“A growing number of LGFVs are struggling to service the interest payments on their mounting debts. Consequently, they have turned to unscrupulous private fund managers, who carry out these structured issuances to help risky borrowers access funding. Fund managers help the borrowers package their debts into asset management products to facilitate financing and skirt regulatory oversight. However, while officially banned, structured bond issues aren’t technically illegal – yet. In recent years, LGFVs that are financially weak have become the major users of such issuances, which become particularly risky in regions where local authorities borrow beyond their means. There are deeply intertwined interests behind LGFVs’ structured bond issuances,’ said a bond market insider. ‘Although there hasn’t been a wave of defaults yet, it is undoubtedly a high-risk zone.’”
Which is why the below chart of local government debt is essentially insolvent.

The broad fear of borrowing and falling into one of these LGFV traps is sending credit impulses negative- with little to provide a bridge higher.

From the Chinese consumer’s perspective, why would they risk trying to invest more money as landmines surround them? These unknowns are keeping them firmly on the sidelines with little desire to increase their risk- especially after taking huge losses and write-downs.

There has also been no improvement in the home price side keeping consumers sitting with heft losses that they have yet to recover from

The lack of price appreciation will keep China property investment well below zero for some time to come.

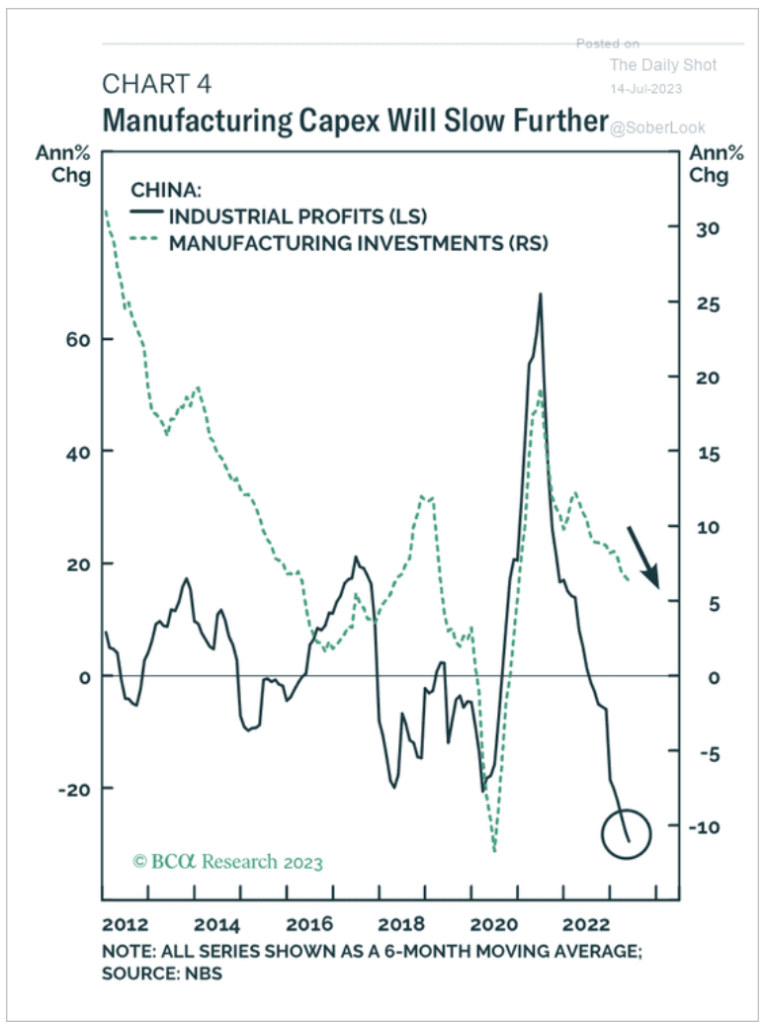
There is also a sizeable drop in manufacturing CAPEX, which is actually worse than many appreciate.
We’re hearing this almost every day now: “Well-targeted policy steps are needed to keep the tasks of boosting domestic demand and shoring up consumption high on China’s work agenda, with more forceful measures needed to increase household incomes.“ But while everyone now seems to agree that consumption must play a larger role, and that for this to happen there must be an increase in household income, no one seems to be discussing what the costs and constraints of such a shift are likely to be, and how to manage them. It’s not enough for household income to rise. For consumption to play a larger role in the economy, the household share of GDP must rise, which means that after decades of transfers from households to subsidize manufacturing and investment, these transfers must be reversed. This implies a transformation in the structure of the economy, and requires that the adjustment costs be absorbed by some sector, most probably local governments. Economic policy advisors should be specifying how these costs are to be distributed. Until they do so, China risks following the path of Japan, where they’ve been talking about boosting the role of consumption in driving growth since the Maekawa report of 1986 — and are still doing so today.


Talking about how ridiculous China’s official statistics is these days. This was official China govt statistics in 2022, report July 2022. Fixed asset investment was 27.14 trillion http://english.www.gov.cn/archive/statistics/202207/15/content_WS62d10587c6d02e533532ddf6.html… 2023 official figure was 24.31 trillion. http://english.scio.gov.cn/m/pressroom/2023-07/17/content_92685636.htm… But, somehow China reported 3.8% growth, with fine prints saying figures have been adjusted for various reasons. But, most media is oblivious of the discrepancy and just take the top line number reported by Chinese govt, like the one underneath
I think it’s well known that the data truly can’t be trusted, but the shift to consumer won’t come easy- especially given what they have been used to for decades.

We don’t see the consumer changing their colors any time soon!


