Industry Outlook
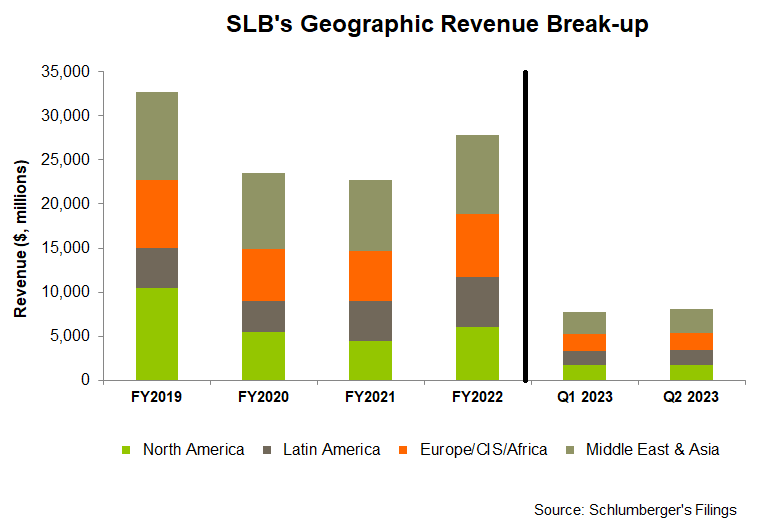
We discussed our initial thoughts about SLB’s (SLB) Q2 2023 performance in our short article a few days ago. In this article, we will take a deeper dive into its views on the market, current outlook, and the primary drivers in Q2. SLB reckons that its business portfolio, which draws most of its sales from international markets (78% of the Q2 revenue), is advantageous in the industry. This is because the investment momentum is accelerating in the global markets, while growth in North America has moderated (but still positive). For example, it sees long-cycle energy developments in Guyana, Brazil, Norway, and Turkey. Production capacity is expanding in Saudi Arabia, UAE, and Qatar. Energy exploration activities are on the rise in Africa and the Eastern Mediterranean.
The outlook in some of the regions looks robust. According to the company’s estimates, Saudi Arabia can invest $100 billion between now and 2025 in upstream energy, a 60% increase over the previous three years. The other key driver for future growth is offshore energy. SLB expects ~$500 billion in global FIDs between 2022 and 2025. Nearly 40% of this would be invested in deepwater, or a 90% increase compared to the previous three years. Mexico, Brazil, and Turkey have recently been the highlights of offshore energy investments.
The Digital And Cloud Push
The third leg of SLB’s anticipated growth relies on digital technology and data, including cloud computing. Applying cloud computing in geoscience has led to productivity gains and acceleration of the development cycle. It also led to de-risking of subsurface and surface uncertainties. The adoption of SLB’s Delfi cloud-based digital platform and SaaS subscription model has increased by 60% over the past year.
Two key customers who have adopted Delfi in recent times are Petrobras and ENAP. Digital automation has impacted efficiency, carbon footprint, and performance in well construction and production. Adopting Neuro autonomous solutions with Kuwait Oil Company and PETRONAS has resulted in drilling consistency and rig time savings.
Q3 And FY2023 Forecast
Up ahead, the divisions that will benefit from the current trend are Well Construction, Reservoir Performance (in exploration and appraisal), Production Systems (in subsea), and Digital. In FY2023, the management expected revenue growth of “more than 15%” and an adjusted EBITDA growth in the “mid-twenties.”
In Q3, the company expects revenue growth of “mid-single digits” in its international operations compared to Q2. However, it expects North American revenue to decline slightly. On the other hand, the operating margin in international operations can expand by “50 basis points” in Q3 due to improved revenue quality, better operating leverage, and increased technology adoption.
Analyzing The Q2 Drivers
The company’s revenues from Middle East & Asia increased the most (10% up) in Q2 compared to Q1. The growth was most notable in Saudi Arabia, UAE, Mexico, Guyana, Brazil, Angola, Caspian, and India. Year-over-year, its international operation’s incremental operating margin was the highest in Q2 compared to the previous three years. Because SLB’s revenue sources are quite balanced among its four primary geographic spreads, it is insulated from regional fluctuations.
SLB’s revenues from North America also increased by 2.8% in Q2, despite the onshore slowdown in that region that affected many of its peers. During Q2, it expanded activity in the U.S. Gulf of Mexico, while its U.S. onshore activities remained steady. The company currently focuses on operating margin stability instead of topline growth.
Cash Flows, Balance Sheet & Shareholders’ Returns
SLB’s cash flow from operations increased by nearly 200% in 1H 2023 over the previous year, led by year-over-year revenue rise and working capital improvement. Capex decreased, improving free cash flow (or FCF). In 1H 2023, it generated $1.1 billion in FCF. In FY2023, it kept its capex estimates unchanged at $2.5 billion-$2.6 billion.
SLB’s debt-to-equity (0.70x) remained nearly unchanged from a quarter ago. Its net debt was reduced by $200 million sequentially in Q2. During Q2, it repurchased shares worth $213 million. This is part of its target to return $2 billion to shareholders between dividends and stock buybacks in 2023.
Relative Valuation
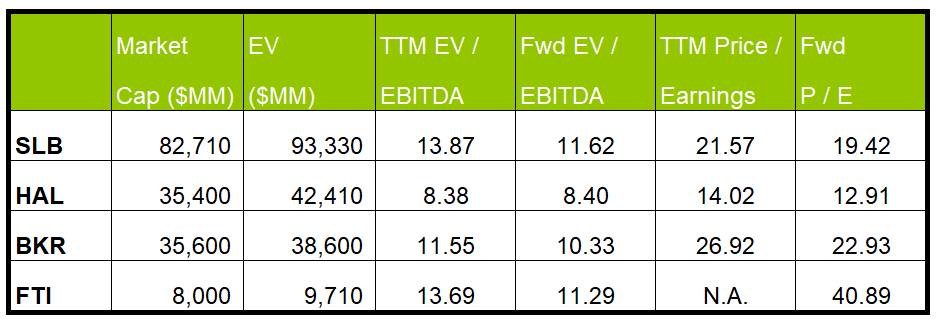
SLB is currently trading at an EV/EBITDA multiple of 13.9x. Based on sell-side analysts’ EBITDA estimates, the forward EV/EBITDA multiple is 11.6x. The current multiple is higher than its past five-year average EV/EBITDA multiple of 11.8x.
SLB’s forward EV/EBITDA multiple contraction versus the current EV/EBITDA is steeper than its peers because its EBITDA is expected to increase more sharply next year. This typically results in a higher EV/EBITDA multiple than its peers. The stock’s EV/EBITDA multiple is higher than its peers’ (HAL, BKR, and FTI) average. So, the stock is reasonably valued versus its peers.
Final Commentary
In the medium term, SLB is set to reap investment momentum acceleration benefits in the international and offshore markets. In the medium-to-long term, long-cycle energy developments in Guyana, Brazil, Norway, and Turkey should help it grow fast. A significant investment is lined up in Saudi Arabia between now and 2025. The international and the U.S. Gulf of Mexico offshore can attract a vast pool of investment in FIDs between 2022 and 2025. The company’s views are constructive in North America, but expect a deceleration in Q3.
In digital technology and cloud computing, it has made significant progress. SLB’s Delfi cloud-based digital platform and SaaS subscription model have increased by 60% over the past year. Its cash flows improved significantly in 1H 2023. With more than $1 billion in FCF, it has reduced debt and focused on shareholders’ returns. The stock is reasonably valued compared to its peers.


