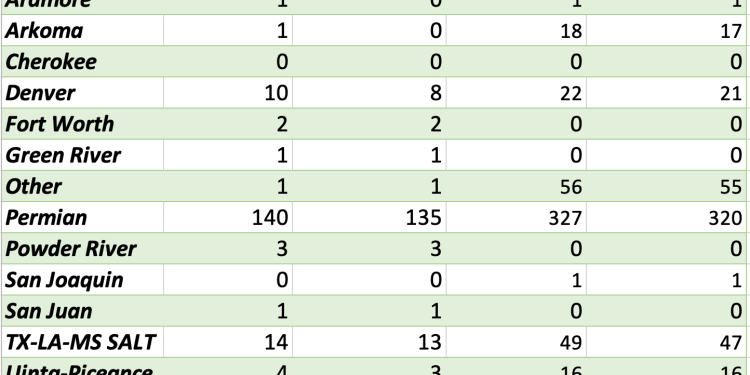
Completion activity took another leg down driven by seasonality and weather-related issues. Normally, the week before Labor Day through the Holiday experiences a bit of a drop. The extreme heat that Texas and the South have been facing will dissipate after this last bout. Based on the below chart, you can see some of the seasonal slowdowns in the smaller basins, while we get a sizeable drop in the Permian and West Texas driven by seasonal adjustments and weather. As we head into September, the Permian will quickly jump to about 145 with some increases in the Western Gulf region. There have been a few additional shifts from the Haynesville into the Eagle Ford with another 2 or so spreads pivoting out of the region. At $2.50 natural gas, E&Ps in the region have opted not to drill and instead wait for better pricing that will come in ’24-’25. Natural gas E&Ps have gotten more focused on cash returns and managing balance sheets instead of burning capital and prime locations on sub-par returns. This will keep natural gas completions depressed, and keep the total amount of completion crews a bit lower than normal.
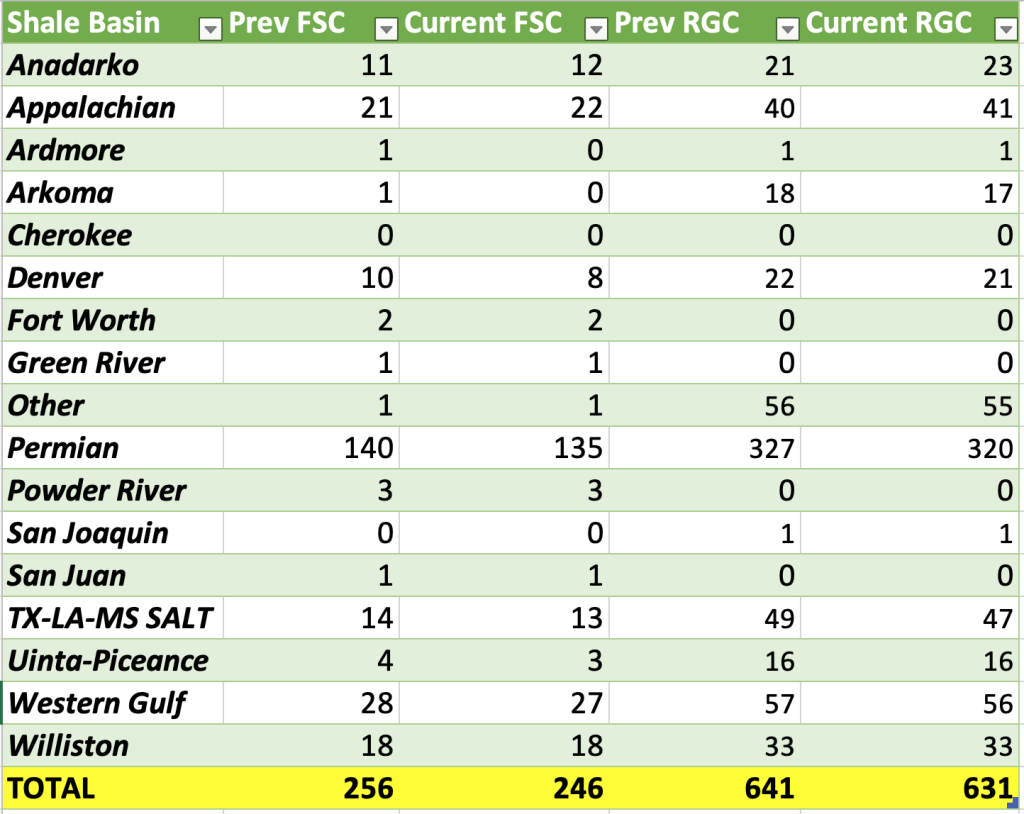
The below chart puts into perspective some of the seasonal drops we normal see at this time of year. We expect to see a bit of a bounce in Sept through October with another seasonal slowdown from the week of Thanksgiving through year end. Given the current trend in completions, we still hold with our exit crude rate of 12.5-12.6M barrels a day. If we hold to the lower end of the activity, we will have an exit rate at 12.5M barrels a day, and in order to come in at the higher end- we will have to have a sizeable jump in Sept-Oct.

As the Permian continues to consolidate, we are seeing more efficiencies being rolled out. We have discussed this as “manufacturing mode,” which won’t need the same level of equipment as it once did. This is why the need for 450 spreads is a thing of the past, and as simul-frac (dual frac) becomes more industry standard even 350 spreads will be a thing of the past. We have been saying for years that the U.S. crude production will peak at about 13M barrels per day given the demand for light/sweet crude, drilling/completion technology, and infrastructure. Our abilities could change again with a new way to recover more crude in place, but that would also require another round of spending on infrastructure. As we stand today- 13M is likely going to be the peak of U.S. production.
The market is already showing issues with excess condensate (naphtha), which also limits the number of crude companies will be looking to produce/export. The growing NGL demand in the market will keep the U.S. a pivotal part of the global energy markets, but it won’t require us to produce 16M barrels a day.
The crude market continues to be very range bound with our view of $83-$87 Brent holding firm at this point. There is now a significant amount of refined product being exported from China, India, KSA, and UAE to capitalize on the elevated crack in their regions. As Chinese product hits the market, it will push down some Asian prices and reopen the Arb coming East-West. There was a fire at Marathon’s Garyville, LA refiner that has caused a controlled shut down of operations. It appears that a storage tank caught fire, and it will take several days to assess the damage before normal operations can begin. This is a 450k barrel a day facility, and will reduce the amount of crude draws in the region (temporarily) while we see some additional pull down from storage.
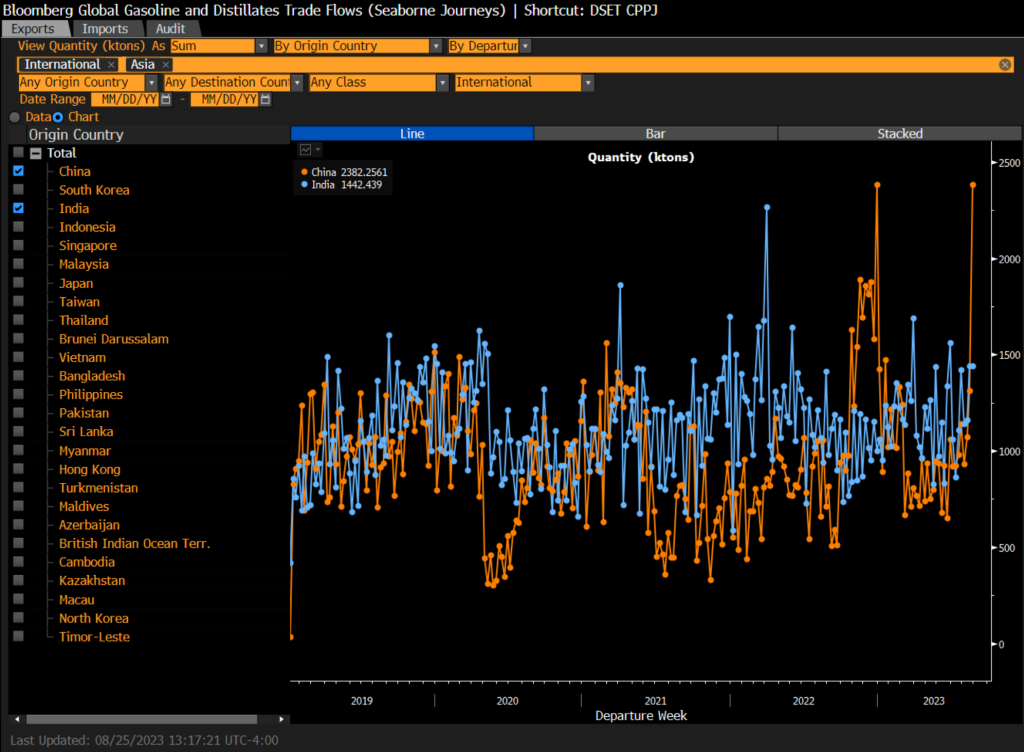
The crude markets remain range bound with little to shake them from the current trading range. While Saudi and Russia have pulled back on crude exports, there has been a sizeable increase of exports of crude from Iran and a big spike in product exports from China and India. The below chart puts into context how big the export of product has been from China over the last few weeks. There was about 27% of the 2nd batch of export quotas available, and this helps use up what was left and sets up well for the 3rd batch to be announced.
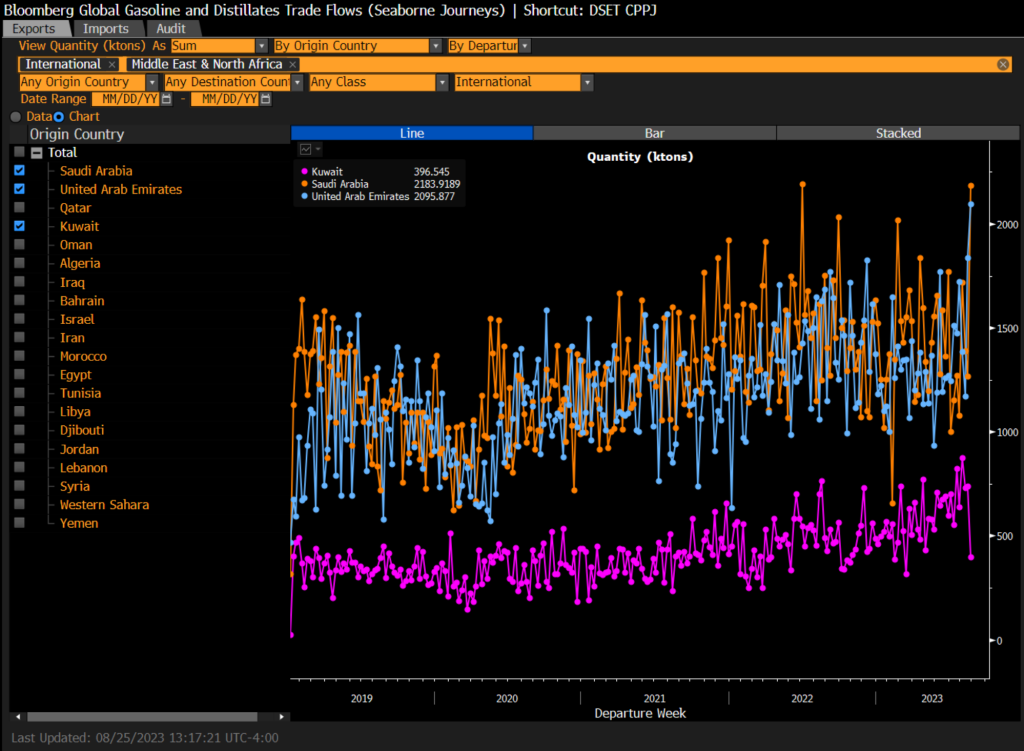
There has also been a sizeable increase of refined product from the Middle East- mainly Saudi and UAE- in the same time they reduced crude exports. KSA exported the 2nd most going back to 2019 of refined product while keeping crude exports lower.
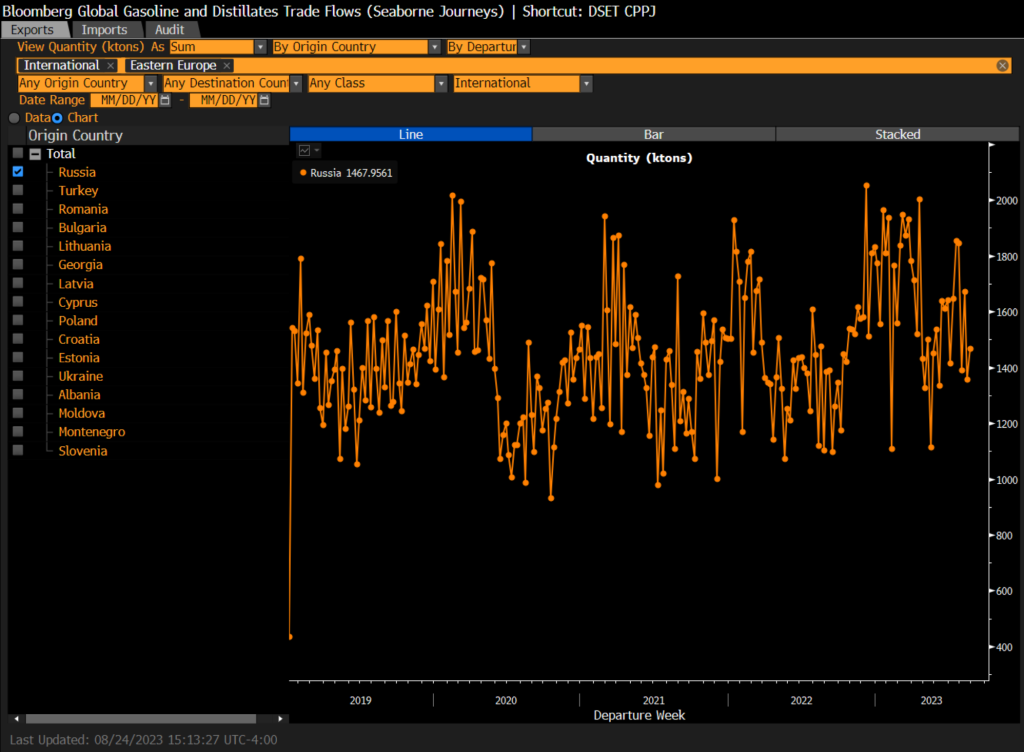
On the other hand, Russia has seen their refined product exports get reduced in the same time frame. Many of their buyers have flipped from importing to exporting, which has reduced some of the demand for Russian product. There was also a delay at the Bosphorus Strait (Turkish Strait) because of wildfires. Given the market backdrop, we don’t expect to see a huge push in exports from Russia.
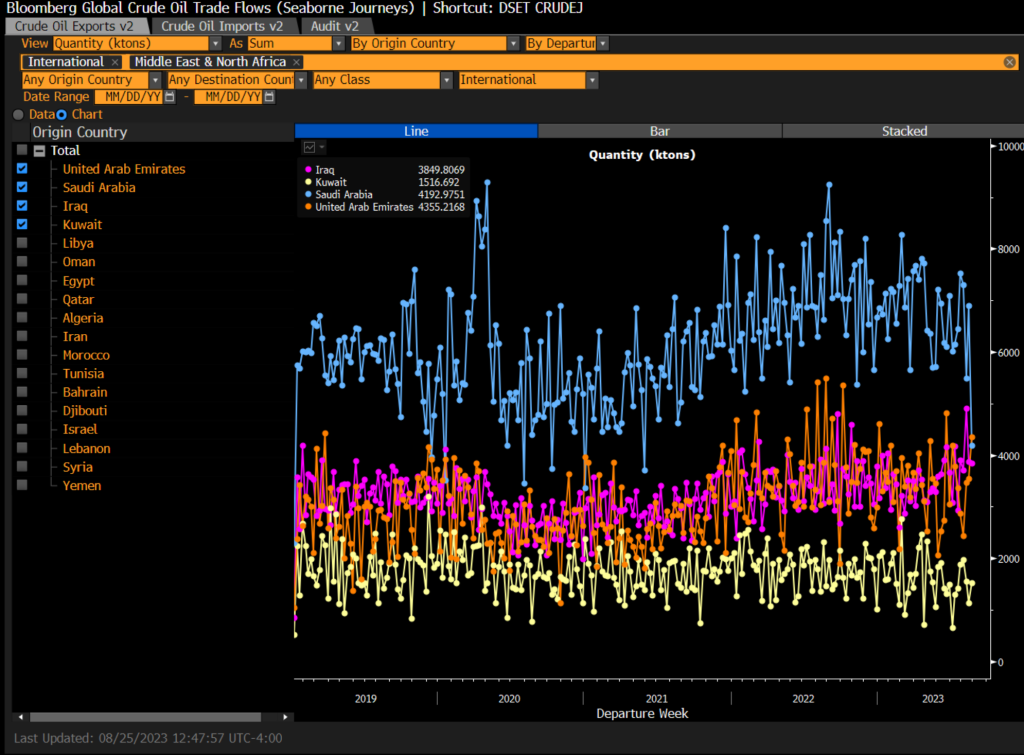
While KSA has pushed a huge amount of refined product into the market, they have pulled back on crude exports, which has helped keep the medium/heavy market fairly tight. The UAE and Iraq have been able to increase some of their crude exports in the timeframe given the pricing backdrop.
As the crude flows have slowed and product exports have risen, we are seeing a bifurcation in the market with the availability of product in specific areas. Europe is still sitting on a huge amount of gasoline that will make its way over to PADD 1(East Coast) over time while the Middle East and Asia start to see some bigger builds. The U.S. had a counter seasonal build with a limited amount of remaining draws, which will put us in a more “normal” situation as the comps get much easier. Typically, there are some sizeable draws as we head through Aug/September that we don’t see materializing this year. The arb for diesel from the GoM to Europe has also shut down, and we will see more builds in PADD 3 on the distillate front.
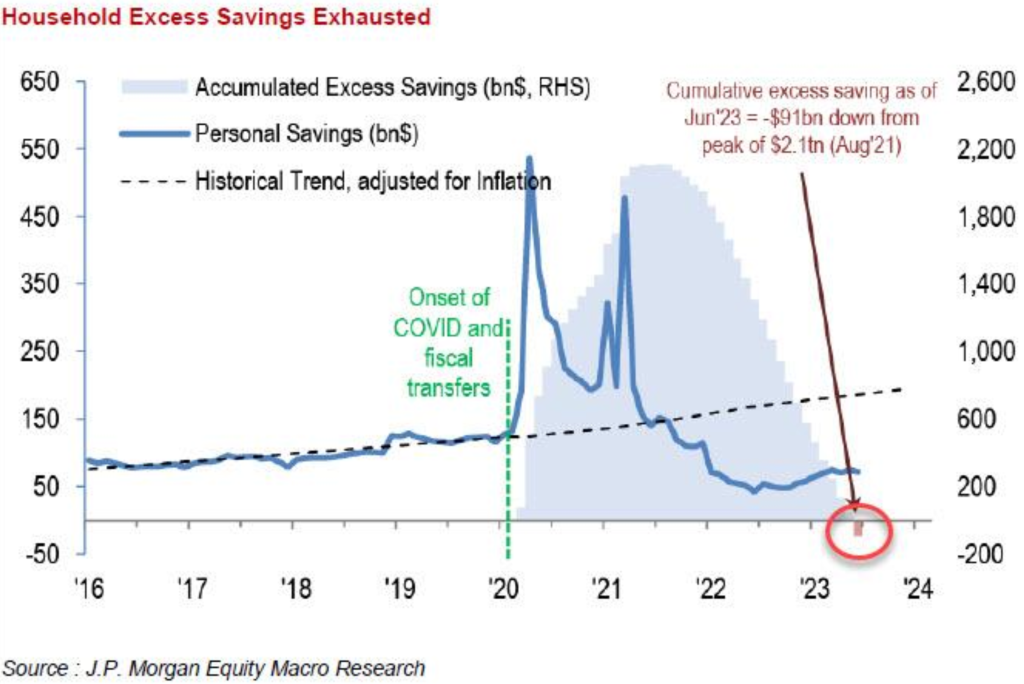
While we see some of these builds globally, the economic backdrop continues to point to more slowing demand. This is what will keep us “capped” on the crude price side, as we just don’t see a huge amount of demand materializing in the next 18 months. We have talked extensively about dwindled U.S. savings, and this chart is much closer to what we are expecting in the market. The sizeable increase in credit card usage was driven by the lowest 60% of consumers already working through their excess savings. There are some estimates that $300-$400B remain, but it’s likely sitting in the top 10% of U.S consumers and will remain locked there. The latest incremental pop in credit card usage was driven by that additional 30% relying more on credit.
We are starting to see those “cracks” in spending spread as service sectors are all slowing down rapidly. Our base case was for the manufacturing sector to stabilize at these levels (in contraction) with the service sector deteriorating quickly. U.S. Manufacturing PMI down to 47 vs. 49 est. & 49 in prior month; Services PMI down to 51 vs. 52.2 est. & 52.3 prior; Composite down to 50.4 vs. 51.5 est. & 52 prior … cost pressures regained some momentum as input price inflation quickened again.
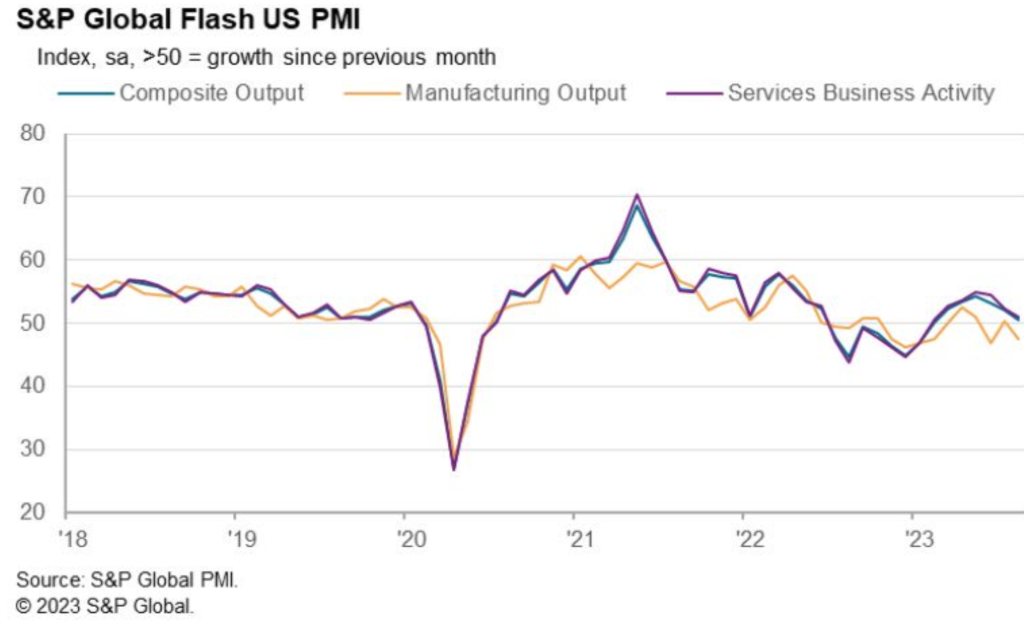
Our base case was for activity to slow but for price inflation to pick back up. All of the leading indicators we follow showed a broad slowdown in current and future activity while prices bounce back into expansion with additional increase over the next few months.
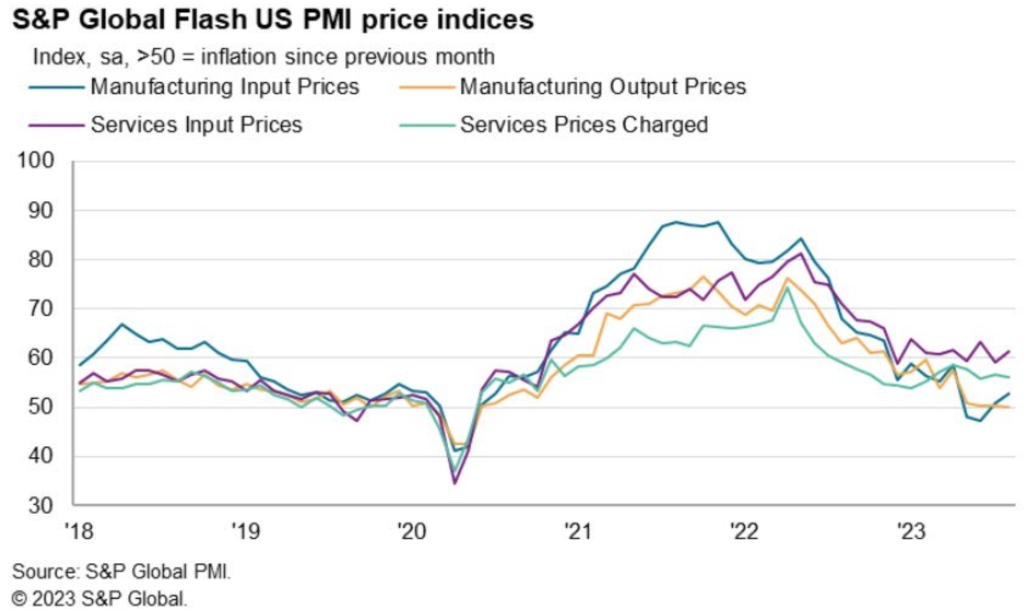
All of the surveyed prices ALSO show an increase across the board:

A very important leading indicator- order book- has deteriorated once again showing broad contraction.

Here is a closer look at the recent U.S. data:


Manufacturing will hang around the 47-49 range staying in contraction- but maintaining current levels. The new orders are showing the slowdown holding firm even as some industrial activity picks up in Aug/Sept. We believe it will be short lived with a depressed holiday spend season over the rest of the year.


Here are some key leading indicators on prices going forward:


A large part of these increases are being driven by energy prices and wages- with wages being VERY sticky when you look at the historical backdrop. The below is just an example of wages not only holding firm- but actually accelerating back to the high end.

Small businesses have been the life blood of hiring over the last few quarters, but it’s unlikely they will be able to keep pace as sales begin to slow and margins tighten. We have already seen CAPEX expectations cut and the inability to borrow impacting growth. This will cause hiring to slow.


Delinquency rates on consumer credit cards are pushing back to the highs hitting small banks the hardest. As student loan payments begin again, we will get another surge in delinquencies that will hit small banks again.

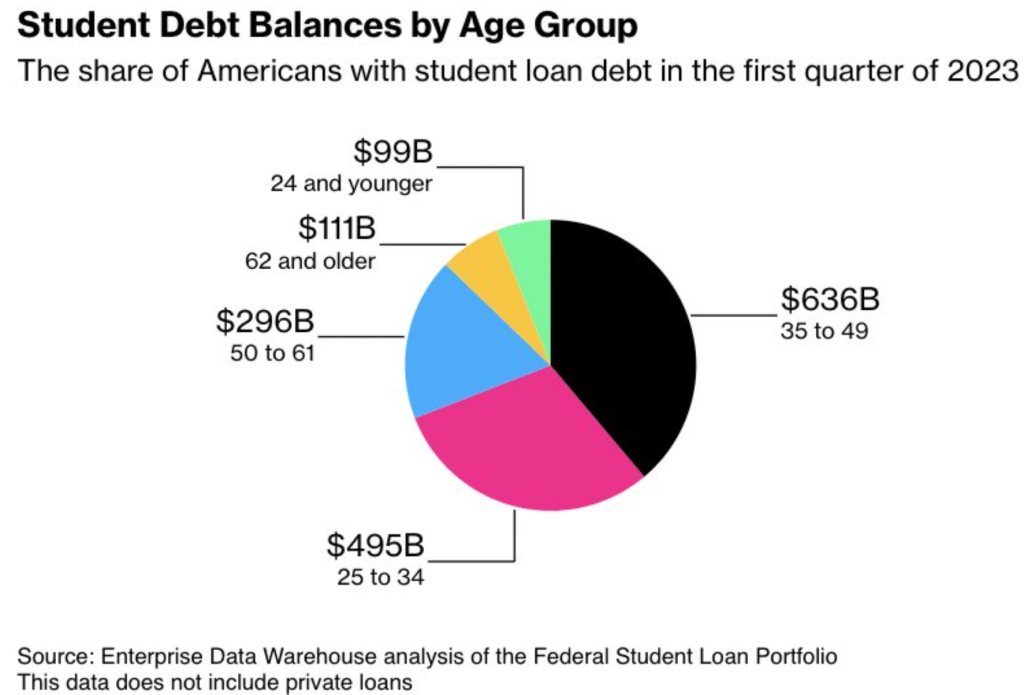
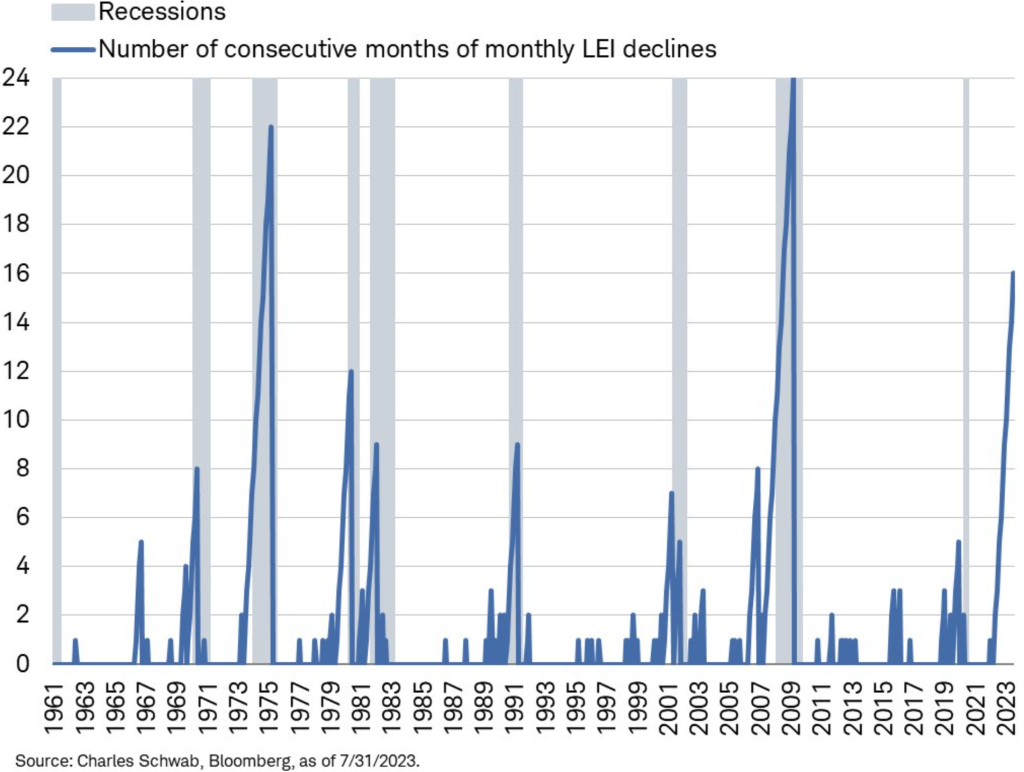
The leading economic index points to more pain ahead on the economic front, which will force the consumer to slowdown. “Leading Economic Index (LEI) from @Conferenceboard declined in July, which marked 16th consecutive contraction … streak that long has only been seen in recessions that started in 1973 and 2007.”
The Fed is facing another inflation increase while the labor market remains tighter than they want- even when you factor in the revisions. It takes time to see the impacts of rate hikes, but the turn higher in wages, home prices, and rent will be a huge problem for “Sticky” inflation. The spike in energy and food costs will keep the “flexible” inflation metric very strong as well in August at least with some residual in September as well.

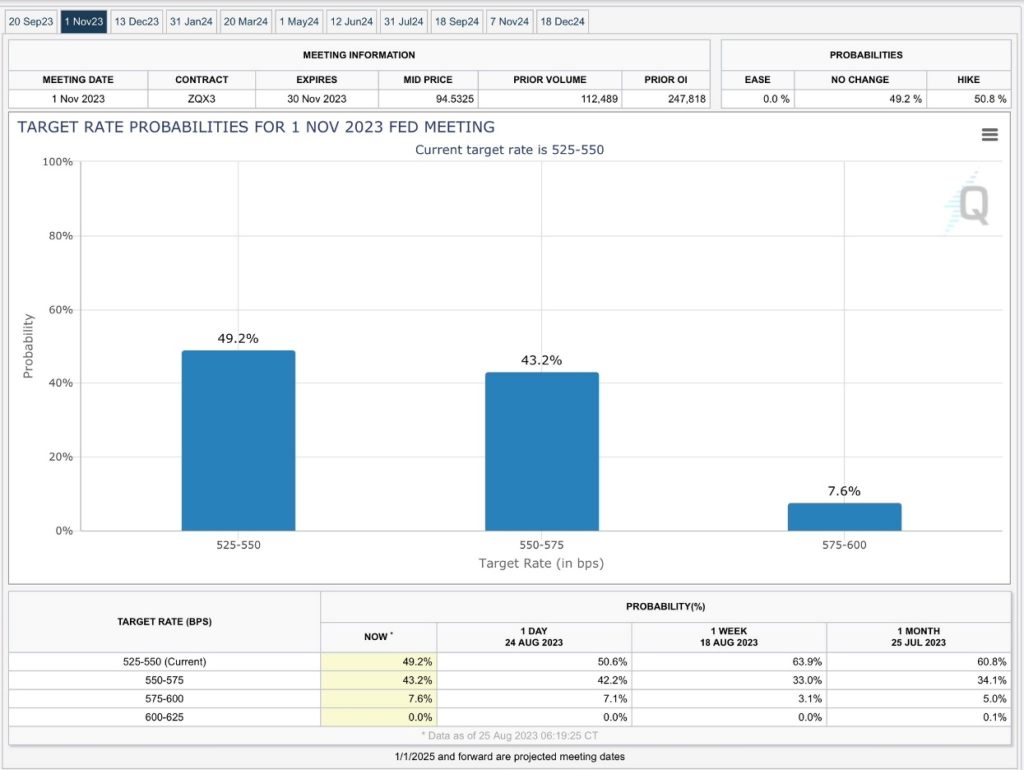
The market is starting to sniff out another raise in the Fed Funds rate this year in November, which has been our base case. We believe there is one more hike this year, and the Fed holding firm for at least 12 months.
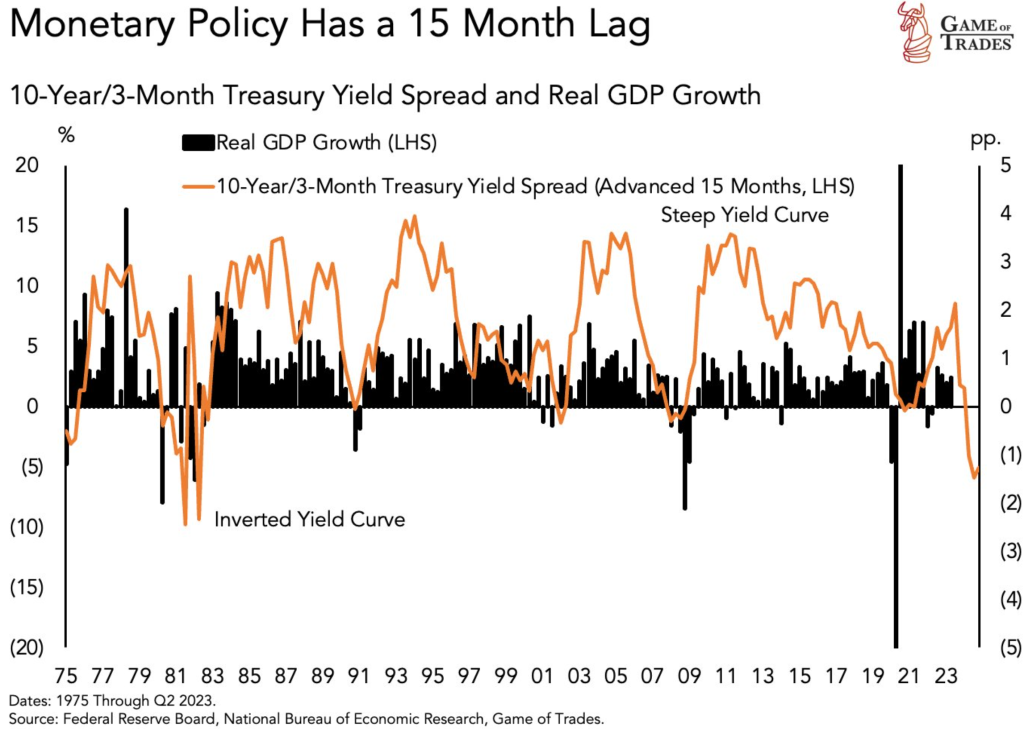
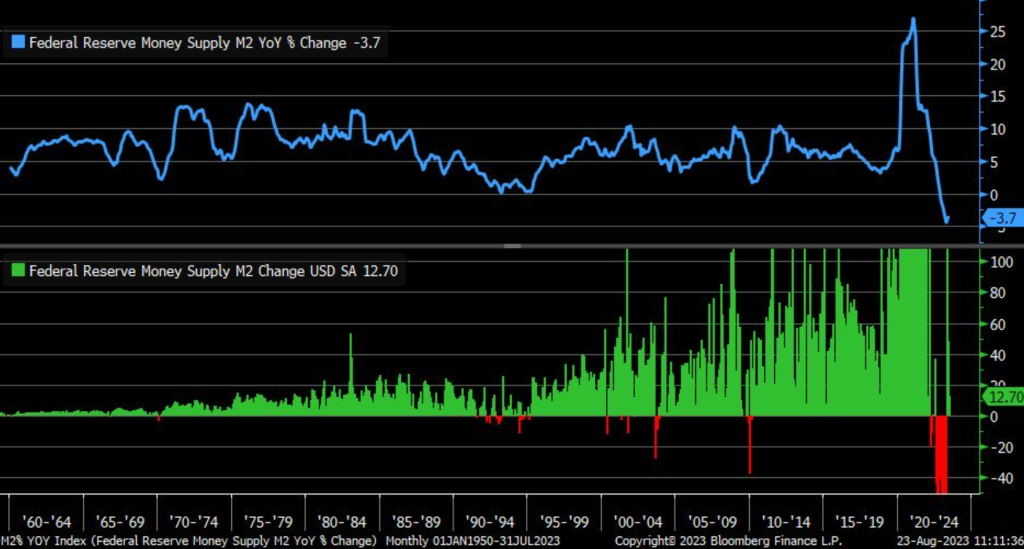
The two charts above put into perspective the length of time it will take to get the full impacts of rate hikes into the system. We need to deleverage- and the only way to do that is with higher rates and draining liquidity from the system. There is always “panic” around the drop in M2, but you have to put the reduction into context. We had a record amount of money injected into the system and have just barely begun scratching the surface of pulling it back out. “As of July, M2 money supply contracted by 3.7% year/year (blue) but increased by 12.7% month/month (green) … trend shift depends on timeframe, as it still looks weak in y/y terms (yet rate of change is improving), but good in m/m terms (yet rate of change is worsening).”
These are the expectations for the November meeting- I think we see the likelihood of a rate hike increase when August inflation comes in “Hotter” than expected with more follow through in September. The comps are getting “less favorable” on a year over year basis as the “disinflation” falls away and shows how bad the M/M data has really been in that same time frame.
This chart also shows the problems that remain in the system when we look at Core CPI and Core PCE. The stickiness with inflation is showing up in the PCE, which is the preferred measurement of the Fed. There is a lot of staying power across inflation, especially when you factor in hard assets/real estate.

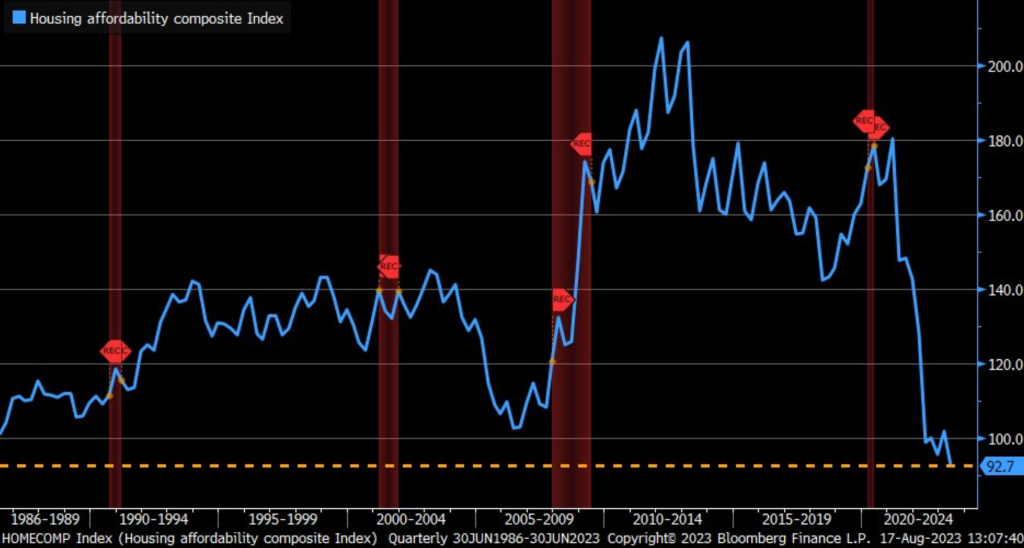
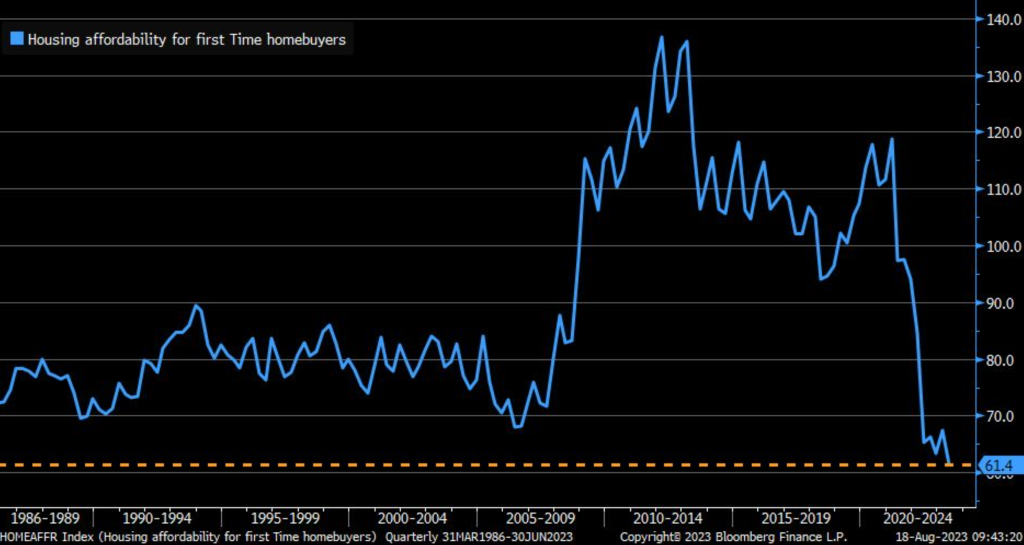
Home affordability has now hit the lowest on record, which is showing up across multiple metrics.
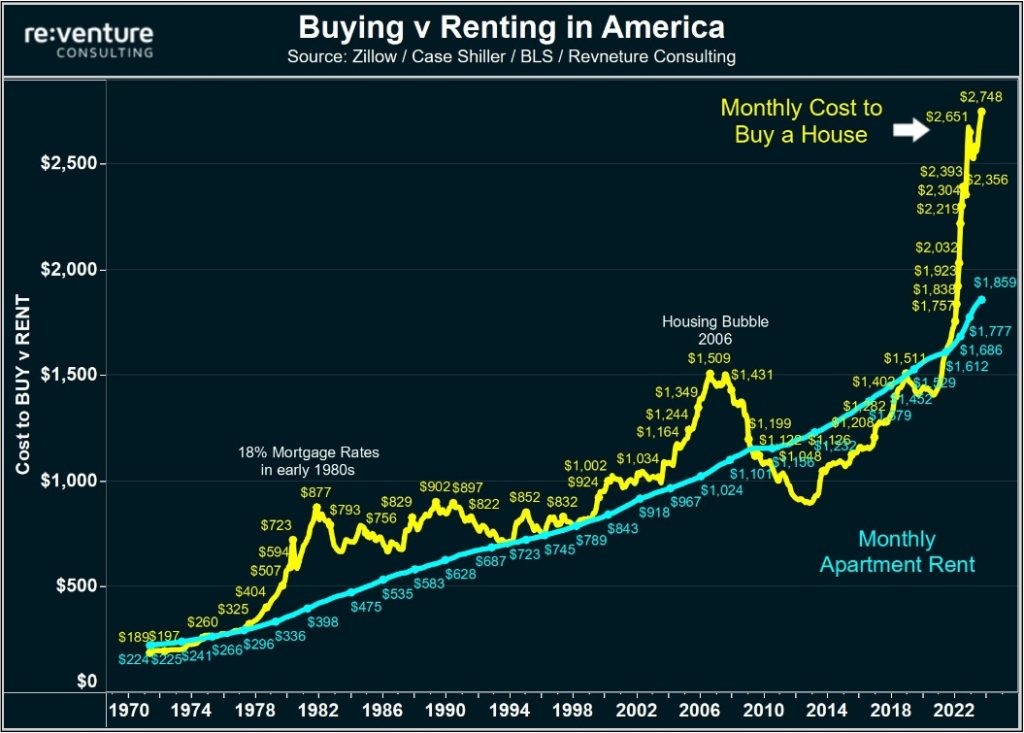
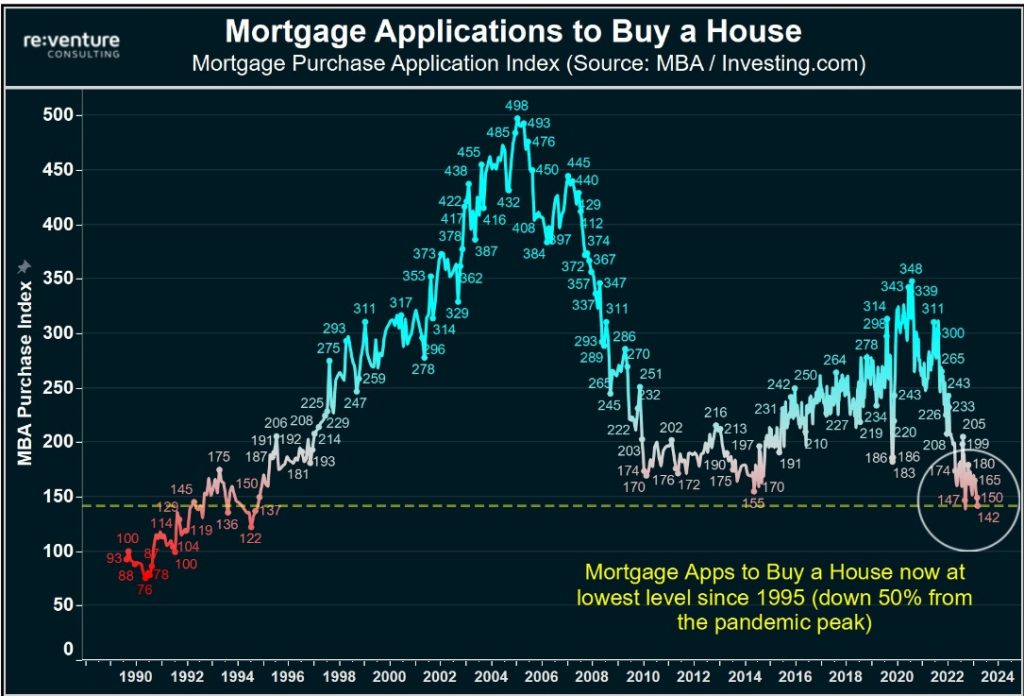
Housing Affordability Index from NAR fell in 2Q to its lowest/worst on record.
The picture doesn’t look any better for new homebuyers: “Housing Affordability Index for first-time homebuyers has fallen to lowest/worst on record per @nardotrealtor.”
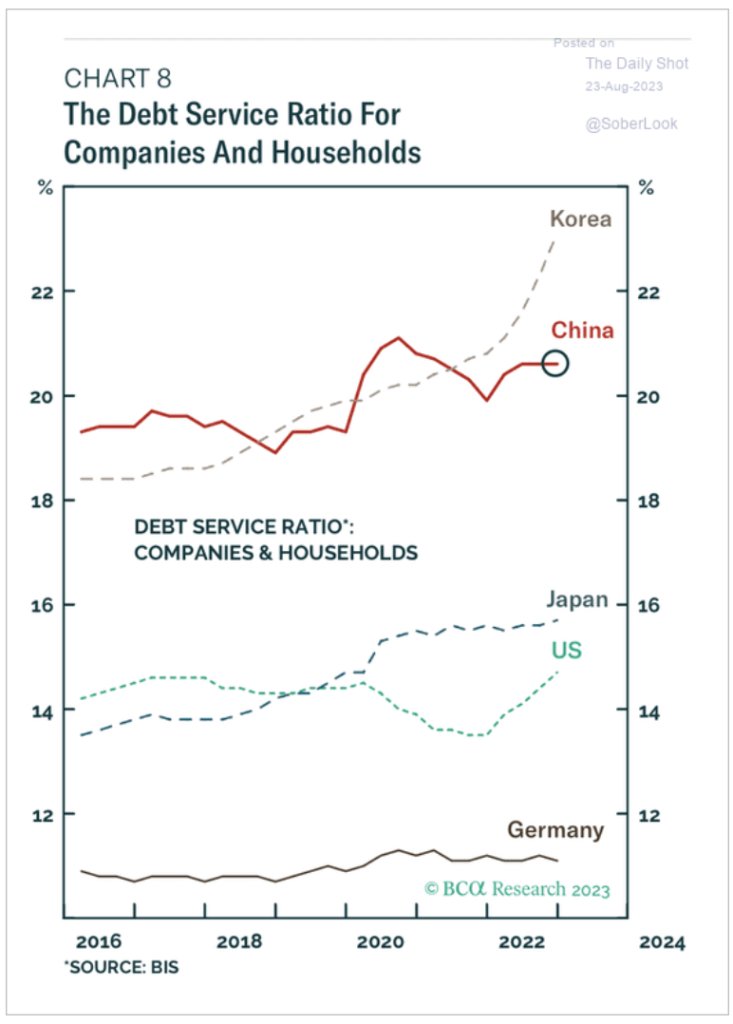
Even with how bad the U.S. right now, the debt service ratios are still “favorable” versus the next big juggernaut- China. Chinese consumers are buried under a mount of real estate loses- both realized and unrealized. Given the headwinds, it’s unlikely to see a meaningful reversal in their investments.
China is facing a structural problem in their debt markets that will keep the PBoC from unleashing liquidity. I think Michael Pettis does a great job in breaking some of this down: “This, in my opinion, is why the issue will be politically so contentious: “‘The underlying resistance is political,’ said a senior state banker. ‘Bridges and roads are built in response to calls for economic growth and poverty alleviation.'”
“Why,” he continues, “should the localities now shoulder all the cost on behalf of the central government?'” The surge in local government debt was the inevitable consequence of Beijing’s setting GDP growth rates far in excess of what the productive economy could deliver. And by passing much of the responsibility of achieving these growth targets onto local governments, Beijing left them with no choice but to engage in activity which was increasingly non-productive and would inescapably leave them struggling with debt. Among other things this means that “resolving” the debt isn’t just about uncovering hidden debt and finding ways to restructure it. It is most of all about abandoning unrealistic growth targets and accepting much lower, sustainable, growth rates, perhaps of 2-3% or less. For all the wrangling about who is ultimately responsible for the debt, the fact is that local governments are the only ones with enough assets to take on the cost of servicing (i.e. writing down) the debt. One way or another they will have to absorb the costs. But of course such a massive transfer cannot occur without massive changes in China’s political, business and financial institutions, especially at the local level. Adjusting to these changes is likely to be even harder, and less predictable, than resolving the debt.”
Our base case has been Chinese growth around 1%, and I believe we will see the data come in supporting that level of activity as regions struggle with the revenue to backstop LGFVs.
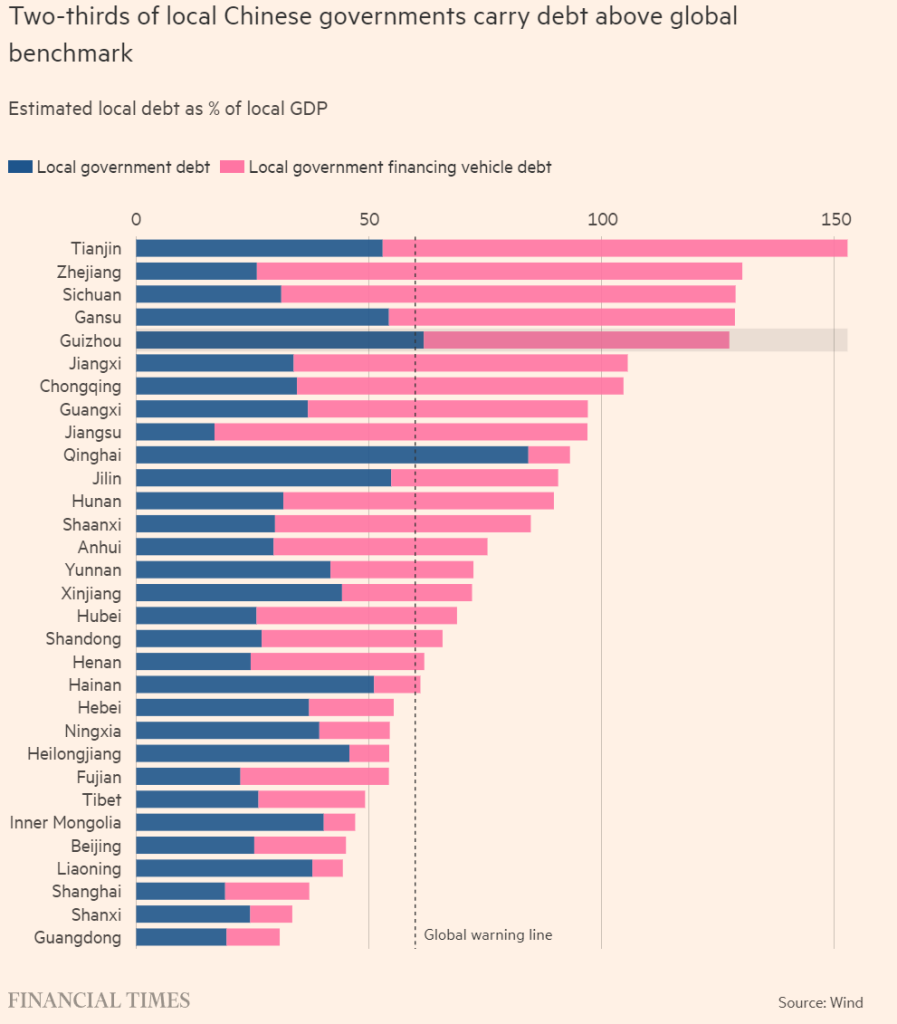
There is a push to extend the length of time of LGFV debt, but it would create a big problem at the banking level. They will have to adjust their portfolios due to the delay in principal and have to increase their liquidity on hand. They will also have to address a shortage in collateral as the length of time expands. “Experts are also expected to suggest increasing the maturity of loans to LGFVs to 25-30 years and cutting interest rates, giving LGFVs some breathing space to find new sources of revenue. Banks would indirectly absorb the costs. The risk of such restructuring has prompted some investment banks to reassess the ratings of state banks with high exposure to LGFVs. Commercial banks’ profits would be 6 per cent lower if 10 per cent of their LGFV loan holdings were restructured, according to a historical stress simulation conducted by Wang Jian, an analyst with Guosen Securities.”
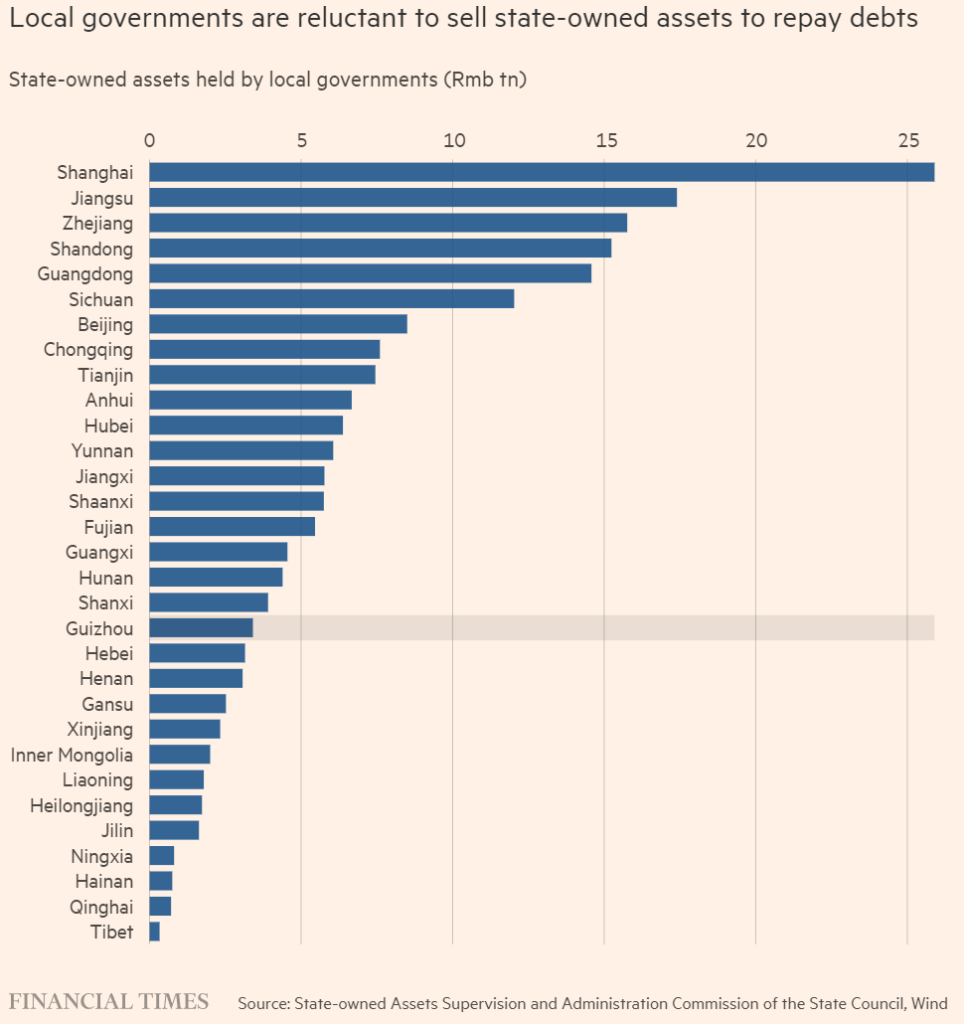
The below chart puts into perspective the losses the market is facing on the real estate side.

It’s also one of the reasons local governments aren’t in any hurray to sell additional assets- 1) the price isn’t worth it 2) they don’t have anything left to sell.

An overarching theme that has to be watched, the younger generations getting disenfranchised with the CCP. As jobs are hard to come by and stress grows, they will get “Angrier” at their options.


I think these two charts put into perspective the problems the CCP faces that are a big part of the structural issues they face. We have also seen another drop in consumer confidence, and based on recent data, it doesn’t appear to be shifting anytime soon.
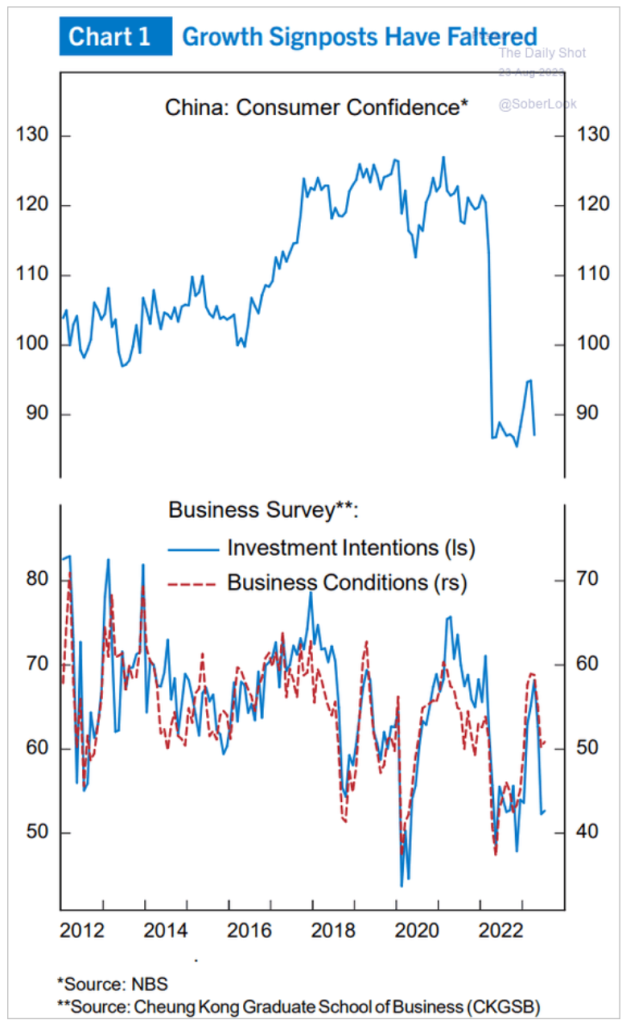
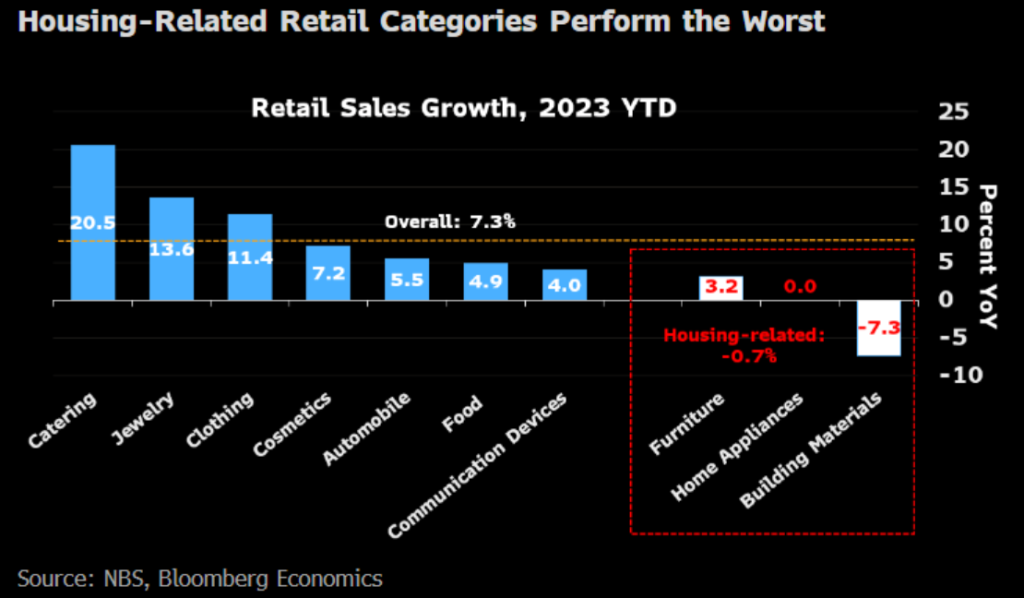
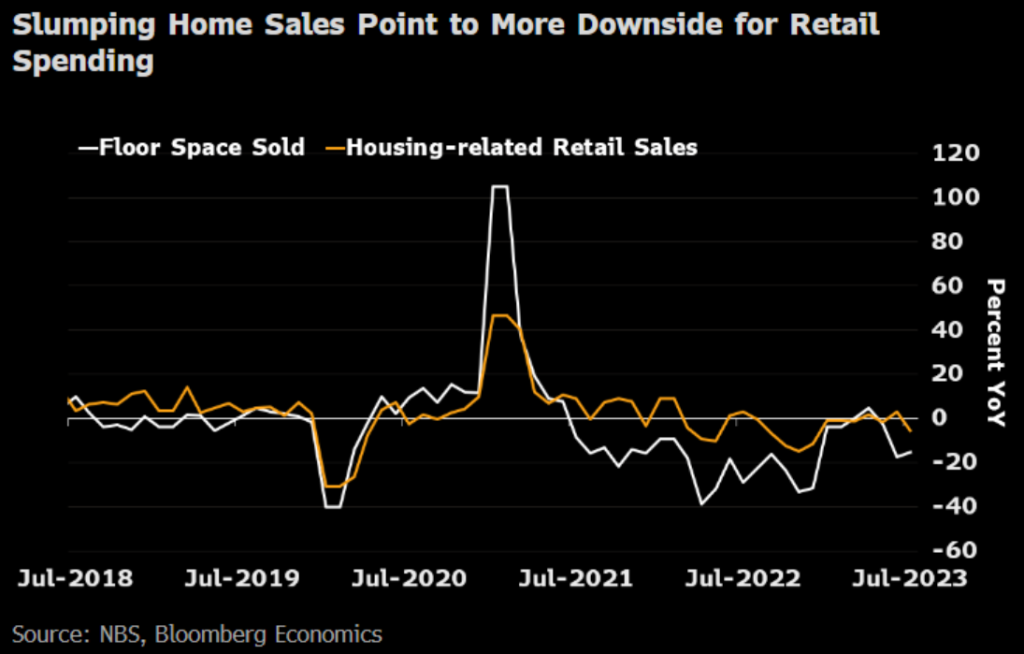
Our base case has been that the consumer sits on the sidelines for an extended period of time. There are a lot of reasons for them to sit on the sideline, and I think this is an underappreciated one: China’s housing slump is hitting consumption, one reason the recovery has disappointed this year. The impact of the property crisis on investment is well recognized. The effect on consumer spending, less so. But one channel is clear — spending on home appliances, furniture and building materials has dropped with the property downturn.
- We estimate this has put a direct drag on retail sales growth of 0.6 percentage point over the seven months through July.
- That’s not huge. But our analysis leaves out impacts from blows to wealth, jobs, wages and confidence from the property crash. The effect is likely to be much larger if those are considered.
- The upshot — any full-fledged recovery driven by consumption will require a steadier housing market.
The PBoC is focused on reigning in debt and trying to manage these structural problems.

The above chart shows the issues in the debt market, and while they will provide some support- it will be limited. The PBoC kept the 5 year rate flat and didn’t cut the 1-year to the level the market expected.

The PBoC is fighting to keep the CNY from an uncontrolled collapse with continuous support, and it’s important for them to maintain rates to help keep the CNY steady. We will have more to come on the USD, CNY, and JPY dynamics because the US dollar is FAR from being removed!

