I expect to see Brent prices sit around $72-$78 in January and weaken further to $68-$74 in February. Depending on the data, we could see a brief drop into $68 before February, but with the amount of geopolitical risk bouncing around- I don’t believe it’s likely. March should see a bit of a recovery in pricing back to the $72-$78 range, but I don’t see a meaningful/sustainable bounce above $78. We have had several very big escalations in the Middle East, and yet we haven’t been able to hold Brent above $78. This speaks more to the weakness in demand, and there isn’t the political will nor desire to have OPEC+ continue to cut volumes. Russia is still pushing a sizeable amount of crude into the market that is struggling to find a home and sent a big jump of diesel into the market out of Primorsk. This is coming on the back of a slowdown in buying from India and China, which will complicate things going forward for Russian sales. The sanctions aren’t going to work- the decline in demand will though. This will force Russia to cut pricing for their crude to keep flows moving, and I expect them to maintain their exports above the OPEC+ cuts.
On the demand side, we have seen India reduce the amount of crude being purchased. This is likely more seasonal, but there has been a drop in total demand that will reduce Q1 purchases versus last year. In China, “China has released 179.01 million metric tons of crude oil import quotas for 2024, 60% more than the January batch last year as almost all the refiners received their annual allocations, consultancies and trade sources said on Tuesday. The latest move marks a shift by Beijing, which has been releasing quotas in batches every few months since it opened up crude imports to independent refiners in late 2015. Uncertainty over quotas could hold refiners back from buying more crude when prices are low or ramp up purchases to meet higher demand. Forty-one companies, mostly independent refiners were given the fresh quotas, trade sources and consultancy JLC and Longzhong said. The quota issued in January last year was 111.82 million tons. These independent refiners now make up over a third of total imports into the world’s largest buyer as more large, integrated refiners have joined the fray in recent years. The January allocation, equivalent to about 3.6 million barrels per day, is still short of the 203.64 million tons or 4.07 million bpd issued for 2023 and traders said there would be at least another batch to be issued later in the year. The 2023 volume included an odd tranche released in October 2022 in advance for 2023 and was 14% higher than 2022.”
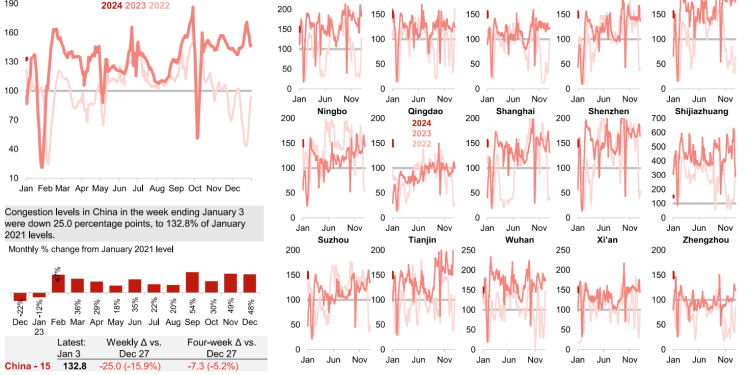
The China imports is a bit of an increase, but we have also seen a sizeable increase in exports- especially as local demand has slowed. I expected to see additional export quotas as the amount of product builds within the country. Russia is still exporting product at a four-month high, and as additional Chinese product comes to market there will be more pressure on crack spreads. The driving data has already slowed around the world with China being no different. As manufacturing remains in contraction, we will see another drop in distillate demand.
The crude markets have been bouncing around buoyed by geopolitical risk and underlying tensions rising around the world. The Houthis continue to launch attacks across the Red Sea, with the U.S. and her allies answering distress calls trying to protect current traffic. The U.S. most recent responded to a small boat attack on a vessel that resulted in three out of four Houthi vessels being destroyed and 10 sailors killed. This was enough to put another pause on traffic through the region after Maersk paused Red Sea transits once again.
- “Maersk has paused shipping through the Red Sea until further notice after one of its vessels came under attack from Houthi militants over the weekend.
- The decision by the Danish shipping giant extends a 48-hour pause implemented in the immediate aftermath of the assault.
- Repeated attacks by Houthi militants on vessels in the Red Sea have raised concerns about disruptions to global trade through the key waterway.”[1]
“The market is going to remain volatile with the amount of geopolitical risk swirling around the Red Sea and some recent protests in Libya. There was also a strike within Beirut, Lebanon where senior members of Hamas were killed. Israel saw this as an escalation on the part of Lebanon as they “allowed” Hamas senior leaders into the country to meet with Hezbollah operatives. It also points to the level of intelligence Israel has been able to gather on meetings of these high-level individuals. Another recent attack occurred in Iran on the anniversary of Soleimani’s death. It happened near his grave and another location resulting in an estimated death of 84 individuals within Iran. It was during a ceremony in the southeastern town of Kerman. ISIS has claimed responsibility, but it’s unclear who carried it out officially. The U.S. has also been launching counter-attacks throughout Syria and Iraq following rockets, mortars, and missiles fired at positions. “A U.S. official said Washington conducted a “precision strike” on a vehicle traveling in eastern Baghdad, targeting a member of the Harakat al Nujaba group that the U.S. has been tracking. The group is designated by the U.S. as a terrorist organization. The Pentagon didn’t immediately respond to a request for comment. Harakat al Nujaba said in a statement on its Telegram channel that Moshtaq Talib Al-Saadi had been unjustly killed by U.S. aggression. Iraq’s government said that the attack was a blatant violation of Iraq’s security and sovereignty and “undermines all agreements between Iraqi forces and coalition forces in Iraq.”[2]
I’ve been saying that the response from the U.S. would happen, but it would be delayed. I’m surprised it was this late, but it was always going to be a “high value” target to send a broader message. Iran has responded by quietly telling their proxies to “slow” attacks on U.S. assets. This may happen in Iraq and Syria, but the Houthis have continued to fire missiles and drones into the Red Sea. “The Commander of the U.S. Navy’s 5th Fleet, Vice Admiral Charles B. Cooper II has stated that Houthi Terrorist Group in Yemen launched a Naval-Surface “Suicide” Drone into a Commercial Shipping Lane in the Red Sea today, in the First Attack of its kind by the Houthis who usually use Aerial Drones and Missiles; the Drone reportedly Exploded off the Coast of Yemen not causing an Damage or Casualties in what is believed to be 25 Attempted Attack on Shipping Vessels in the Region since October 7th.” “VADM Cooper further stated that despite the “Final Warning” issued yesterday by the United States and Coalition in the Red Sea it does not appear that the Houthis wish to Cooperate.” At this point, I expect to see U.S. and allies starting to hit launch points for missiles and docks at the ports being used to carry out attacks. I don’t believe we will see Iran attempt to back the Houthis, but the activities in Iraq and Syria will be the biggest gauge of Iran involvement.
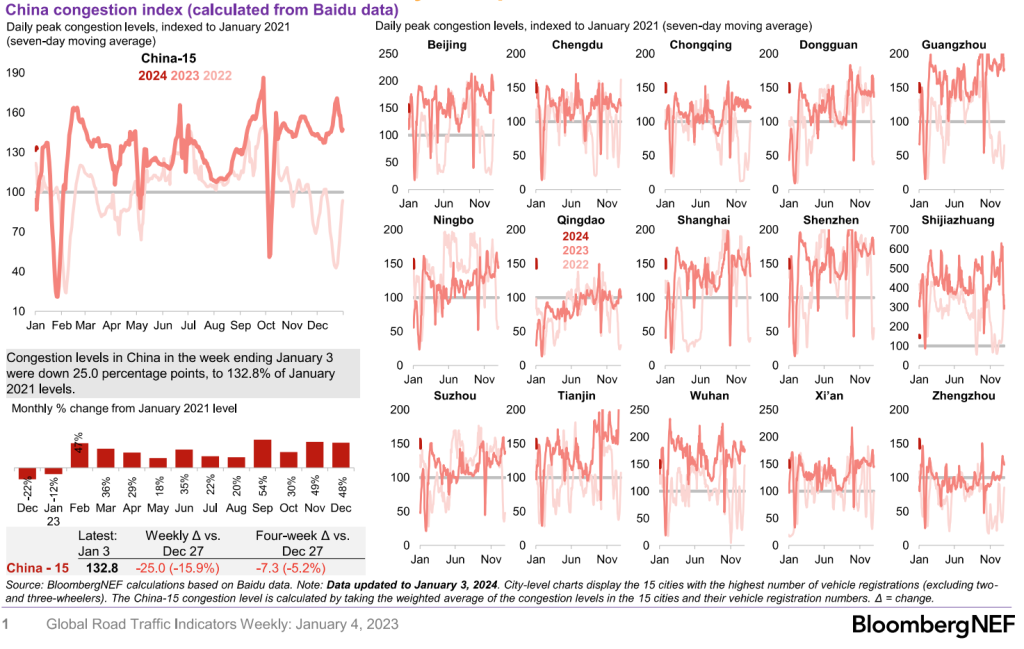
The U.S. will have to decide how aggressive they want to get in deterring future attacks from Yemen. Without crippling their ability to launch boats, missiles, and drones, it will be near impossible to bring traffic back through the Red Sea and through the Suez Canal. The below picture puts into perspective just how little traffic is moving throughout the region.

The shift around Africa adds over 3k nautical miles to the trip, which adds to underlying shipping times. This is straight cost when factoring in insurance, day rates, and other inherent costs. It becomes inflationary as the additional price is passed on to the consumer. This will impact Europe more than anyone else, but it the longer sailing times will reduce the number of available ships for everyone else. This will become inflationary for everyone, but the biggest hit will be Europe.
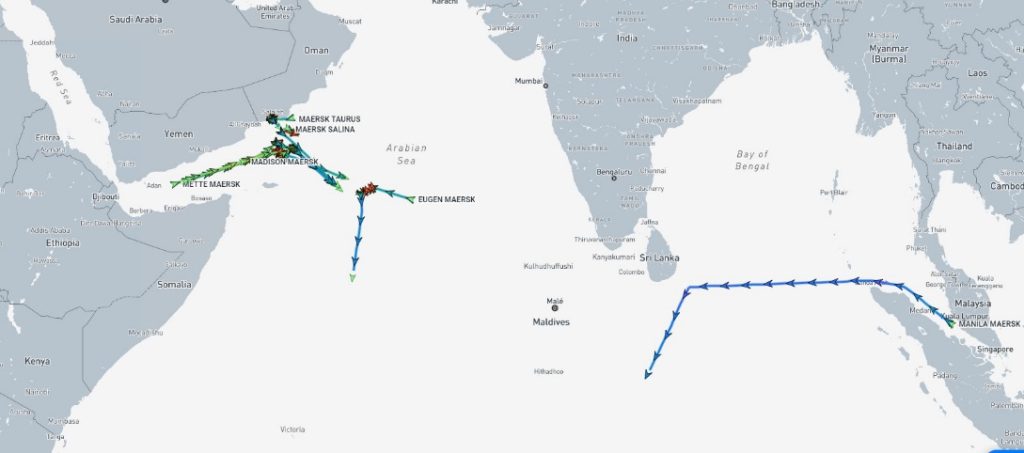
The picture above just strengthens the view that many ships are doing an “about-face” and pivoting to go around Africa. The below chart gives you an idea of the cost increate that we are seeing around the world- it’s hitting Europe the most- but no one will be able to avoid the pressure.


Here is a good snapshot of the impacts:
- Container shipping rates skyrocket 173%
- Carriers divert +$200 billion in trade from the Red Sea due to Houthi militant threats
- Shipping a 40-foot container from Asia to northern Europe now costs over $4,000, up +173% Supply-chain issues back.
- (Important to note: cost of shipping from Asia to northern Europe AND to Mediterranean cost 2x more than the levels in January 2019, but are still well below their peaks during pandemic)
The shift in flows will be supportive of U.S. exports as Europe pulls more from the region instead of the Middle East and parts of Africa. The demand for Middle East crude is starting out fairly sluggish as other countries see their physical prices move lower. There are several parts to this reduction in ME crude flows:
- The inability to move through the Red Sea has caused a shortage of volume through the Suez Canal as well as through the Sumed Pipeline. “Crude inventories at Sidi Kerir (Egypt) are at their lowest level since 2018 for this time of the year. (Kpler data)”

- Pricing structures favor a delay in purchases- especially as expectations grow of an OSP cut for February. Part of the belief is driven by the below shift in structures.
How long-term contracts are structured from KSA to Europe:
Saudi long-term Contracts in Europe are weakening because European refiners see KSA prices being to high compared to the actual value of their crude oil. The main reason that KSA crude is expensive is driven by Saudi using it to limit demand for their crude during a period where they are cutting production trying to force prices higher. This suits Saud as they can focus on Asian markets, but it creates a growing problem for their flows to Europe. For European’s, market structure becomes just as important as how much they can minimize the volume they take on the long term. This is where cheapness comes into play and dates of loading come into play.
Saudi cargoes are priced using Brent futures averaged over the month. In this regard, the price of when you buy the cargo does not matter as it will be the same price whenever it loads. What matters is the price versus other cargoes in the market and therefore the market structure. Under the long-term contract, you need to buy a cargo no matter what. When comparing them against other cargoes, you must look at the market structure; particularly the weekly CFDs- the difference between Dated Brent and Brent futures. In a contango market (like now), the weekly CFDs are more expensive later in the month than at the beginning. Therefore, it means dated is cheaper at the beginning of month and more expensive at end relative to brent futures.
It’s better to buy Saudi crude oil at the end of the month because it’s relatively cheaper to other crude oils than it is at the beginning. Saudi crude price is fixed throughout the month, so the difference between dated brent and brent futures matters. A refiner can save more by buying non-Saudi cargos at the beginning because they are relatively cheaper vs Saudi than they are at the end. So, a European refiner will nominate an end of month loading.
In a backwardated market, dated Brent is more expensive at the beginning of the month than the end. So, it’s better to buy Saudi cargoes at the beginning because they are relatively cheaper than at the end versus other cargoes.
Sidi Kerir can become low when the market moves from backwardation into contango because the flow to European refiners sees purchases bought at the beginning of the first month and at end of second month. It leaves few cargoes moving during the middle period. As is the case now.
Sidi Kerir is being impacted on both fronts, but the demand in European crude has fallen. This has allowed for CPC, U.S., and Libyan crude to fill a large part of the demand as well as some cargoes coming from West Africa.
When we look at last month, Dec cargoes were purchased in backwardation so Atlantic Basin buyers wanted beginning Dec ME cargoes as cheapest with average month pricing. Therefore, most of cargoes would already pass Suez. This is pivoting now as we head into January, and what looks like will persist over the next few months at least. Jan cargoes were bought under contango so customers would buy end of Jan cargoes as they are the cheapest. ME grades are very expensive compared to other cargoes, so the flow of oil has changed. More flows North to South than South to North, which is also an effect of Russian war and U.S. volumes. We expect to see a steady flow of U.S. volumes moving into the market given current production levels in the U.S. and large drops in total demand.
Middle east crude was very expensive so demand is still not strong from LTC holders, and they will take the contractual minimums. Demand for grades such as Johann Svedrup was weak in Dec so there was a decent amount of crude available. This started to be absorbed in the beginning of January with some strength in pricing. There is always changes into year-end as refiners minimize the amount of oil they hold on their books for accounting purposes. Many cargoes will transfer title to the buyer in the first five or so days of the new year.
Crude prices spiked at the beginning of the week because of Libya’s El-Feel oil field being shit by protests, but this appears to be a short-term situation. Libya also reduced their OSPs for the month, which will help keep them more competitive versus other OPEC members- especially GCC nations.
- Libya cut the Es Sider OSP for January to a discount of 60c/bbl to Dated Brent, according to a price list seen by Bloomberg
- January price was the lowest since April and compares with -20c for December
- Sharara OSP unchanged at premium of 30c/bbl
- OSPs for Mellitah, Al-Jurf, Bouri also unchanged, while prices for other grades were cut by 20-40c/bbl
To support the previous comments on purchases, we have seen softening in the Middle east while prices in Europe remain somewhat elevated.
PLATTS:
- Johan Sverdrup, FOB:
- Equinor sold to BP for Jan. 24-26 at +$2.80/bbl: traders monitoring Platts window
- Price was the highest since late October, compared with discount of more than $2 a month ago
- BP also bid at +$2 for Jan. 30-Feb. 6, much higher than its previous bids at +$1.20 on Wednesday, and +40c on Tuesday
- Equinor sold to BP for Jan. 24-26 at +$2.80/bbl: traders monitoring Platts window
- WTI Midland, CIF Rotterdam:
- Total bought from Petroineos for Jan. 16-20 at Dated +$1.90/bbl
FORWARD CHAINS:
- Equinor put WTI Midland cargo for Feb. 5-7 into chains; cargo was kept by Gunvor: person with knowledge of matter
- Cargo to be loaded from EHSC terminal at Houston
In the U.S., Texas has an ad-valorem tax that keeps refiners and companies from building crude stocks in the region. This causes a sizeable drop in PADD 3 crude storage, and usually leaves more crude in floating storage and builds products. This will quickly adjust over the next few weeks as crude imports pick back up and products balance out a bit.
The bigger issue that is playing out is the slowdown in underlying demand. This is driven by economic problems that have carried over from 2023. The data has already kicked off problematic with December ending slower than I think the market expected. While the economic data remains soft, the key pieces of jobs and inflation are steady- especially in the U.S. Chinese data has also come in below expectations, but more importantly, well below market expectations.
I’ve been highlighting how Chinese “stimulus” was going to fall VERY short of driving economic growth. The two main reasons behind that view are: a structural problem in real estate and government investment and the law of diminishing returns. The Law of Diminishing Returns is caused by the gross mis-alignment of lending by the government.
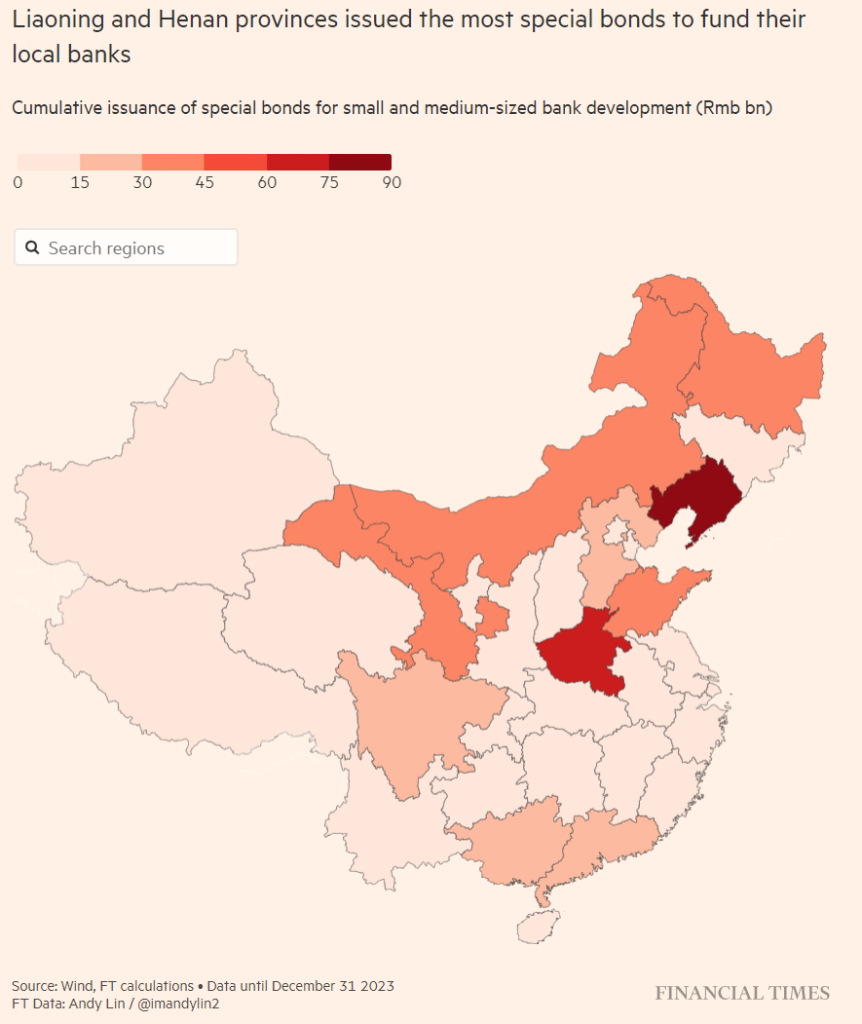
“Chinese provinces pumped a record Rmb218.3bn ($31bn) of capital into fragile regional banks last year using special-purpose bonds, in a sign of concern at the risks within one of the world’s most important financial systems. Sales of bonds that are used to boost the capital buffers of regional lenders more than tripled in 2023 from the previous year, according to data from Chinese financial data provider Wind. The bonds, which are sold by local governments and whose proceeds can only be used to put capital into banks, are also being used to hasten mergers of weak lenders in China’s indebted regions, which are struggling to cope with a long-running property sector crisis. The bonds were introduced in 2020 to help banks through the Covid pandemic. The acceleration of funds being channelled to regional banks underlines Chinese authorities’ concern over their systemic importance at a time when the economy has slowed.”

The problem in the Chinese banking system is structural with leverage ratios averaging over 30x, collateral double or triple booked, and banks owning each other’s perpetual debt. The PBoC created a “stability” fund to provide some assurance, but the amount of contagion is sizeable given the linkage through double booked collateral and perpetual bonds. Provincial governments have stepped in to provide some liquidity, but it’s just shifting the balance of payments into an already over-levered provincial government. This new debt has a multiplier effect well below 1, which means that the debt won’t be able to cover principal- let alone interest. Once you enter the bigger spiral under the “law of diminishing returns,” there will need to be a purge or structural change in the fundamental problem because new money will only make the problem WORSE- or in economic terms- a “negative util.” Even a fresh cash injection from outside the country would fail to bridge the gap.
The banking system has a lot of interconnected levels:
- Companies have used the same collateral pledge for different loans/bonds between banks and consumers.
- The same banks that are “sharing” the collateral also own each other’s debt.
- Leverage ratios are already high, and when you take away or reduce collateral backing debt- the leverage situation gets exponentially worse.
Provinces have been issuing more SPBs to back the local banks and forcing them to consolidate in an attempt to strengthen the system. Many of these provincial governments are already saddled with a huge amount of debt, and this is just layering more pain onto their balance sheet.
There has always been a shift in the shadow banking world, but it just took a big hit with the bankruptcy of Zhongzhi Enterprise Group. I highlighted on the Econ show that this organization was at significant risk of failure, and this just solidified what we expected. “Chinese shadow banking giant Zhongzhi Enterprise Group Co. filed for bankruptcy, cementing the rapid downfall of a firm that oversaw more than $140 billion at its peak before succumbing to the property crisis that has wreaked havoc on the world’s second-largest economy. Zhongzhi said it “obviously” lacked the ability to repay its debts, according to a statement Friday from Beijing’s First Intermediate People’s Court, which accepted the case. An audit found Zhongzhi’s debts were as much as 460 billion yuan ($64.3 billion), compared with assets of 200 billion yuan, according to a letter to investors in November. The downfall marks one of China’s biggest-ever bankruptcies, putting more stress on already fragile consumer and investor sentiment. The property slump, weak domestic demand and sluggish trade are all weighing on the economy, while its benchmark stock index has plunged three years in a row.”
China will be announcing their economic targets within the next few weeks, and I expect to see a reduced target as we progress through 2024. The structural issues are broad, and will require changing policy and time in order to clear out non-performing debt. Another huge issue for China is the demographic pivots making things harder to adjust. The ’Great Catching Up’ has come to an end, at least in recent years. There is a growing view that ‘China will get old before it gets rich’ are at play here. But another crucial factor is that China is less capable of throwing massive amounts of debt at its economic woes than in the past driven by the Law of Diminishing Returns. The growing issue of debt sustainability is a global phenomenon!
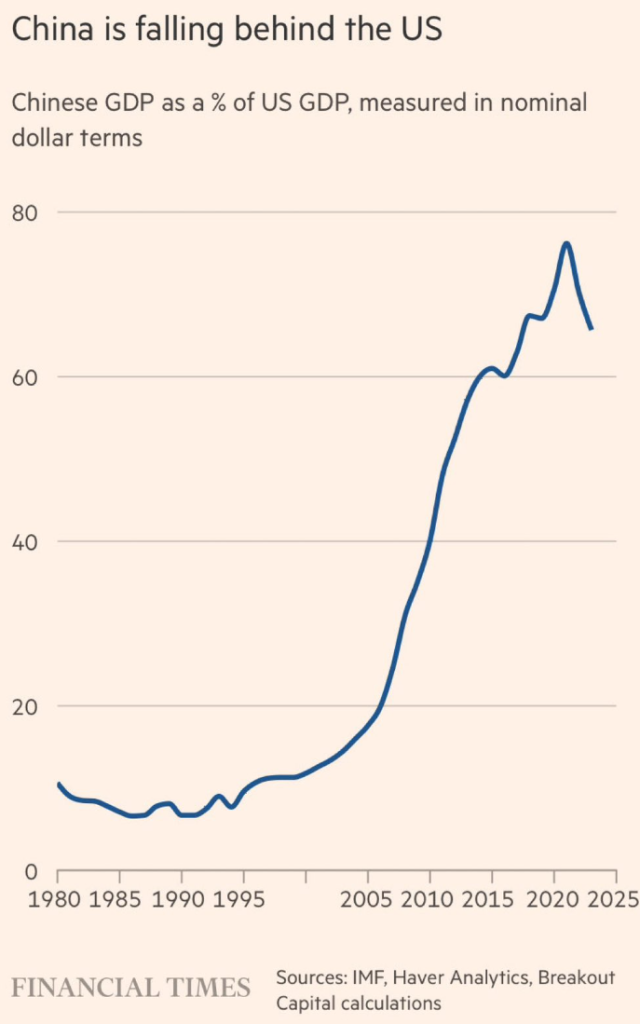
This pushes Chinese leverage to all time highs, and this is just what we know of or “on-balance sheet.”

This is a bigger issue when economic growth faces a huge amount of headwinds into 2024- especially given the weak end to 2023.
- China December official PMI Manufacturing PMI 49.0 [Est.49.5 Prev.49.4]
- Non-Manufacturing PMI 50.4 [Est.50.5 Prev.50.2]
- Composite PMI 50.3 [Prev.50.4]
NBS: Small and medium business activity has worsened.
- The large enterprise PMI rose to 50.0%, fell by 0.5 pp.
- The medium-sized enterprise PMI -0.1 pp to 48.7%, and the small enterprise PMI -0.5 pp to 47.3%.
China December Caixin Manufacturing PMI 50.8[Est.50.4Prev.50.7] *Beats expectations.
The above data sets show that things are holding at around flat to slight declines in growth. This is a broader problem given the pressure that will carry forward from real estate, manufacturing, and exports. The slide in China’s home sales accelerated in December, underscoring the challenges to arrest the country’s property slump. The value of new home sales among the 100 biggest real estate companies fell 34.6% from a year earlier to 451.3 billion yuan ($64 billion), compared with a 29.6% decline in November, according to preliminary data from China Real Estate Information Corp. on Sunday. That puts major developers’ full-year sales 16.5% lower than 2022, worse than the institution’s earlier estimate of a 15% drop. December’s sales were up 15.7% compared with the previous month.

The housing side of the economic equation is hitting banks and consumers the hardest as they try to absorb growing losses and write downs. I expect to see another round of pressure in 2024 with little by the way of stimulus stemming the tide of the slowdown.
This brings us to the U.S. that also has a HUGE debt problem that grows exponentially by the day. US National Debt hits $34 trillion for the first time, over $12 trillion higher than where it stood just 5 years ago (55% increase). There will be another $1.9 Trillion in bonds issued this year with almost $1T going purely to interest. The U.S. has a growing debt problem, and it will hit the hardest as it accelerates exponentially. The below chart puts into perspective just how rapidly pressure is building to the upside in debt.

An underappreciated issue facing the U.S., are the amount of “zombie firms” sitting in the U.S. economy. “John Authers cites a study that shows that just over one-fifth of US companies are “zombies”, defined as companies whose operating earnings were insufficient to cover interest expense for at least three consecutive years.”

When we pick apart the data a bit differently and measure financially strong companies, there has been a broad weakening of strength in the system.

“Another key issue whenever the distortions caused by years of cheap debt are discussed concerns “zombies” — companies that are no longer able to grow or even produce enough profits to cover interest expenses, but can survive because their interest costs are so low. The argument throughout the post-crisis decade was that this would lead to malinvestment, causing companies that were no longer viable to suck in capital that would have been better invested elsewhere.”

The resiliency of corporate America has deteriorated as companies over levered balance sheets and investors piled money into zombie companies. There is a gross misallocation of capital around the world, and the U.S. is no different. Elevated rates are needed to “cleanse” the system and force non-performing companies into bankruptcy. The average investor and consumer have come to rely on the “Fed put” to protect their investments. This has caused a broader problem with capital allocation that will take time to correct and will be bumpy/painful as we move through the process.
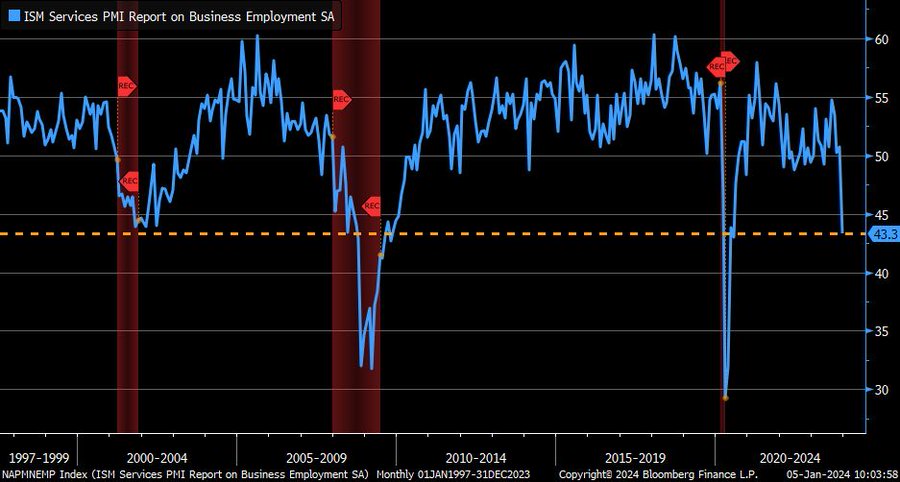
The U.S. has a debt problem (like most countries today), but the consumer is the last one to really start moving lower. As we discussed last year, the three lowest quintiles ran out of excess savings in Q3’23, but it’s now hitting all areas. “Americans outside the wealthiest quintile have run out of extra savings generated early in the pandemic and now have less cash on hand than they did when the pandemic began, per the Federal Reserve.” Services have been the pillar of the economy keeping things with some growth or at least stable. This is faltering as new orders and employment drop even as prices paid remain elevated. The current estimate has Americans needing an extra $11,400 today to afford the basics in 2023, but this is also going to be location specific. This number is the national average, which will vary wildly depending on the location.

The employment side is going to be an important one to watch as the drop is precipitous, but we will have to see how much of this is seasonal/ one-off versus a trend. For context, here is full history of employment component in ISM Services … current reading of 43.3 was actually never reached in 2001 recession.
One of the biggest concerns for the Fed remains a wage price spiral. This is what gripped the U.S. in the late 70’s when there was a large re-acceleration of inflation after a pre-mature cut in rates by the Fed.
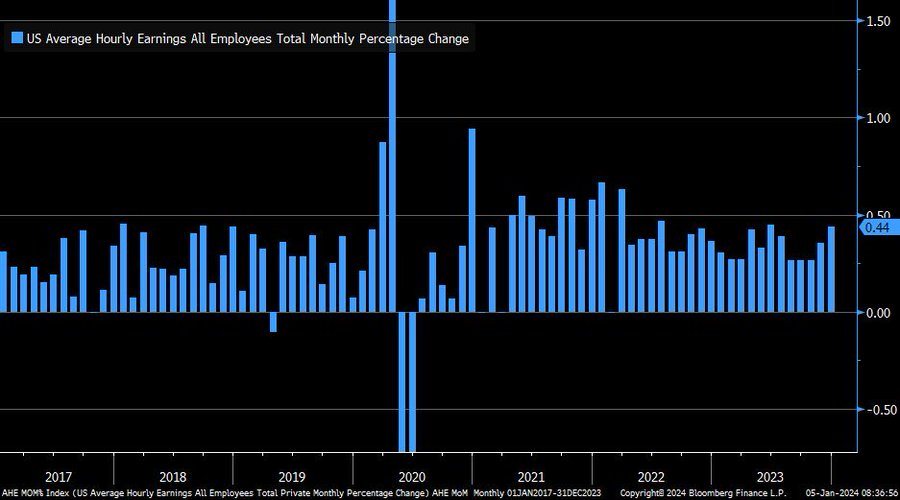
The inflation and jobs data in the U.S. still supports elevated rates, and the Fed would be foolish to do anything prematurely. The risks far outweigh the benefits when you look at underlying rate cuts.

Based on the above chart, the market is starting to reduce the odds of a Fed rate cut in March. It would be a mistake if they stepped in and did anything too soon. The view that this cut “could” happen drove down financial conditions, which is something the Fed DOES NOT WANT right now. Between inflation, employment/jobs, and financial conditions, you will see the Fed hold firm on current rates in March. They will likely get more vocal about that view to make sure the market isn’t “surprised” as we head into the March meeting.

A concerning backdrop in the employment schedule is the below:
- Full-time workers plunge 1.5 million in ONE MONTH to lowest since February 2023
- Part-time workers soar 762K to the highest on record
- Multiple jobholders hit all time-high 8.565MM
The hiring has been consolidated into only a few industries with the government being one of the largest.

This follows closely on the back of another reduction in CAPEX expectations. Capex expectations have fallen back into recessionary territory per combination of regional Fed data calculated by Bloomberg.

It’s not surprising to see the Conference Board Leading Indicators showing another round of weakness.

Many of the regional Fed data points have showed continued slowdowns across the board, so it wasn’t surprising to see a soft manufacturing print. “Only one industry reported growth in December per ISM Manufacturing PMI … lowest since April 2009.”

The internals of the data was just as- if not more concerning. New orders tend to be a reliable leading indicator for future activity, and the fact they remain in contraction doesn’t speak well for at least Q1’24. I believe this will be an ongoing issue as we progress throughout 2024.

Based on the full data, there is very little that shows meaningful expansion.

The biggest unknown will remain the consumer that is still spending, but slowing given rates and increased leverage.

The housing data or at least “Google Searches” are indicative of how people are feeling at this point in time. Homebuyer search interest on Google plummeted to its lowest level in eight years in Dec 2023. Now down 50% from pandemic peak. And still dropping year-over-year. Doesn’t seem like lower mortgage rates is moving the needle much for would-be homebuyers.

Even as economic data softens, it will be hard for the Fed to support a broader cut. There has been a resurgence of inflation that will be supported by the Red Sea disruptions. There is still a significant amount of liquidity in the market- with more of it being pushed into Money Market Accounts. There has been a surge in cash moving into these products with more to follow. It’s impossible to pump trillions into the market over the last 15+ years and assume a few quarters of “tightening” will be enough to squash the inflationary backdrop. The belief in the “Fed Put” needs to be put to rest.
- https://www.cnbc.com/2024/01/02/maersk-halts-red-sea-shipping-until-further-notice-after-houthi-militant-attack.html
- https://www.wsj.com/world/middle-east/u-s-strike-kills-iran-backed-militia-leader-in-iraq-71256676

