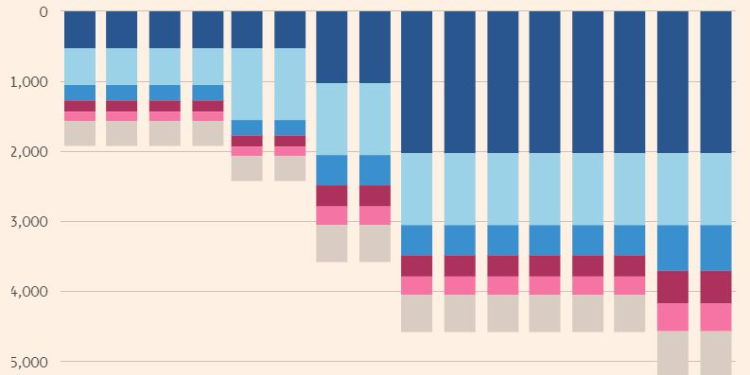
Brent future prices broke above resistance that was sitting at about $84. This resets the range to about $82-$87 with the first level of support now at $84. There was a confluence of information that came out helping to drive prices higher- attacks on Russian refiners, U.S. refiners ramping, sizeable draws in U.S. storage, and hope of a strong spring demand season. This is counterbalanced with slowing activity in China and run cuts at Teapots, slow clearing of Russia & WAF crudes, and CFDs flipping into contango for Dated Brent. This will keep us range bound with additional risks on increasing risk in Russia/ Ukraine. Maintenance season may have come early in China, which will adjust some of the hope for additional purchases as we head into April/May. European turnarounds will likely accelerate in May- but given the economic headwinds in that region- I don’t expect a whole lot of new demand to emerge.
OPEC+ didn’t deliver any surprises following their announcement of extending the cuts into Q2’24 (End of June). Russia has said they will cut oil production and exports by an extra 471k barrels a day in the second quarter. This comment comes on the back of significant cheating from Russia as well as other countries- specifically Iraq. There have been some “guarantees” that they would focus more on adhering to the cuts, but the geopolitical pressures may make this hard.

Ukraine used suicide drones to strike at several Russian refiners but targeted the storage tanks and not the refiners themselves. Russia was exporting fuel oil at six-month highs, but we could see some of that pull back to replenish lost stockpiles. There have already been some shifts, which could only intensify: “Shipments of diesel from Russian ports have fallen in the weeks since drone strikes began on the nation’s oil refineries.” The pivot could force Russia to export more crude and less product over the next 6-8 weeks. The mild winter and economic pressure on industrial capacity has level the middle distillate market a bit oversupplied. Inventories of middle-distillates climbed to the highest level in over two years in Singapore, official data show. These shifts have pushed down diesel margins in Asia, and it’s unlikely to see that adjust in the near term. A reduction in run rates will leave more crude in the market as Chinese buying slows, and I think it will soften the broader physical market.

The movements in the WAF market have been a bit slower across March with a lot of the blends that normally flow into Asia. “Angola’s crude for April loading is clearing at a slower pace than a month earlier, with almost a third of the planned total still hunting for buyers, according to traders familiar with the matter. Angola is studying Mexico’s oil hedging program as a way of managing a vital source of national revenue, which is currently at the mercy of global price swings.” Europe and possibly the U.S. could purchase some of these delayed flows. It will all come down to underlying prices.
ANGOLA SALES:
- Some 12 cargoes of Angolan crude for April loading were searching for buyers out of 37 scheduled
- Sales have been a little slower due to weaker demand in Europe, where refinery turnarounds and unplanned outages have curbed buying interest, one of the people said
- About a month ago, only 7-10 lots of March crude were left to find buyers from 34 planned, according to estimates from traders compiled on Jan. 9
- NOTE: The next cycle is due to start from early next week with the preliminary May program
Even though Russia “committed” to the cuts once again- the below gives some highlights how flows of crude remain elevated from Russia. With the shifts in the crude vs product market in Russia, I believe we could see some of these flows remain elevated. This will put them over their allotment in the OPEC+ cuts, and it will create more problems within the organization. The slowdown in Chinese purchases is creating backlogs and a slowdown in clearing across Russia and WAF.
- Russia’s Crude Shipments Rebound to the Highest Level This Year
- Pacific cargoes surged to take overall flows to 3.7 million barrels a day in the week to March 10
- Russia’s Crude Backlog Clears Slowly as Cargoes Head to China
- As much as 18 million barrels of Sokol crude was left stranded
- Some Indian refiners stopped taking the grade in December
There is also more pressure in Europe, which is another reason that Angola (WAF in general) has been slow to clear. Europe is being inundated with U.S. crude, which has slowed their purchases from historical regions. This has left crude in the market from some normal European regions for flows. So between China and Europe not buying the same amount hasn’t hit some spreads yet, but we see some weakness developing. WAF is going to be the key area to watch. CFDs in Brent have had a big flip from backwardation and now in Contango. Diffs have fallen across the board, and it will likely show up in pricing at WAF first.
- Europe’s Oil Markets Are Weakening as US Crude Keeps Flooding In
- European buyers are biding their time in purchasing barrels from Angola and Nigeria — even if prices there have held up for now: traders
- In Nigeria, WTI has so far accounted for about 40% of the crude that the giant new Dangote refinery has purchased as the plant continues a ramp up toward full operations in the next year or so
There have been some adjustments to OSPs over the last few weeks. Iraq has reduced some of their heavier crudes with more pressure coming as diffs soften. They will still remain elevated from geopolitical risk increasing insurance, day rates, distance traveled, and other ancillaries- but it will decline from the strength we saw into the end of Feb.
- Iraq Cuts Basrah Medium Oil Price to Europe for April
- To Europe for April: (vs Dated Brent)
- Basrah Medium at -$5.85/bbl, vs -$5.45 for March
- Basrah Heavy at -$8.95/bbl, vs -$8.65
- Kirkuk at -$1.25/bbl, unchanged
- To Europe for April: (vs Dated Brent)
The increase by KSA below was small compared to the strengthening of Dated Brent vs Dubai and the increasing freight and insurance costs for moving Arab crude to the Far East. I had a concern that the run up in Dated Brent was going to be short lived, and now we are seeing a flip in CFDs from backwardation to contango. The raise will be low enough to keep U.S. crudes from flowing to Asia, but it will cause some backup in the near term. This is just another reason for the backup in key crude regions.

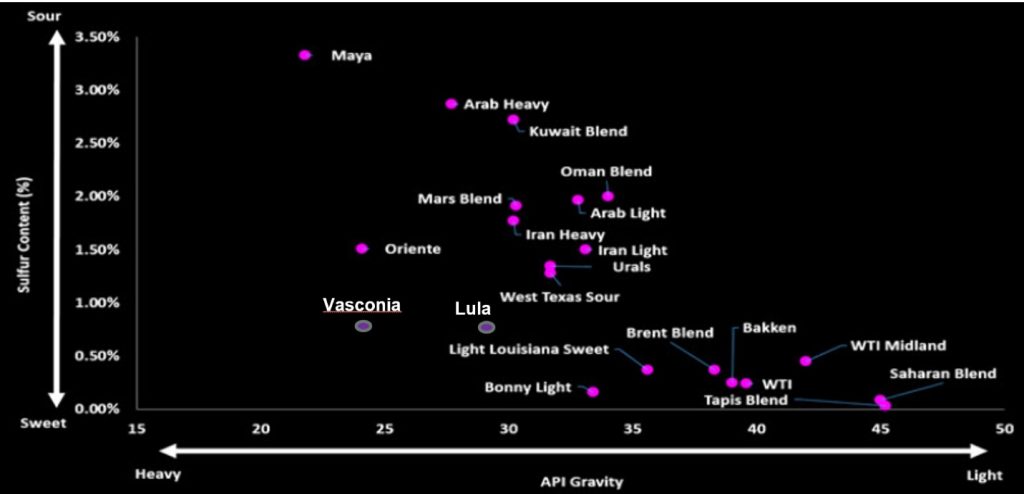
I’ve spoken extensively about the importance of crude quality, and how it will shift into the export market. The problem is- there is only so much shale crude that refiners can process. Here is a great breakdown: “US refineries have shown US shale absorption has reached saturation levels. The same will happen outside US. Refineries can only handle a maximum volume before capacity restraints. The capacity restriction is caused by the lightness (high API) of shale. Shale contains much higher levels of Light ends than does an Arab light, Urals and also a far lower amount of residue. The throughput of a crude distillation column is not determined by the volume of crude coming in but rather by the maximum amount of products it can produce. Each product draw point has a maximum amount that can be produced. The design of a distillation column would be significantly different if you wanted to run 200kbpd of shale oil or 200kbpd of Sverdrup. Why? Because the product slate is different. You could never run 200kbpd of shale in a column designed for 200kbpd of Sverdrup and vice versa. What would happen if you tried to run Shale in a Sverdrup designed distillation column? Shale would easily fill the upper light end section of the column to its maximum. That would equal what Sverdrup could do. The problem is in the bottom sections of the column. Shale has less gasoil/residue etc. so it would not supply the same number of heavier products as Svedrup. The bottom part of the column would be underutilized. This means less crude throughput overall. By trying to increase shale oil throughput to fill the gasoil and residue quantities would also cause excess light ends at the top of the column Excess light ends means higher pressure creating problems for the temperature profile along the column. This would result in the cut points of the products being affected and off-specification being produced. With a higher proportion of light ends than residue as well-meaning problems controlling temperature in the column as well. Most refineries in the world have not been designed to run a full shale diet. They are designed to run a heavier crude oil. Maybe not as heavy as Sverdrup but definitely heavier than shale. Shale can be blended with other crudes to produce the optimum crude for a refinery. But as soon as the % of shale increases past the optimum level, then the refinery throughput is reduced. We have seen this already happen in the US where API crude input levels have stabilized (even fallen) after rising as refiners ran as much cheap shale as they could. It is why the US must export so much shale oil because their refineries just cannot process it. This will eventually happen outside the US as well. Especially as light sweet production increases more than medium/heavy production. Therefore, US export growth will flatten. This will restrict US growth far more eventually than anything else. It will limit to a maximum what US shale can produce because the system will not be able to process it.”
The below chart puts into perspective where the U.S. falls in comparison to other crudes around the world. There is usually a blend of crudes that are used to make varying products throughout the year. A refiner can adjust their crude slate depending on the target products, but with U.S. shale your options are limited.
When we look at refining spreads, the U.S. saw a large spike in pricing, which blew the arbitrage wide open coming from Europe into the U.S. This will take time to fill, but we expect to see a large amount of gasoline flowing into the U.S.
Gasoline Arbitrage from Europe to US Atlantic coast

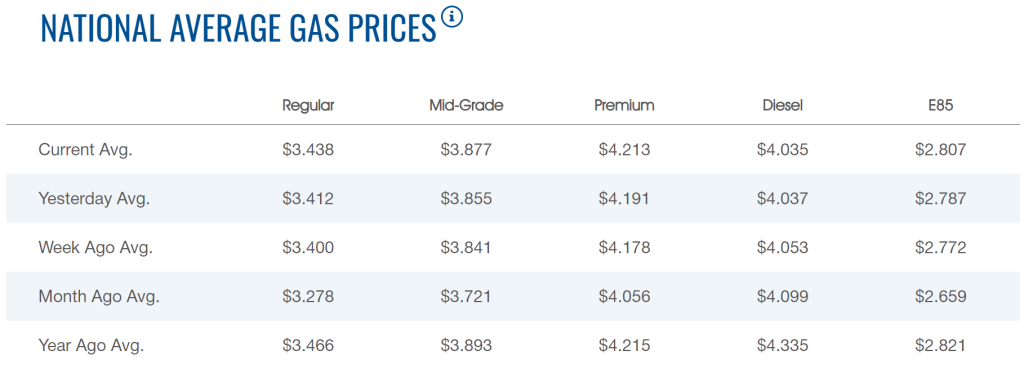
Prices have jumped across the board and are now pushing against where we were last year. This will put a damper on demand as consumer spending capacity has “degraded” further, which is evident in credit card data and retail sales.
Before pivoting over to economic data, it’s important to appreciate the Russian and Ukraine impacts. Ukraine began in offensive push into Russian territory and married it with suicide drone strikes on several refiners and depots in the region. Based on early reports, the damage to refiners didn’t hit CDUs or distillation towers. This means that the tanks can be bypassed, and they can “technically” begin operation again once the evaluation of the assets check out. Regardless, this is a bit increase in risk for Russia, and will reduce the amount of refined products they can export. But, it does mean that their operations could be limited and slate more crude for export.

Chinese demand remains a problem with U.S. data also showing the broad slowdown that exists. Credit card debt has exploded with interest rates sitting at all-time highs. The consumer isn’t in a good place, and another round of inflationary data only puts more pressure on spending.

The below chart puts into context just how extreme personal interest payments are for consumers. The market focuses a lot on mortgage rates- which are low- but it ignores all of the other personal borrowing that exists in the market.

Net savings have taken another big hit again and has now hit the levels seen during the pandemic and financial crisis.

These weakening levels has pushed retail sales into concerning areas: “US Retail Sales increased 0.8% over the last year but after adjusting for higher prices fell 2.3%. These numbers are well below the historical averages of +4.7% nominal and +2.1% real.”

Broadly speaking- retail sales came in at .6% but adjusted for inflation +.1% and when we turn to core- 0% but adjusted for inflation -.3%. Based on savings rates, inflation, and credit card debt, it’s unlikely we see a strong U.S. consumer as we head into Spring/Summer. “February retail sales +0.6% month/month vs. +0.8% est. & -1.1% prior (rev down from -0.8%) … sales ex-autos +0.3% vs. -0.8% prior (rev down from -0.6%); control group 0% vs. -0.3% prior (rev up from -0.4%).
The control group has now pushed to another problematic area, and I don’t expect to see the bounce like we did in the past. The control group for retail sales (which feeds into GDP) unchanged on the month after a decline last month.

Bond yields have risen over the last few sessions, and I believe we will see another surge higher. The problem remains Emerging Markets, which I still believe aren’t carrying the full weight of the risk that exists in the market.

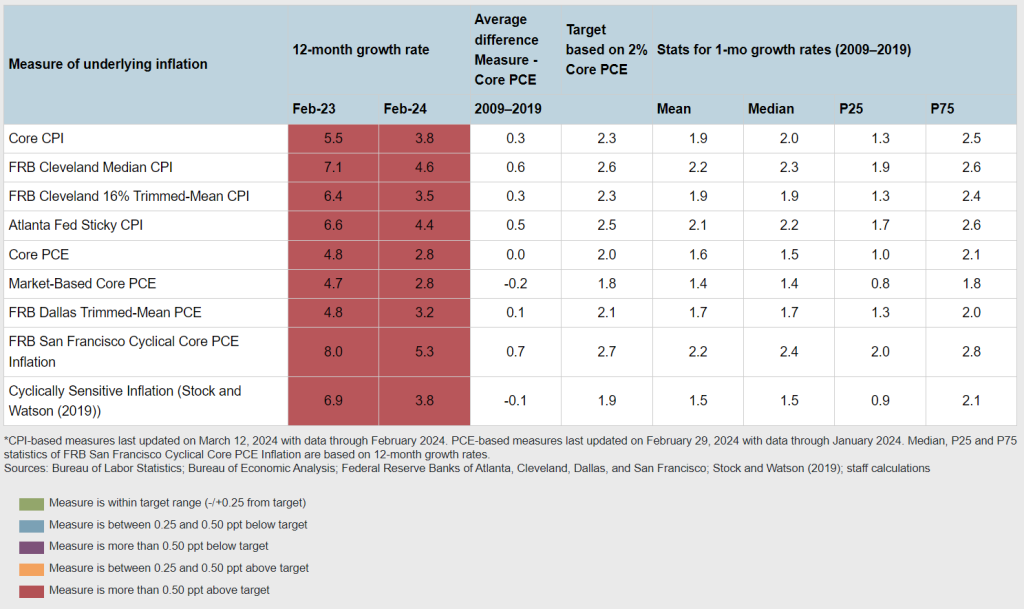
The financial conditions loosened ahead of “hopes” of a cut, but as we have seen leading, lagging, and current data showing that inflation is accelerating- this should start to tighten again. While M2 has in theory fallen, there have been other shifts in the money supply that has kept it moving higher. Everything from shifts out of REPO and money market accounts, which has keep liquidity well above what the Fed has been hoping. This level of liquidity is why it shouldn’t be a surprise to see inflation turning higher, and the Fed “Stuck” with higher rates.

I think this below chart really drives home the issue, and it’s important to remember that the large spikes in inflation (harder comps) are falling out. This means that the level of inflation and pace is going to accelerate as we head throughout 2024.
One of the “positives” for the Fed is the slowdown in earnings, which is good from an inflation point of view- but not from a spending perspective.


Hiring plans have slowed while the risk still remains for inflation across how small businesses are reporting.

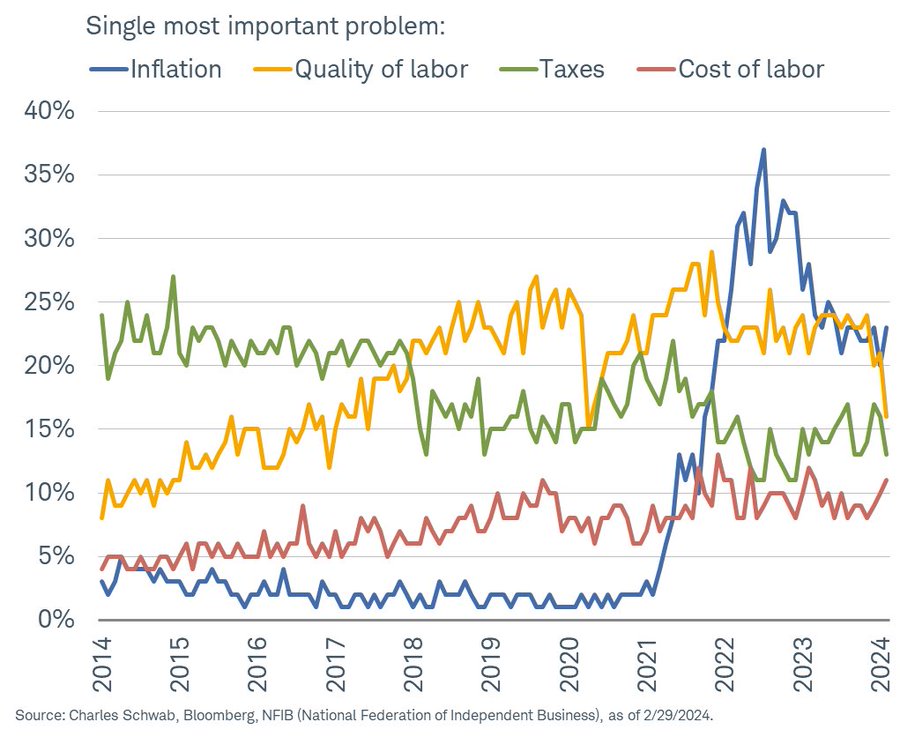
The interesting fact in the NFIB data is the mixture of optimism and concern. On one side, there is a view that FUTURE compensation plans will weaken but CURRENT cost of labor is moving higher. This has pivoted up the concern around inflation (again) and cost of labor.

The year-on-year growth in consumer prices was also the highest in 11 months, buoyed by gains in some key foodstuffs such as pork and fresh vegetables, as well as travel amid a seasonal rush around Lunar New Year in February, according to the NBS data. “Domestic demand is still quite weak. Property sales of new apartments have not stabilised yet.” But the producer price index (PPI) fell 2.7% from a year earlier in February versus a 2.5% drop the previous month. That was faster than a 2.5% decline forecast in the Reuters poll. Producer prices have declined for more than 1-1/2 years. Weak international trade flows, declining domestic investment, and high local government debt further sapped economic growth. Policymakers have pledged to roll out new measures, promising to unleash “new productive forces”.
These shifting issues has changed the views for the market on Fed rate cuts. I still hold to the fact that the EARLIEST we can see a rate hike is June, but I think Nov is the more likely option. The market has quickly moved closer to my viewpoint because it started the year with an expectation of 6 rate cuts- which was ALWAYS absurd. Now- it’s pivoted to 3 which is more likely but still could be optimistic.

As I described above, the leading indicators show problems for inflation even as the economic data (especially industrial and consumer) weaken further. Here is another interesting pivot:
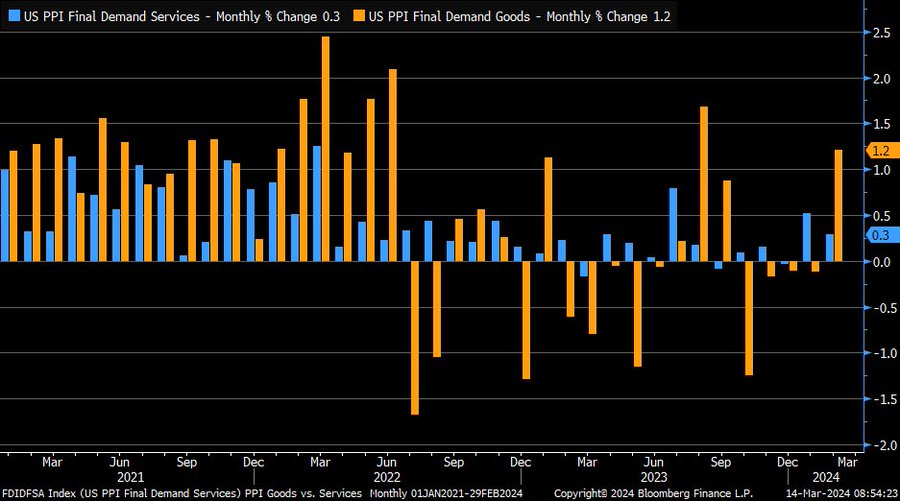
Over the last year, the manufacturing or “goods” side of inflation improved as services remained a huge overhang. Now- based on the data above- both are pivoting higher. I’ve been highlighting how these issues were rapidly approaching- but now the data is confirming it.
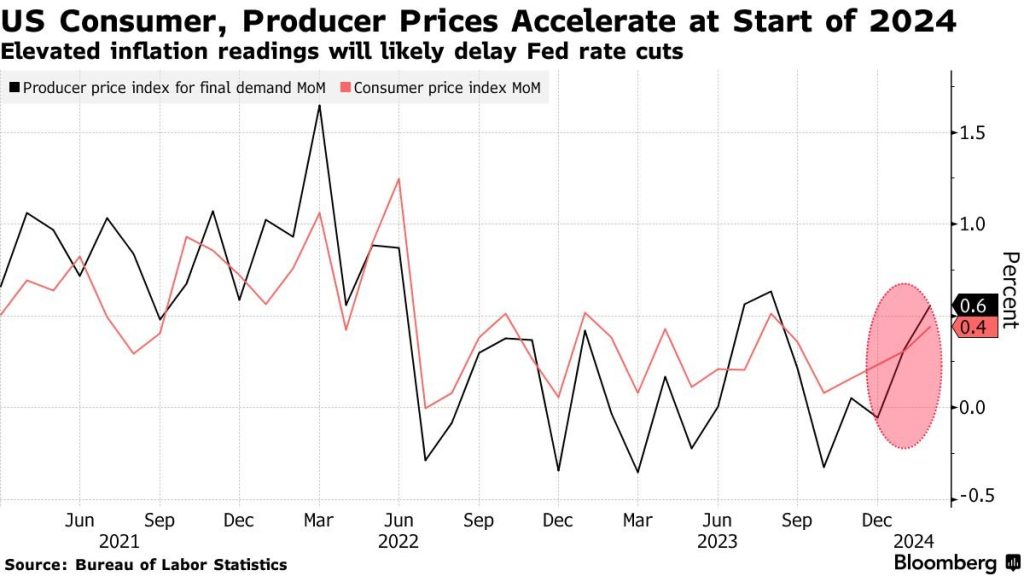
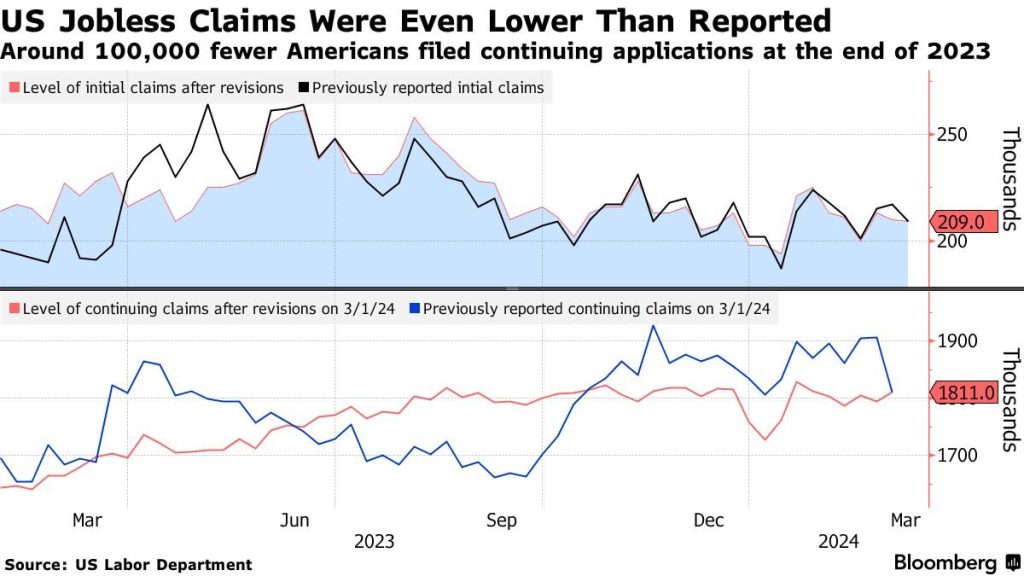
On all key metrics watched by the Fed- employment and inflation- we are moving in the wrong direction for a potential cut. Even on their made up “Super-Core” metric to highlight that things aren’t “that bad”, they are moving in the wrong direction. All of this leads to- a cut is no where in sight.
When we pivot over to China, the data doesn’t improve as economic pressure remains in the system and all of the leading indicators show more slowdown ahead. “China’s bank loans expanded at the slowest pace on record in February, underscoring weakness in borrowing demand despite steps by the central bank to ease policy and help the economy. The stock of yuan loans grew 9.7% in February from a year ago, the lowest in data going back to 2003, according to figures released by the People’s Bank of China on Friday. It was also the first time the rate dropped below 10%. The stock of aggregate financing — a broad measure of credit — expanded just 9%, also near a record low. The M1 money supply measure, which includes cash in circulation and corporate demand deposit, weakened to 1.2%, the lowest level since January 2022. That indicator is closely watched, given a slowdown signals that companies are not planning to use money in near term to invest or expand production.

Loans are slowing down even as rates have been cut and stimulus has been the name of the game from both the PBoC and CCP. There is just no demand for new leverage. This is going to pull down the credit impulse levels, and it highlights the problems that China still faces.
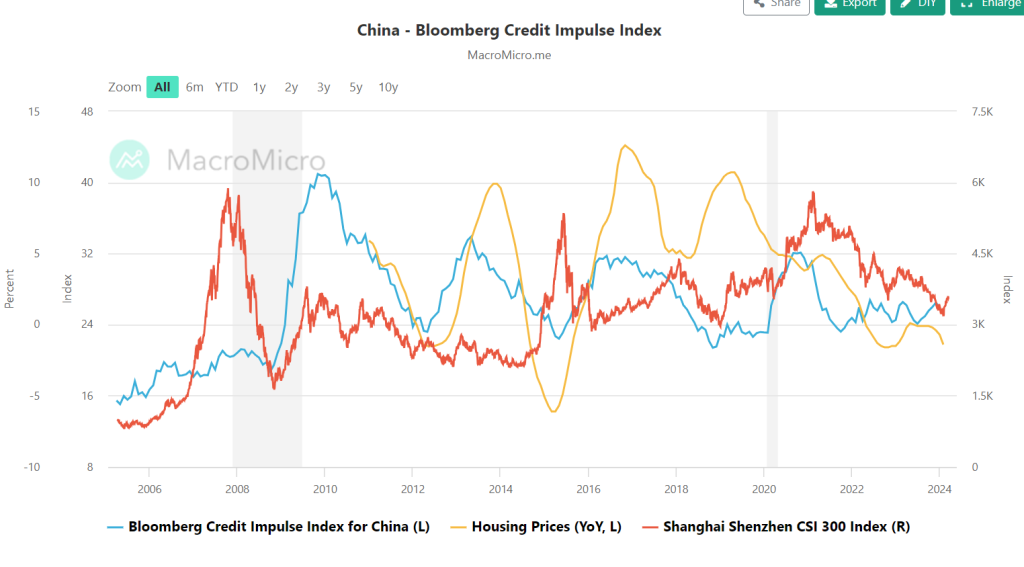
The problem remains structural- this isn’t something that can be swept under the rug anymore. Every corner of the globe is facing pressure following endless printing and liquidity. China is no different, and additional lending and infrastructure projects isn’t the answer at this point. If anything, additional investment in those regions will create MORE problems. Some investors have said- they need to focus more on industrial capacity and exports, but China already has a massive trade account surplus- how can it get bigger given the state of the rest of the world? How can the surplus grow when more companies are shifting manufacturing and industrial capacity into other areas of the world?

It will be difficult for more reductions to really drive a meaningful change in the trajectory of growth in China.
According to Bloomberg: “China’s central bank has taken some steps recently to spur demand, including by lowering a key reference rate for long-term loans including mortgages by a record amount last month, and cutting the amount of cash banks must keep in reserves. But that’s done little to revive activity so far. Wary of flooding the market with too much liquidity that isn’t being routed in ways that support growth, the PBOC earlier on Friday drained cash from the banking system for the first time since November 2022 via its one-year policy loans. The move was seen as one to deter financial speculation in an environment where monetary stimulus seems to be fueling a bond market rally more than helping the economy. More fiscal stimulus and a bottoming-out of the property market will be required to help credit demand rebound, according to Ding. In the meantime, a slower money and credit growth in the range of 8% to 9% may be “desirable” for the central bank since it has put more focus on using loans more efficiently, he said.”
The hope is for a change in the housing market, but mortgage activity and new borrowing fell even with a significant amount of stimulus and policy changes to drive additional purchases. February is typically a slow month for credit expansion. Banks aren’t usually in a rush to meet their quarterly loan targets during the period. The Lunar New Year holiday, which was a day longer than usual this year, reduced the number of working days.
The release also raised eyebrows due to its later-than-usual timing. It was the first time since February 2020 that the data was published on or later than the 15th, which is usually at the end of a five-day window for its release.

This comes as housing prices fell AGAIN across the board with little change in the direction.

There isn’t going to be any help from the stimulus market, housing, or additional exports. “China M1 money supply (usually a leading indicators) rose 1.2% YoY in February (lowest since Jan. 2022) *Real M1 (adjusted for CPI) rose 0.5% YoY in February (lowest since Jan. 2022).” The PBoC is trying to manage these liquidity rates while being supportive of the economy. I said since 2021- the PBoC will try to manage a credit impulse of 0 because they are at least realistic about the Law of Diminishing returns. There needs to be structure reform, which takes TIME to work through the system.

We did get some inflationary data from CPI, but a large part of that was driven by the timing of the report. It coincided closely with Lunar New Year, so I think it’s important to see how March comes in because it could balance out a more aggressive shift.


The below PPI is the counter that I’m talking about because other data points don’t support that spike in CPI.

“Data due Monday is expected to show year-on-year growth in retail sales and industrial output slowing compared to December, according to economists surveyed by Bloomberg. Stripping out base effects, momentum was probably little changed. Property development investment is seen plunging as the sector fails to mount a meaningful turnaround.
“Property is still the biggest problem,” said Raymond Yeung, chief economist for Greater China at Australia & New Zealand Banking Group Ltd. “The economy was relatively stable compared to the fourth quarter of last year, but it didn’t rebound.”
I’m not overly confident that Chinese consumption data will have a strong follow through after the Lunar new year data comes out. The early data showed a nice jump in travel, but some underwhelming spending information.

Early data has already suggested the new year travel boom revived consumption, at least temporarily. Tourism spending in that week exceeded pre-pandemic levels, while car sales for January and February grew 11% from a year earlier. China’s consumer price index also crept out of deflation after several months of declines.
Other indicators have been less encouraging, though, keeping a lid on any optimism about a consumption rebound. Per capita tourism spending remains low and shoppers are trading down on things from food to clothing. That’s intensifying a price war among retailers and carmakers.
Economists have also warned that the jump in consumer prices will likely be short-lived as overall domestic demand remains sluggish.
The below helps to drive home the issues on main growth.

All the while- more companies are missing coupon payments: “Country Garden Holdings Co. missed a coupon payment on a yuan bond for the first time, adding to the woes of the Chinese developer that is facing a lawsuit seeking its liquidation offshore. The builder’s main onshore unit hasn’t fully prepared a 96 million yuan ($13 million) coupon that came due on Tuesday for a 4.8% yuan bond maturing in 2026, the company said in a response to Bloomberg. There is a 30 trading-day grace period for the payment, it added.”

All of these problems are occurring as the above fiscal impulses fail to materialize and the weight of previous bonds (leverage) destroy any chance of stimulus working. As I’ve described- “PBC withdrew $13B of cash from banking system on a net basis to avoid excessive liquidity while it kept rate on its 1-yr policy loans steady at 2.5%…rate decision will likely disappoint investors and economists who anticipate more stimulus is needed…”
This all happens as the creator of QE- Japan- is going to fall on their own sword. The BoJ has announced a potential change in policy with rates being increased. As I outlined in MANY times regarding Japan, this is how it was always going to come to an end. The market was going to force their hand, and here we are!

This change would be the first-rate hike in 17 years… The QE experiment will end where it began- Japan! Sadly, it has created a significant amount of damage along the way, which has created the need for structural reform and a lost decade.

