The energy markets are continuing their volatile trends as geopolitical risks fade and weakening demand factors start to take focus. We’ve been describing for several weeks how crude storage would rise above seasonal norms based on how much crude was in transit while demand remained soft. This would push builds above seasonal norms and keep pressure on crack spreads. Supply still remains off the market so we shouldn’t see a continued push past last year’s number on the crude side, but the products market is showing a lot of pressure in the near term. As refiners come out of turnaround, there will be more problems for products- especially as economic pressure picks up. Based on the data, the Fed won’t be able to cut as yields continue to trend higher. The BoJ has a meeting Thursday that could easily adjust the way the market views USD/Yen and the underlying carry trade.
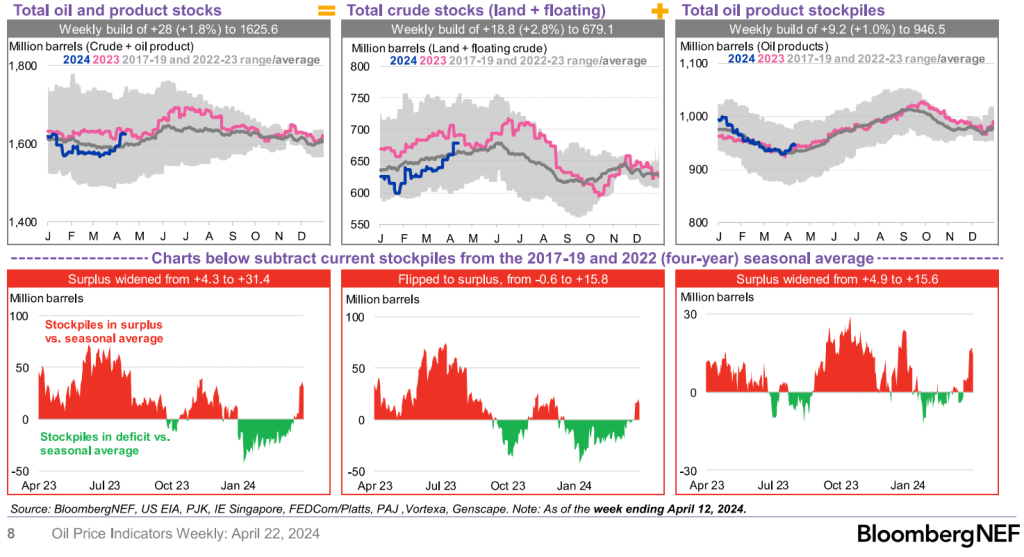
There isn’t any stimulus coming to save the market, and we don’t see any reason for builds not to track closely to ’23 or ’17-’19 averages. Investors still have expectations of a strong summer, which is not playing out in the physical or product market.
Geopolitical risk has cooled off as Iran and Israel went back and forth sending messages. There was little to no impact from Iran attacking Israel, but it did manage to anger Saudi Arabia and Jordan. No one likes their airspace used for missiles and suicide drones. In order to restore “some sort of calm,” there have been rumors that Iran is willing to re-enter talks around a nuclear deal. This is all for show and will not result in any meaningful movement. Israel will likely launch an attack on Rafah in the coming days, and it will be the final push to eliminate Hamas from Gaza.
Even as demand weakens and some geopolitical risk fades, there is still enough supply withheld by OPEC+ to keep us range bound. We see $85-$91 as the “new” range at this point with prices centering around $86.50-$88.50. Any time Brent has broken above $91 it gets sold very quickly, and any movement down to $86 is bought pretty quickly. The pressure still remains to the downside given the amount of crude on the sidelines and demand slowing further around the world. We have already seen additional pressure in the diesel/gasoil market while U.S. demand slows on the gasoline front.
When you look at crude stockpiles, there was a broad pivot from “floating” and “in-transit” crude moving into land storage.
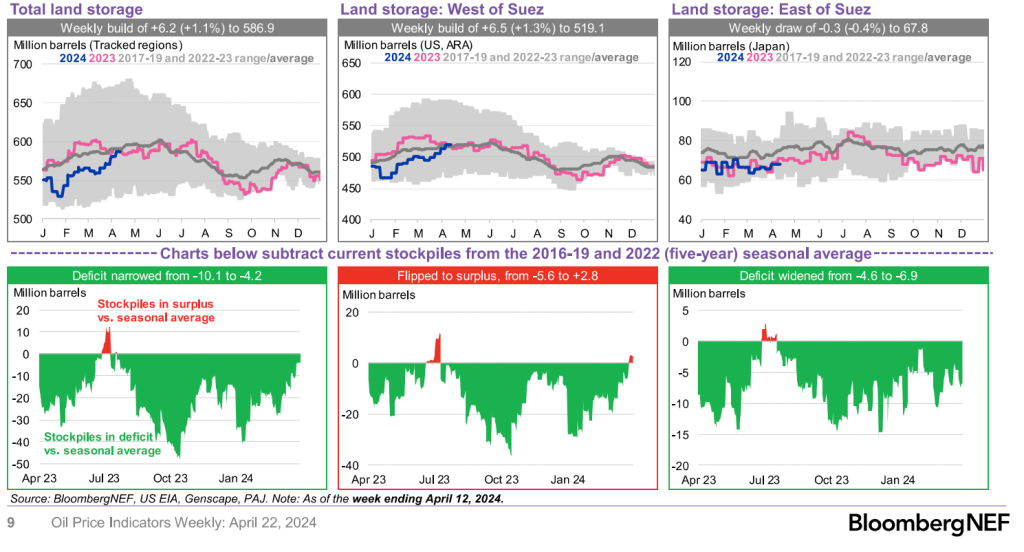
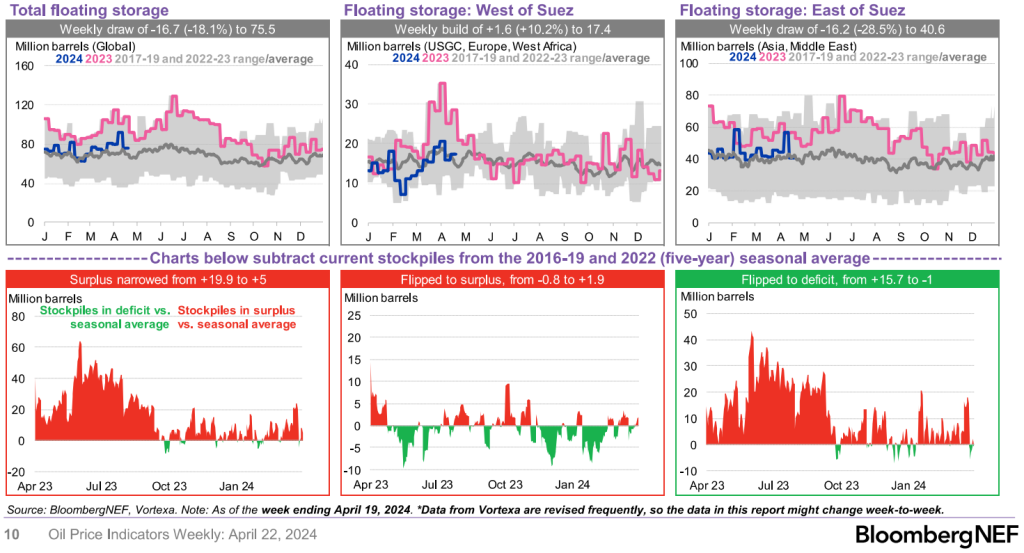
As floating storage dips, it results in more land builds- especially as refining activity remains depressed. Some of the reduced refining utilization rates are caused by slow activity and others because of turnarounds. Floating storage will likely start to replenish as refiners remain slow to ramp and more crude enters the market. There will need to be some deeper price cuts to get some of this crude off the coast. West Africa is the biggest overhang at the moment with a significant amount of Nigerian crude still waiting to sell. Angola still has some cargoes available, but Nigeria is the biggest overhang, which will cause some sizeable price cuts.
NIGERIA UNSOLD CARGOES:
- Between 25 and 27 cargoes of May-loading crude are still hunting for purchasers, according to traders familiar with the matter
- NOTE: At least 53 shipments were scheduled for next month, according to data compiled by Bloomberg
- More than 30 cargoes were pegged as unsold on April 12
- NOTE: Nigeria’s June trading cycle is due to start this week
- Sales of Nigerian crude have been quite slow as refinery margins decline, traders said Friday; estimates also showed sluggish sales for Angola’s last few May cargoes
Mercuria cut its offer price for Escravos on Platts. Angola’s Sonangol offered one shipment each of Dalia and Girassol crude for June loading to spot buyers. Nigeria is scheduled to ship 168k b/d of Bonga crude in June, the highest since July 2019.
PLATTS:
- Mercuria offered 950k bbl of Escravos for May 7-8 loading at Dated +$2.20/bbl: trader monitoring window
- The company pulled Escravos offers for the same loading dates at +$2.25 on April 23, +$2.50 on April 22
SONANGOL SPOT OFFER:
- 950k bbl of Dalia for June 11-12 loading listed at Dated +10c/bbl
- Increased from -20c on April 23
- 1m bbl of Girassol for June 19-20 loading pegged at Dated +$2.80, steady versus an offer on April 23
- NOTE: A 950k-bbl lot of Pazflor for June 23-24 loading was no longer offered; outcome not immediately available
- That shipment was offered at Dated -10c on April 23
China has been picking up cheaper crude wherever possible, and they recently loaded several supertakers from the North Sea.
- Four Supertankers Carrying North Sea Crude to Sail to China
- Four VLCCs with North Sea Forties and Johan Sverdrup are scheduled for China after loading about 2m bbl each earlier this month
The U.S. put new sanctions on Venezuela, which has reduced the price for China to purchase cargoes. It’s not surprising to see China scoop up some discounted cargoes, and it comes on the back of India approving insurance for Russian cargoes. Both countries will continue to take advantage of Russian exports as well as other discounted crudes.
By purchasing “below market barrels,” both countries are able to export cargoes with advantaged economics. We are seeing sizeable product builds around the world with Europe slowing further and Singapore showing another increase. Even as the distillate cracks show this should slow, it’s based off of market priced crude, which India and China can sell below. This allows them to undercut the market, and as economic pressures mount- we will see bigger builds across the region.
Inventories of middle-distillate fuels such as gasoil and jet fuel at the Asian distribution hub of Singapore rose to the highest level since July 2021, according to official data released Thursday. This comes as China announces another sizeable increase in exports: Chinese refiners and fuel suppliers are planning to export 3.53 million tons of oil products in May, according to Mysteel OilChem. The planned volume is 6.5% higher than April and a 26% rise year on year. The margins from turning Dubai crude into diesel in Asia were at $14.72 bbl as of 4:30pm in Singapore on Wednesday, the lowest level since May last year, weighed down by weakening demand, according to Bloomberg Fair Value data.
Typically, the U.S. exports diesel/gasoil to Europe from PADD 3, but we just received four cargoes from Europe. This gives you an idea of how “long” Europe is at the moment, and the issue is complicated further as refiners in the U.S. and China come out of turn around season. South Korea has put some gasoil cargoes for sale as well, which will be complicated given how long Asia is in product. “South Korea’s GS Caltex Corp. offered three gasoil cargoes for May-loading, according to traders who asked not to be named.”
Chinese driving data is holding at last year’s numbers, and we should see another bounce for Labor Day on May 1st. This will be another bump in activity as consumers take advantage of the five-day holiday. I expect to see activity drop right back to 2023 levels.
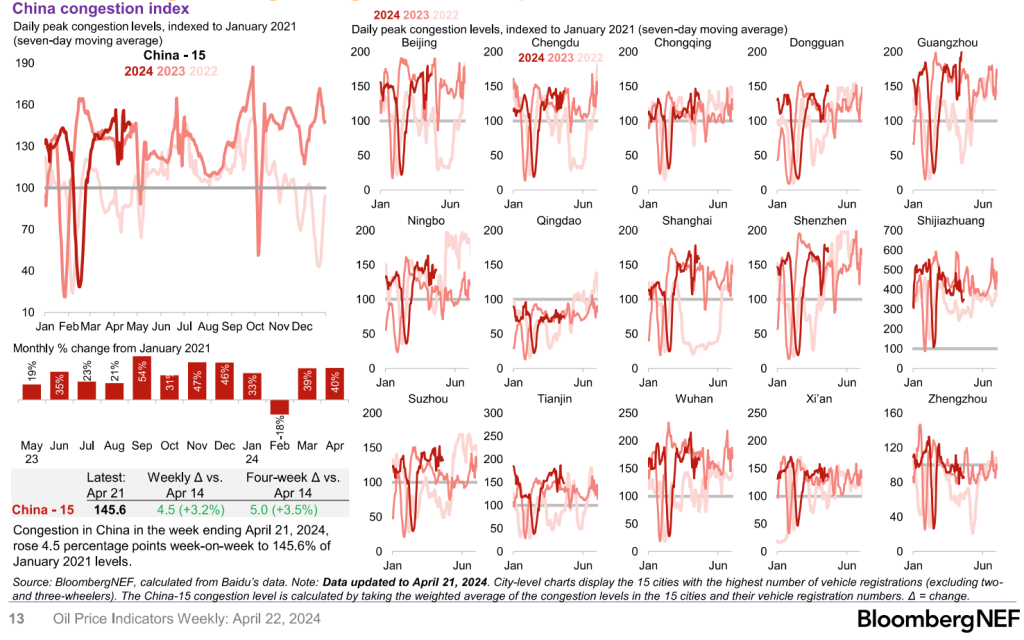
Shandong refiners have turned higher, but still well off their seasonal norms. Many refiners in the region are coming out of turn around, but there are limited reasons to run hard. Exports are struggling given the storage levels, and the slowing demand driven by economic pressure.

The U.S. went into turn arounds early driven by weather and weak demand. Typically, refiners will start to make some summer grade gasoline prior to their reduced run rates. By not doing this, they created some tightness in the market driving up crack spreads. This has blown open the arbitrage to bring product from Europe, which you can see in the import numbers into PADD1. There’s more behind the current ships, and we will see gasoline crack spreads fall across the board. This will pick up pace as refiners hold close to seasonal norms and demand stays sluggish.

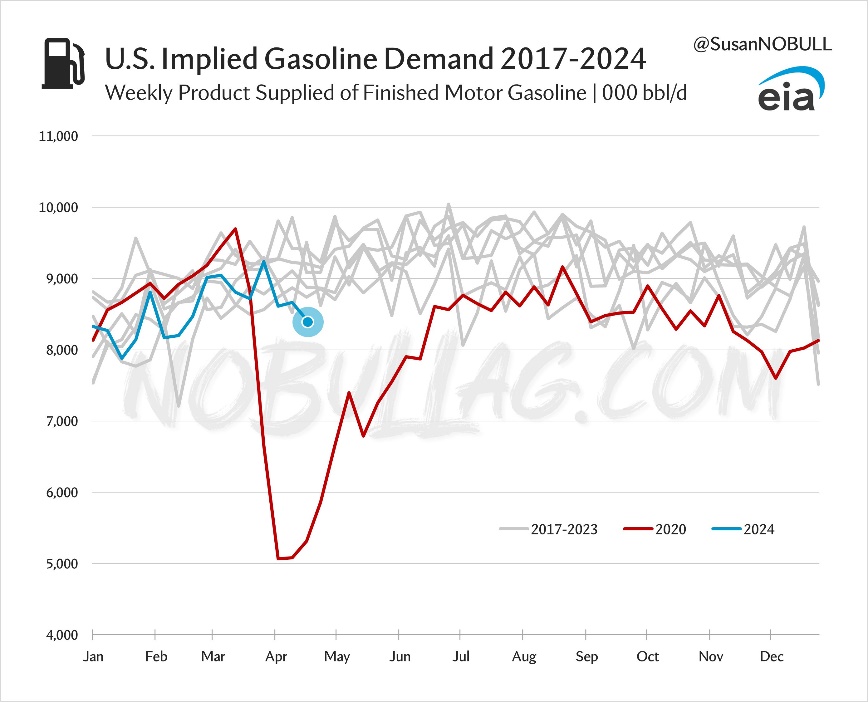
When we look at demand, gasoline has fallen to the lowest level since 2020. The data for gasoline is always lumpy, so it’s best to look at the 4-week rolling average. The trend continues to be problematic, and we don’t see that changing given the issues facing consumers. As we’ve stated previously, the U.S. consumer is NOT better off today versus one year ago. They are loaded with debt, dwindled savings, living off expensive CC debt, price increases across the cost of living, among other things. This will keep many people on the sidelines and reduce their desire to spend/travel.
The recent economic data fits into this threshold with disappointing GDP numbers and accelerating inflation. “Key to watch is whether trend in personal spending (blue) softens this year and if core inflation (orange) stays sticky … might put Fed in a bind, but also have to factor in labor market trends.” The trends are moving in the “wrong” directions that will put a damper on any rate cuts and force the Fed to hold firm. The data that came out this week fits firmly in our view of accelerating inflation with stagflation in the background.
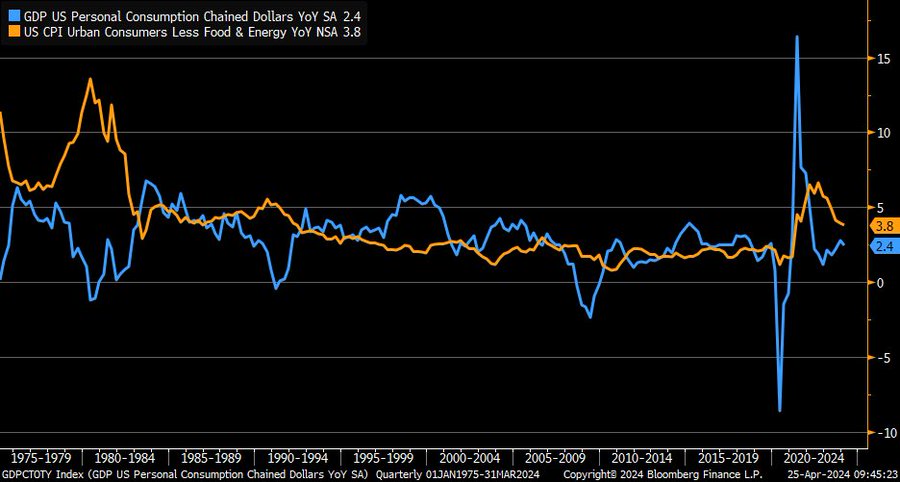
The problems in the U.S. will become even more apparent as the 12-month data gets “worse” as the harder comps fall away. I’ve always stressed the importance of the m/m and 3-month average. The m/m shows the real pain to the consumer and the 3 months capture the general trend of pressure. The 12-month average can be skewed especially when we experience significant spikes, which occurred during and after COVID.
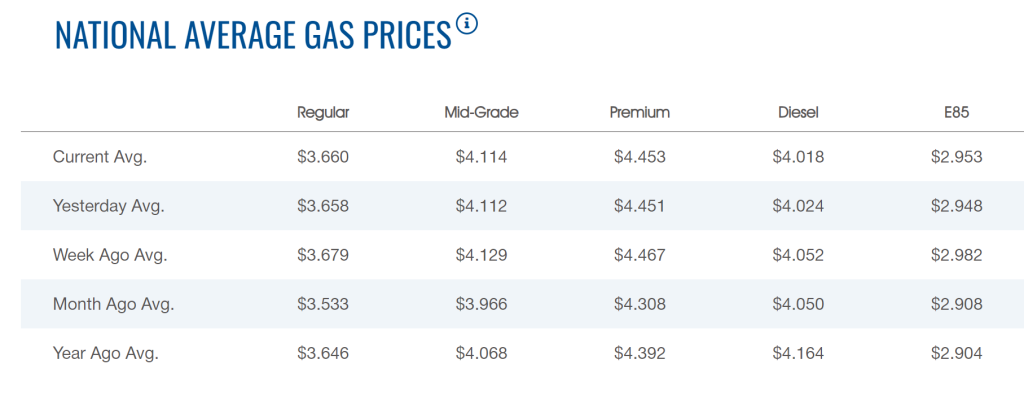
Gasoline and inherent energy prices are moving in the “wrong” direction for consumers and inflation, which will weigh down on their spending. Just as the consumer is in a worse condition year over year- gasoline and energy prices have only shifted higher. Diesel prices are still prohibitive of demand (even though they are lower), which is playing out in the shipping and transportation markets. Demand for goods has diminished and industries have no desire to stock up on inventory as shelves are slow to clear.
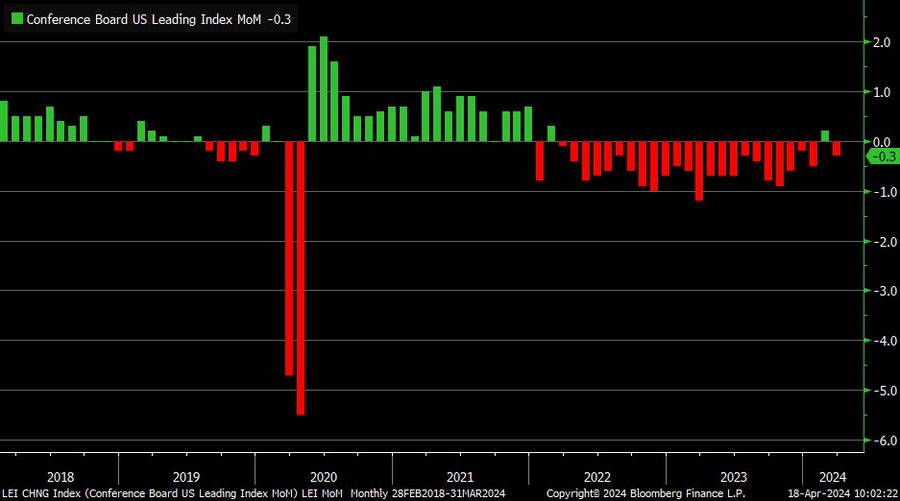
The leading economic index in the U.S. has flipped back to negative because of a quick blip higher in Feb. “March Leading Economic Index from Conference Board -0.3% month/month vs. -0.1% est. & +0.2% prior”- the trend still holds on a “flat to down” ratio, which feeds into our stagflation view.
One of our key views has been that growth wouldn’t “Drop like a rock” or have a “swift move down.” Instead, we believed it would be a gradual reduction that would settle at around -.5 to .5% growth, and I think the trends indicate this is what’s occurring.
The broader views in the market are for a stronger GDP number from key economies, which I think is grossly overstated. The recent U.S. data is a perfect example: “Miss: 1Q2024 real GDP +1.6% (q/q ann.) vs. +2.6% est. & +3.4% in prior quarter.”
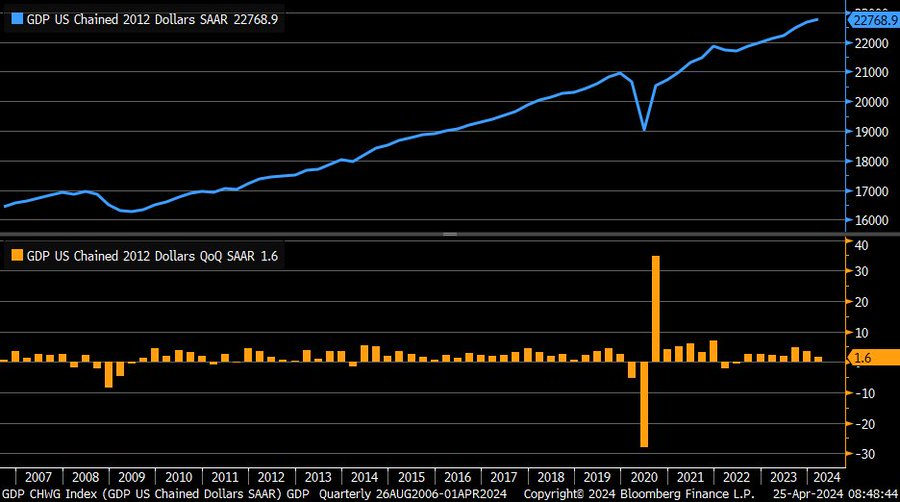
The market is underestimating the damage of inflation has it hits the consumer the hard in essentially every aspect of their daily life. The consumer is dipping further and further into savings, which has also resulted in more people drawing down their 401ks.

Consumers try to maintain their current standard of living, but they will move down in “quality” say from Target to Walmart or Whole Foods to Aldi in order to save money. Once this is exacerbated, consumers will curb spending in other areas to try to maintain a certain sense of normalcy. This cuts down on travel, trips, and other “extravagates” to conserve capital.
“Gross domestic product increased at a 1.6% annualized rate, below all economists’ forecasts, the government’s initial estimate showed. The economy’s main growth engine — personal spending — rose at a slower-than-forecast 2.5% pace. A wider trade deficit subtracted the most from growth since 2022.
A closely watched measure of underlying inflation advanced at a greater-than-expected 3.7% clip, the first quarterly acceleration in a year, the Bureau of Economic Analysis report showed Thursday.” It’s important to note that 3.7% is utilizing some of the “new math” to calculate the inflation data. I’m sure that anyone going to a store or paying their monthly bills would experience something well above this rate.

“The figures represent a notable loss of momentum at the start of 2024 after the economy wrapped up a surprisingly strong year. With the inflation pickup, Federal Reserve policymakers — who were already expected to hold interest rates at a two-decade high when they meet next week — may face renewed pressure to further delay any cuts and even to consider whether borrowing costs are high enough.”[1]
Here is another view when you consider PMIs- unfortunately- we don’t see any strength in April. This just means the softness is carrying forward and will keep pressure on the broader economy.

No matter how you look at inflation- it’s getting worse. The Fed and Economists tried to create different buckets and methods of evaluating inflation. Each was an attempt to show how it “isn’t that bad,” “it’s transitory,” or “it’s improving,” No matter what bucket or basket you look at- things are changing.
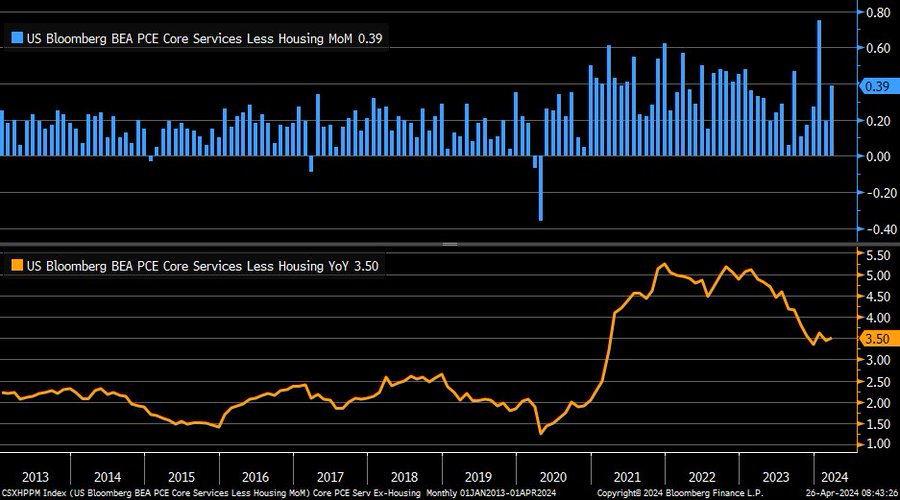
Also not heading in right direction: “supercore” PCE #inflation +0.39% month/month in March, taking year/year rate back up to +3.5%
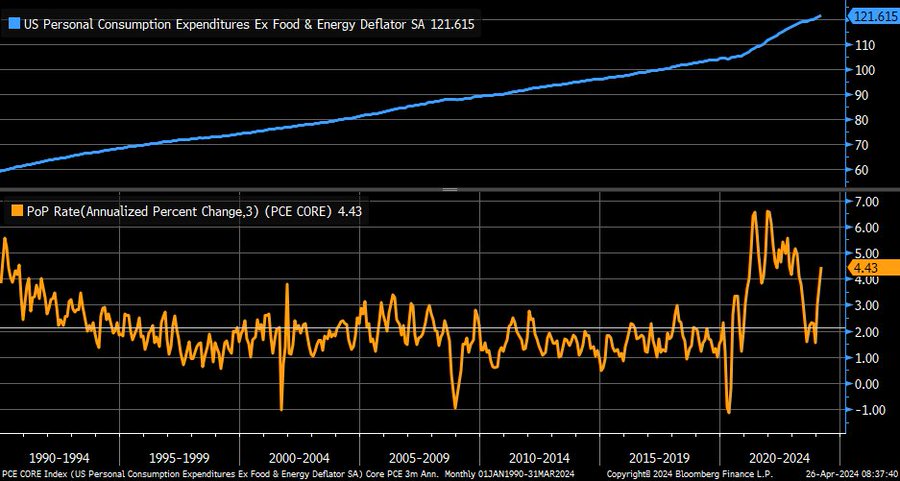
This is clearly not heading in the right direction: 3-month annualized change in core PCE #inflation up to +4.4% in March… the 3 month is a great way to look at the general trend. It’s all showing that the move is higher and not lower, which has shifted the markets views on cuts.
The market is now pricing in that a Fed cut doesn’t happen prior to December. It’s likely now a scenario that shows no cut until 2025 at the current pace.
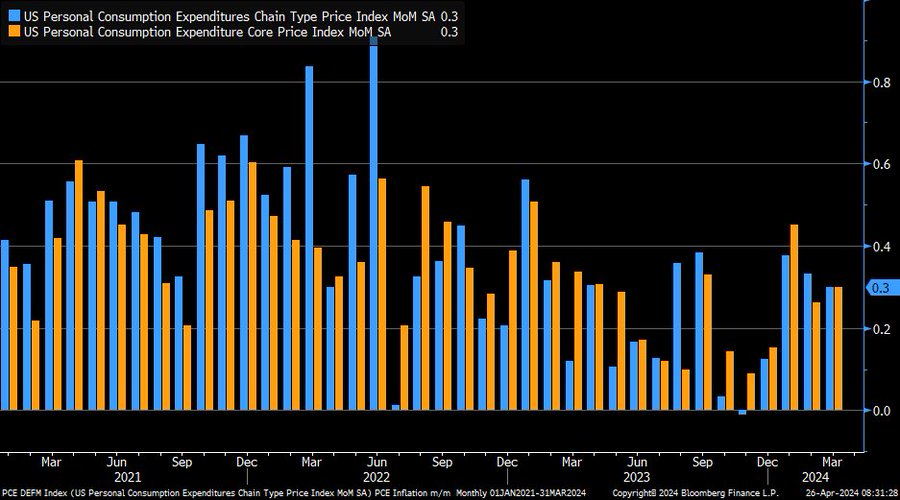
It’s important to see that core inflation hasn’t turned negative in a single month over the last 3 years. This is the best metric to see real consumer pain in that time frame. March PCE inflation +0.3% for both headline (blue) and core (orange)
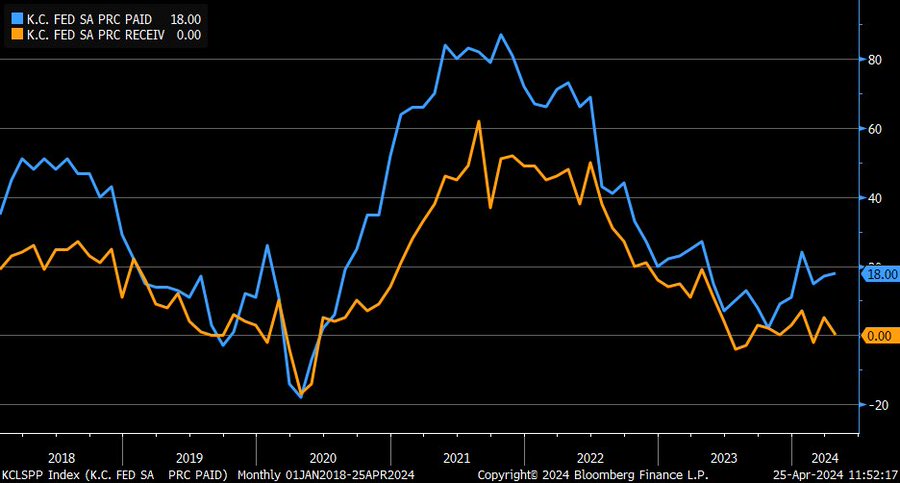
Prices paid are showing more strength higher, which will keep businesses trying to push through more increases. We discussed this in a previous report, and it’s just another data point supporting our views. Two different directions of late for prices paid (blue) and prices received (orange) components in Kansas City Fed Manufacturing Index … former has moved higher while latter has eased (and was flat in April)
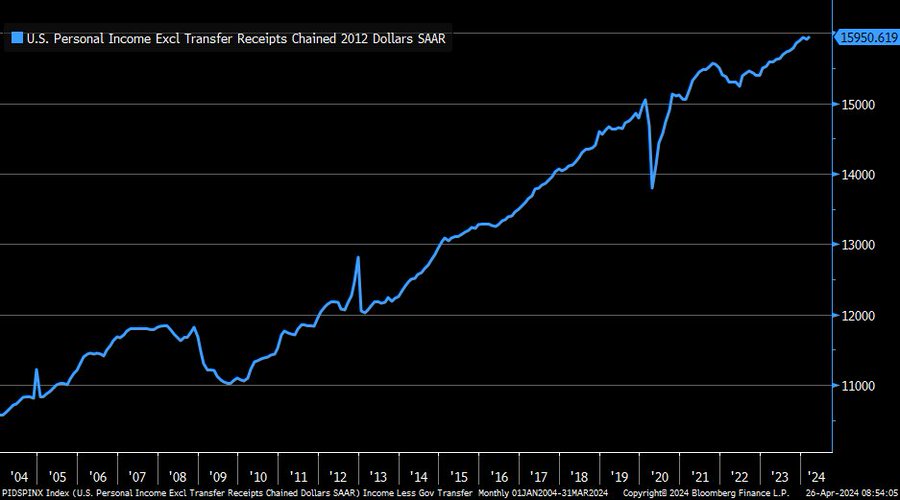
On the real personal income side, it keeps moving higher but at a slower pace than inflation. A concern for the Fed, it letting this run higher and create a wage price spiral. Once you let this cat out of the bag, it becomes VERY difficult to pull it back under control. As of March, new all-time high in real personal income excluding government transfer payments.
Services have continued to be the largest driver, and insurance premiums have surged higher once again. This will weigh on people even more now as car insurance and other “services” spring board higher.
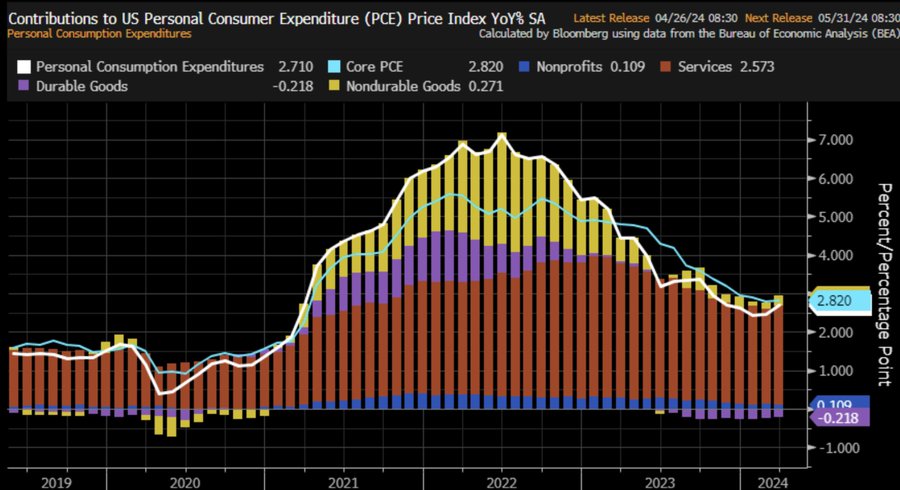
I think this captures the sentiment very well: March PCE inflation, the Fed’s preferred inflation measure, RISES to 2.7%, above expectations of 2.6%. Core PCE inflation was 2.8%, above expectations of 2.6%. We now CPI, PPI and PCE inflation RISING for 2 straight months.
Core PCE inflation, annualized rates:
- 1 month: 3.9%
- 3 months: 4.4%
- 6 months: 3.0%
- 12 months: 2.8%

Pressure only mounts when you review the shift in revenue growth at the corporate level. There isn’t a single area of “safety” in the developed world:
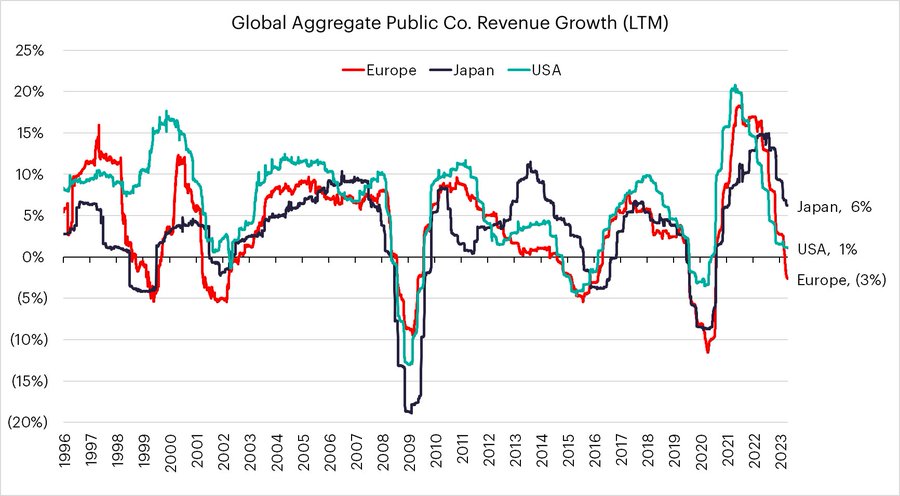
This all filters down to the Emerging Market world that is contending with slowing orders, a crushing debt load, rising 10-year yield, and a strong USD. All of these factors affect not only local corporations but also governments.
China is facing some slowdown at the tail end of the quarter, which also showed up in U.S. and global data. It’s interesting to see that hit, and we don’t see any leading indicators that show a stronger pivot. It holds fairly flat, which is why May will be so important. Does May show any adjustment for Spring/Summer adjustments or does the sluggishness carry through?
Here’s a good summary of the Chinese GDP Print:
- Growth momentum slowed in the final month of Q1, weighed down by sluggish consumption and a shrinking property sector.
- If these issues persist, GDP growth later in the year will be less rosy than Monday’s print.
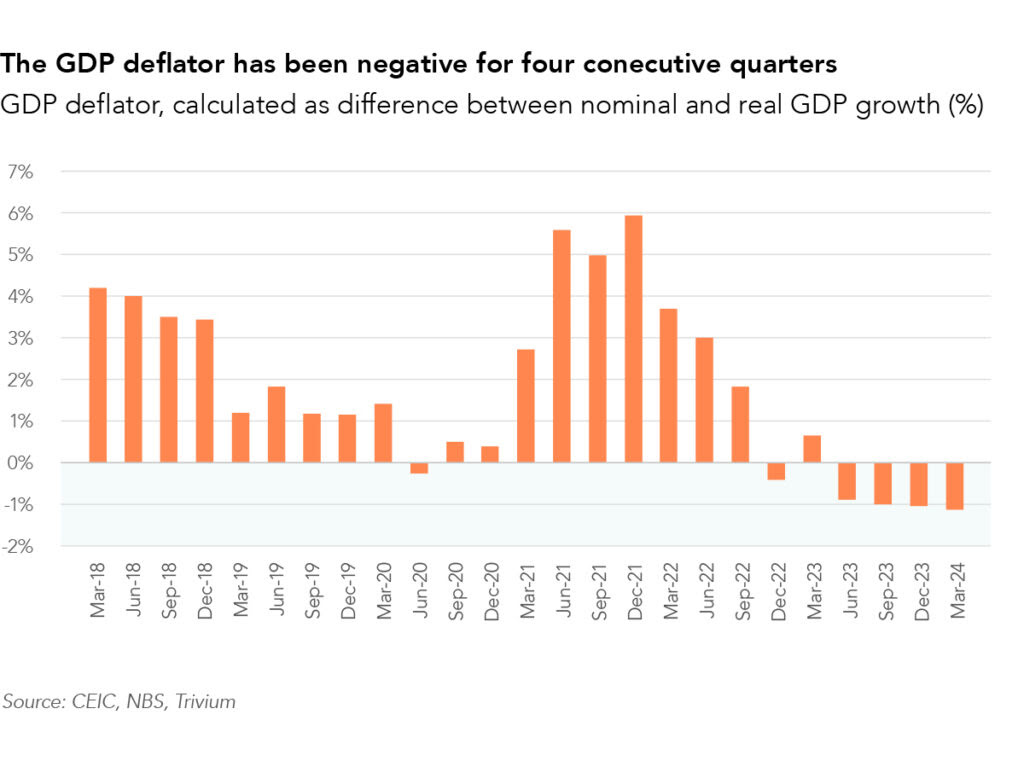
The GDP deflator is a good handle on how the nominal and real numbers show growth:
According to data released by the stats bureau (NBS) on Monday:
Real GDP grew 5.3% in Q1 2024, up from 5.2% in the previous quarter
On a seasonally adjusted quarter-on-quarter basis, GDP grew by 1.6%, up from 1.2% q/q growth in Q4 2023
High-value industries are growing faster than the rest of the economy.
The software and IT sectors – broadly covering China’s tech industry – grew by 13.7% y/y, up from 11.2% in the previous quarter.
High-tech manufacturing grew 7.5% y/y, up from 2.7% y/y in 2023.
Caixin’s new economy index – which approximates the contribution of high-value-added industries to total GDP – averaged 30.2% in Q1, up from 30.5% in Q4 2023.
In nominal terms – which includes price effects – GDP only expanded by 4.2% y/y, the same growth rate as last quarter.
Nominal GDP growth has remained below real growth for four consecutive quarters, signaling deflationary pressures are deeply embedded in China’s economy.
When you dig into the underlying data, there is concern that the “biggest problem areas” aren’t getting much better. General activity fell below expectations, and this comes with two big holiday periods that saw record travel- or rather- travel that exceeded 2019 levels. It carries forward the view that while people traveled more- they spent less.
Chinese activity data for March were generally below expectations, but remain strong for the quarter, as illustrated by Q1 GDP, up 5.3% y/y and 7.2% q/q ann. with our own seasonal adjustment.
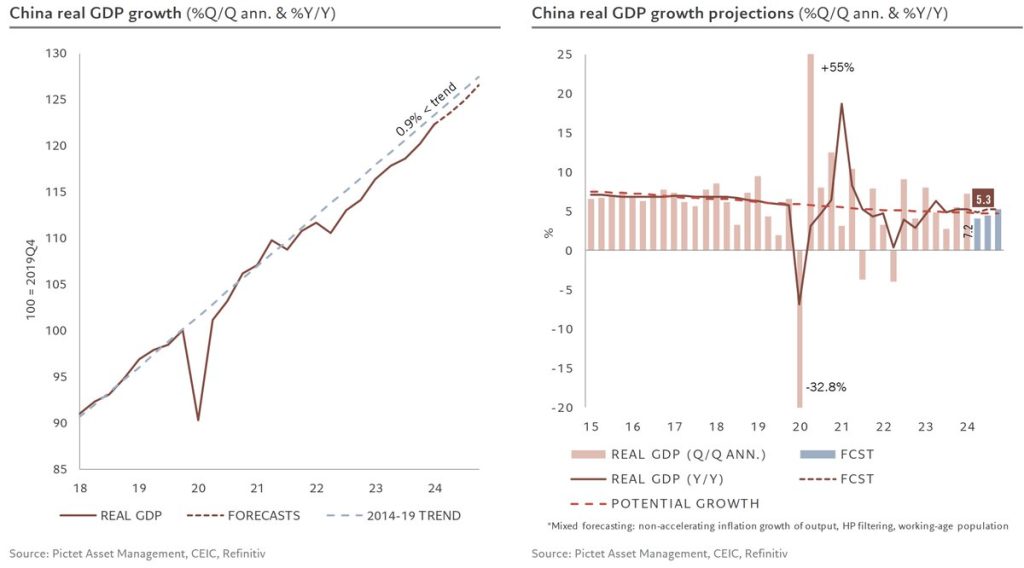
Consumer spending recovered a bit, but still remained far off the pace. The problem is- the pace of spending is unachievable again because a large part was fueled by debt and leverage. Many Chinese consumers invested heavily across real estate and real estate linked assets.
Growth continues to be driven primarily by consumer spending. Although retail sales volumes slowed in March to 2.9% y/y due to an unfavorable base effect, they rose over the quarter to over 9% y/y, above the 6-year pre-pandemic average.
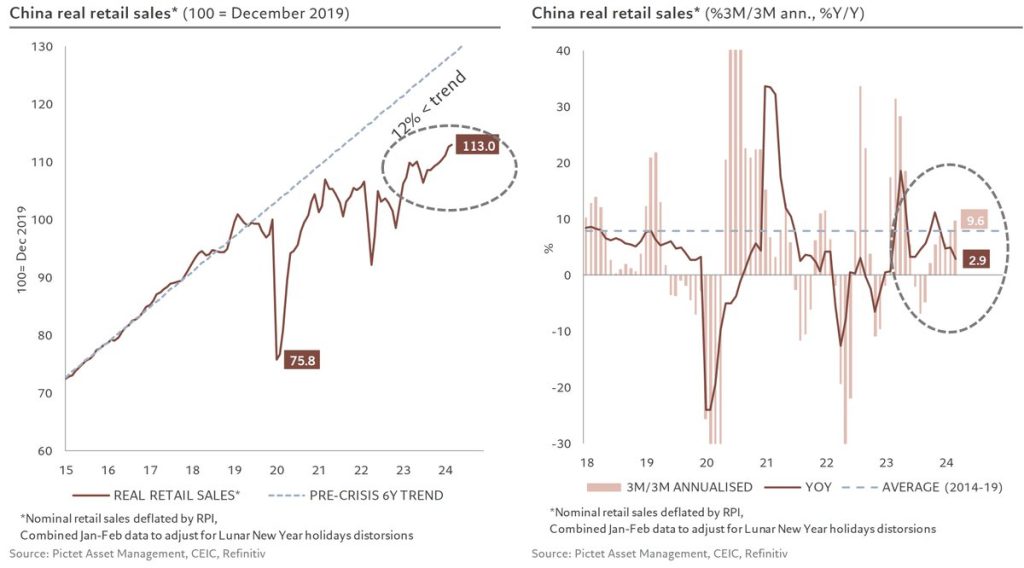
There is still a weight towards services, and its interesting how sales vs spending is playing out. We are being told that inflation is down and under pressure, but there is a sizeable gap in some of the data. You can say some of that is services (which is partially true), but there is a missing component within that structure.
Total consumer spending, including services, rebounded even more strongly over the quarter (13.5% ann.) and is now only 2% below its pre-pandemic trend, compared with 12% for retail sales.
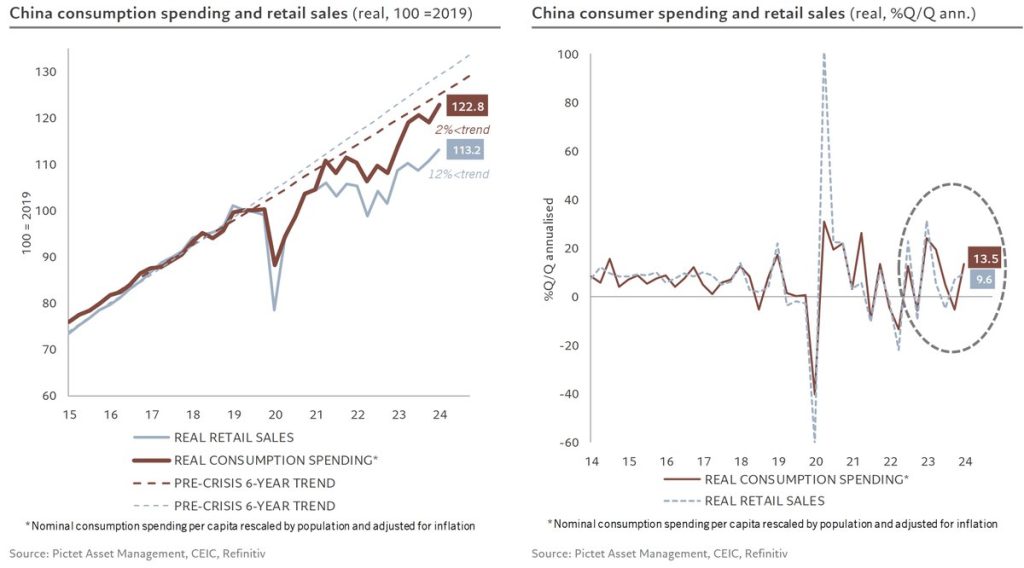
We are seeing some of the savings get pushed back into the market (which is good), but a lot of that was centered around holiday travel. Consumers took the opportunity to go see family, so this isn’t something I see progressing in a meaningful way.
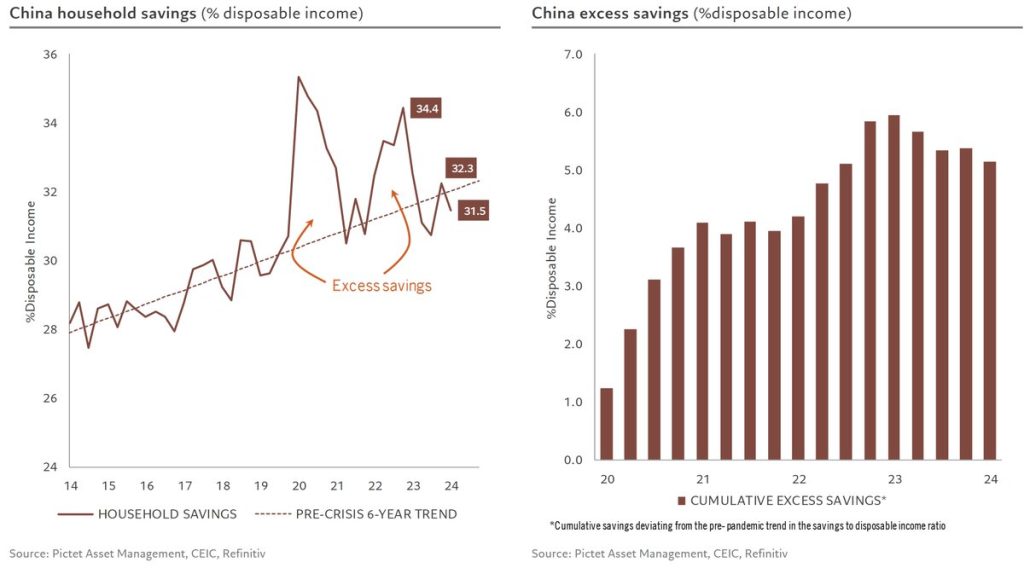
Consumption grew at a faster pace than disposable income, with households reducing their savings rate somewhat over the quarter (still spectacular at over 30%), thereby reducing the excess savings accumulated during the pandemic to 5.1% of income.
There is an always a lot of talk around the amount of savings the Chinese consumer is sitting on. While the number is impressive, it doesn’t factor in the amount of losses they have taken in real estate and RE linked assets. The average Chinese consumer was levered 64% of their net worth to RE with only South Korea higher at 68%. This compares to the maximum (on average) in the U.S. of 28%-32% during the Financial Crisis. Chinese consumers are still underwater by 15%-18% on losses, and unfortunately, many of those apartments will never be built. So it isn’t like they can have a “fire sale” to recoup some of those losses.
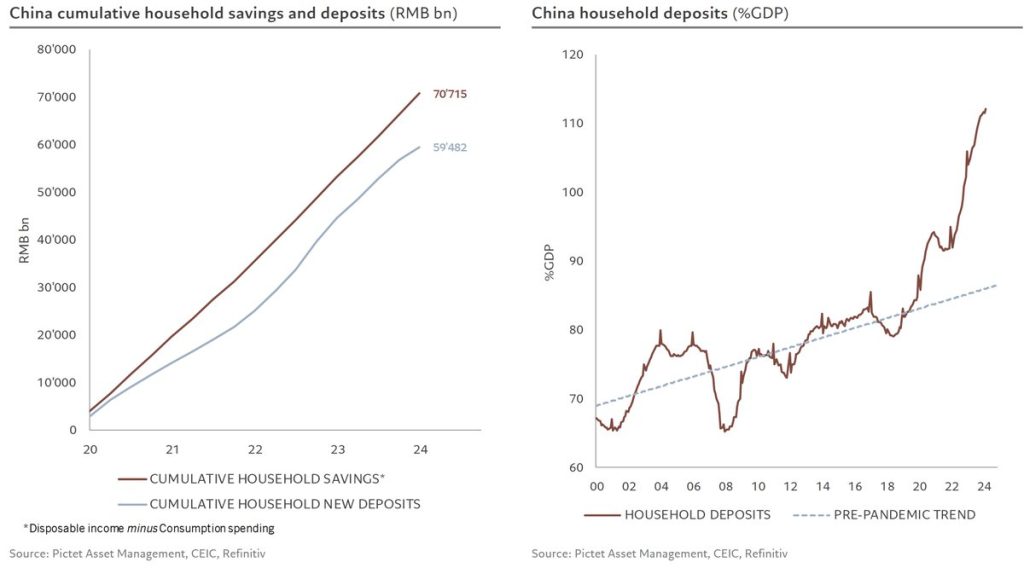
The savings accumulated since the pandemic (over RMB 70tn) are still largely held in bank deposits (nearly 60tn), as consumers still seem wary of returning to the financial or real estate markets.
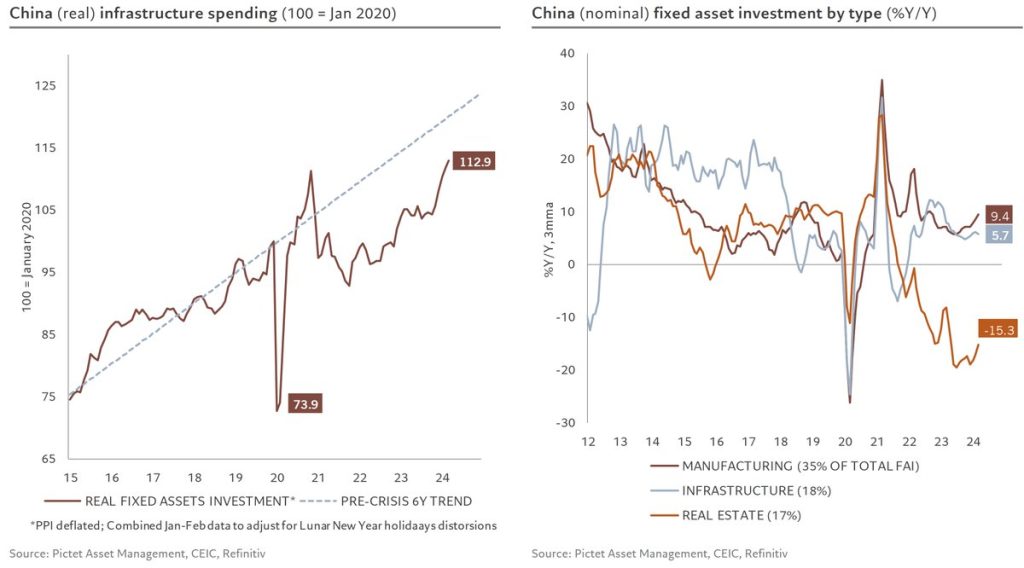
Infrastructure continues to receive significant subsidies and government debt. The Special Purpose Bonds (SPBs) are centered around supporting this part of the economy. This has already been significantly overbuilt, and it just adds more burden to an already saturated market. The CCP is pushing harder for exports, but with a slowing globally economy and massive industrial/infrastructure overbuild- it’s impossible to even remotely get any rate of return. So while the spending “looks positive”- it really doesn’t translate to meaningful (or any) economic growth. Instead, it worsens the debt burden and leverage for provinces struggling to payoff current interest and liabilities.
Real investment spending has made a positive contribution to growth since the last quarter of last year, thanks to infrastructure and manufacturing investment offsetting a still significant contraction in the real estate sector.
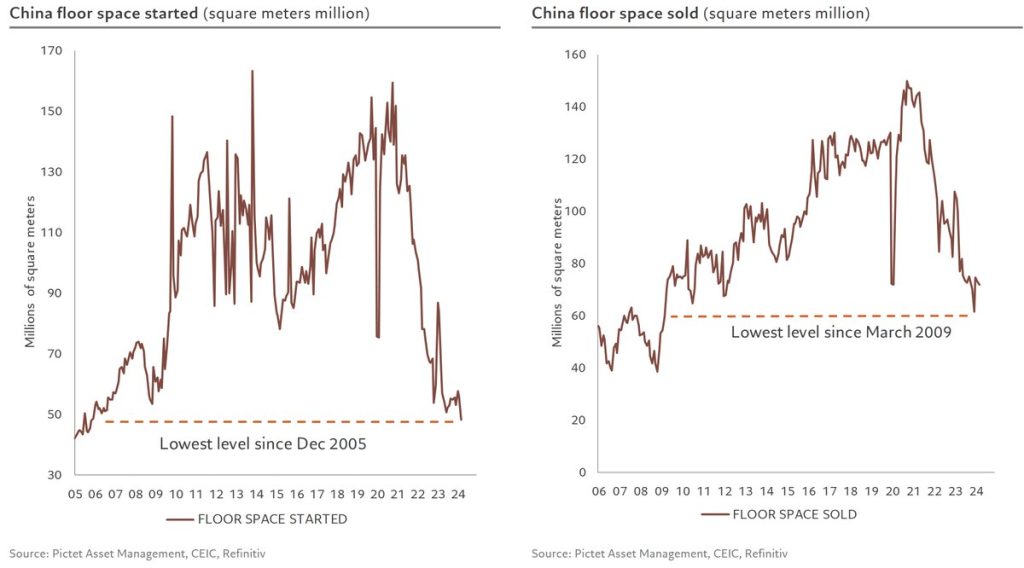
The real estate market resumed its downward spiral, and we don’t see an end or “floor” insight.
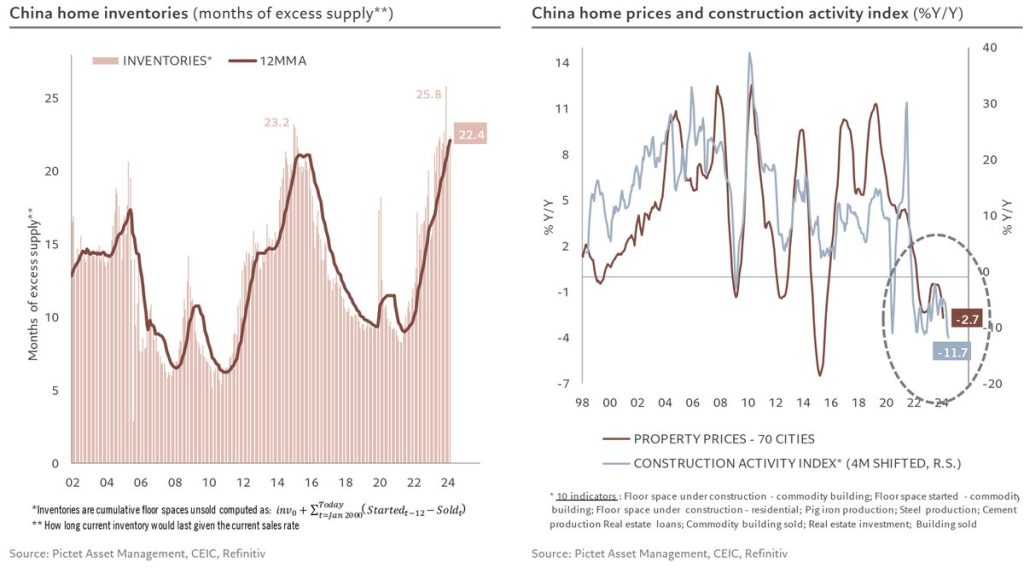
After 6 months of stabilization, or even a very slight recovery, the supply of residential space fell again in March, reaching new lows not seen since December 2005, while residential demand remained unchanged at a very low level.
Even if a building was completed, it doesn’t mean a consumer can unload it at a meaningful appreciation or even at breakeven. The overhang is massive and structural in nature, which is why this will really take years to work through.
As a result, unsold floor spaces remain high at over 22 months at current sales rates and continues to weigh on house prices, whose contraction of 2.7% y/y continues to follow our construction activity index, which has never fallen so sharply (-11.7%) in its 25-year of history
This is why a lot of these GDP movements are very much overstated- especially as it relates to the consumer. When we review underlying consumer spending, it will still lag and until the Yen appreciates- Japanese exports will win.

Industrial production is the level of activity that I find most concerning because this is “hoped” to be the growth engine. It’s receiving the largest amount of fiscal support, but given insane oversupply and slowing exports- it will be difficult for this sector to carry the Chinese economy.

Underlying sales missed in a sizeable way, and between the Industrial and Retail sales for March- you can see how slow Q1 ended.

The new home prices have yet to see a positive shift, and this comes with a significant amount of CCP and PBoC support. They’ve reduced rates, created more first-time homebuyer incentives, reduced regulation on second homes- but no matter what- pricing remains very weak. This is a trend that will carry forward through this year- in my opinion. Until we get some meaningful appreciation, the consumer is going to be deep underwater and unable to meaningfully spend.

Any index you use for secondhand home prices, show a slowdown in pricing and more pressure creeping into the market. The CCP, PBoC, and banks have promised more support- but it will be difficult to stimulate further without a structural shift in policy.

The swap differential is showing that there is still uncertainty about the Chinese economy. The CCP has stepped up their purchase of ETFs in an attempt to support the market, but we’ve seen these methods tried and failed to stop the bleeding.

The CCP has stepped up the calls for the PBoC to get active in the bond market. China’s Ministry of Finance said it supports allowing the central bank to buy and sell government bonds, reaffirming a comment by President Xi Jinping that ignited market speculation about a change of monetary strategy. The ministry called for stepping up coordination between fiscal and monetary policy and “improving the mechanisms of base money injection and money supply adjustment,” in an article written by a study group and published by the People’s Daily on Tuesday. It was based on a recent book that compiled Xi’s statements about finance and economics.”[2] This has clear short term benefits, but as we’ve seen with the U.S, Europe, and Japan- the effects are very limited and typically disastrous.

I just have to laugh- think about the amount of debt the U.S. and Japan have- I think the PBoC is smart to shy away from additional intervention.
Chinese firms (while not buying treasuries) are investing abroad at the fastest pace in eight years. It’s unlikely to see that change given the opportunity that exists outside of China. Chinese companies are investing in other regions, and it’s unlikely to see that change- which will frustrate Xi. I think it will be important to watch the policy structure throughout the remainder of the year.

Across the board, bond sales have been slow to roll out because authorities are still seeking suitable projects to spend funds. The Ministry of Finance comments suggest governments are in no hurry to increase support for the economy which could add to investor concerns China is underestimating the amount of stimulus needed. “The ministry called for stepping up coordination between fiscal and monetary policy and “improving the mechanisms of base money injection and money supply adjustment,” in an article written by a study group and published by the People’s Daily on Tuesday. It was based on a recent book that compiled Xi’s statements about finance and economics.”[3]
I think the market underestimates or doesn’t appreciate the Law of Diminishing Returns. China has been utilizing stimulus for decades, and they have leveraged the local and provincial governments to the gills. This limits the amount of stimulus possible, and I think the PBoC understands it more than most. This will keep them on the sidelines- fiscal and monetary support will continue- but it’s impacts will be muted, if not, completely negative.
Stimulus isn’t the answer any more… this isn’t a cyclical problem but rather a structural one… and it’s GLOBAL!
- https://www.bloomberg.com/news/articles/2024-04-25/us-economy-expands-at-1-6-rate-trailing-all-forecasts?sref=9yOLp5hz
- https://www.bloomberg.com/news/articles/2024-04-23/china-finance-ministry-echoes-xi-s-call-for-bond-trading-at-pboc?sref=9yOLp5hz
- https://www.bloomberg.com/news/articles/2024-04-23/china-finance-ministry-echoes-xi-s-call-for-bond-trading-at-pboc?sref=9yOLp5hz


