The crude markets weakened further driven by the overhang of excess supply in the physical market. The Atlantic basin is flooded with crude, and it will likely persist until European refiners come back from maintenance. Even when they return, we expect it to be below normal seasonal run rates. The overhang in the Atlantic Basin and discounts growing on global physical grades will result in a sizeable slowdown in U.S. exports. We expect to see a reduction of U.S. exports by 300k-400k barrels a day, which will build quicky in PADD3. Since U.S. refiners have already maxed out their runs of U.S. shale, the only outlet is the global market. Many refiners have already purchased for summer runs, and it’s been very underwhelming. Here is a snapshot of some of those pressure points and regions with broader overhangs:
- North Sea Weakness Opens Eastern Trades But Demand Poor: Sparta
- A variety of Atlantic crudes for late-July arrival to the East are priced at a discount to the regional Murban grade; that includes WTI, Forties and some light-sweet West African grades
- Dated Brent finished below $80 on May 23rd as North Sea differentials and cfds continue to fall. Dubai was $3.50 above dated Brent, which suggests OPEC (led by KSA) should cut their OSPs to Asia. They will likely increase them to Europe because it will slow any purchases from the region and send more to Asia.
- Europe doesn’t need the light sweet crude anyway so it wouldn’t change the market or tighten anything in the Atlantic Basin.
- Freight rates for West Africa to UK/continental Europe cargoes increased to the highest level in a month. The amount of crude held off West Africa on tankers that have been stationary for at least seven days rose to by 51% week-on-week, Vortexa data show.
Demand for crude is weakening across the board as refined product builds grow and cracks spreads remain weak around the world. I was expecting to see more of a bounce in the distillate crack across Asia as Middle Eastern product flowed into the Atlantic Basin and Chinese exports slowed. Instead, China’s product exports ebbed and ME flows headed to Europe without any change in Asian (specifically Singapore) crack spreads. They stopped weakening, but there wasn’t a meaningful bounce. Asian refiners have also reduced run rates 2-3% below seasonal averages, and it hasn’t been enough to adjust the economics. This points to much weaker demand in the distillate market, which is an even bigger problem as gasoline demand has already struggled in the region. Now we have European data showing more pressure across the board- especially as gasoil stockpiles are rising. Europe has seen product stockpiles remain elevated even as many facilities are in turnaround. This all points to Brent pressure, which is why we think May finishes in the range of $80-$85. June will likely have the same range, and if the driving season doesn’t materialize in a meaningful way (which is our base case)- Brent pricing will move lower with a range of $77-$83. The pressure for crude pricing remains to the downside as economic overhangs persist resulting in much slower demand and reduced refining run rates.
The overhang in the light, sweet market will result in more U.S. crude getting stuck on the coast. This will push the spread between WTI and Brent wider even as U.S. crude makes up a portion of the Brent contract. This is a mixture of investor mindset as well as specific issues impacting multiple crude products originating from the U.S.
The overhang in WAF is made worse by Chinese slowing down crude purchases and reducing run rates. There was a decent amount of activity when crude prices fell below $85 with a lot of purchases taking place between $83-$85, which doesn’t include the discounted barrels purchased from Russia, Iran, and Venezuela. As refiners reduce run rates, China is taking the opportunity to replenish some of the oil reserves. We expect to see another round of purchases when the new import quotas are announced, but even with that purchase program, China is importing well below market expectations.
- China Ramps Up Restocking of Oil Reserves as Prices Soften
- Nation added more than 30 million barrels over the past month
- Kpler says May imports to be higher than April despite work
- China’s State Refineries Cut Runs to Lowest Since Dec.: OilChem
Nigeria waited far too long to cut pricings for May loadings, which has resulted in a lot of oil left to move this month. They will have to drop prices well below Dubai in order to clear the glut in May, but the problems will carry over into June given the number of cargoes left to sell. Europe had been the saving grace for Nigeria, but with them in turnaround and saturated with U.S. crude- the glut in WAF is unlikely to clear quickly. The pressure has pushed Dated Brent CFDs into over 80c contango over the first four weeks, and Nigerian Bonny Light has gone fully negative versus dated Brent. I don’t see Nigeria recovering in the near term given the overhang and the need for it to remain below Dubai. Saharan blend didn’t fair much better as its still negative against dated brent. There really isn’t much to be bullish about in the physical market. The below is a great chart showing where things sit versus dated brent. Nigerian crude differentials to Dated plummeting into discounts. The Atlantic basin is flooded with light sweets, pockets of demand are only on the medium sours today.

I don’t see where these Nigerian barrels will clear (8Mn bbl still unsold for May) and China is not picking them up, Dubai benchmark barrels were cheaper to Asia. This is why Nigeria will have to keep things much cheaper for longer.
Nigeria’s unsold barrels for May declined in recent days but June’s trades were slow, according to traders. Angola’s June barrels continued to secure deals. Greek refiner Hellenic Petroleum made a rare purchase of Nigeria’s Qua Iboe grade for May loading.
WAF SALES:
- About 5-7 cargoes of Angolan crude for June loading are still hunting for buyers out of 37 scheduled: traders
- Compared with less than 10 lots unsold as of May 14
- About 5-6 lots of Nigeria’s May crude were still for sale
- Shrank from about 10 on May 14
- Nigeria’s trades for June-loading have been slow in recent days, the people said, with about 30 lots still left, near-steady versus a tally on May 14
- June offer prices aren’t competitive enough versus rival grades, one of the people said
Our base case for the OPEC+ meeting is for a rollover of cuts that we expect to be extended through the rest of the year. The market’s base case is for an extensive through Q3, but I would be surprised if they didn’t just carry it through the rest of the year. OPEC+ is facing a much bigger slowdown on the demand side versus expectations. I’ve been fairly bearish on the demand side, and it’s even surprising to the downside against my estimates.
When we look at the driving season, there is still some hope that the market will be supported by a robust summer. There was some hope that gasoline was going to stay strong, but there is always a bounce ahead of Memorial Day weekend. It’s always important to look at everything in a 4-week rolling average to smooth out the seasonal bumps: Week-to-date vs last year, we’re now down 7.7%. Based on the historics, gasoline demand will probably fall back from 9.3M to 8.5M or so because many stations “pre-fill” ahead of the big demand surge.

Distillate can’t find any real driving force higher and still shows a much broader slowdown. The market is putting all its hope in gasoline, which is going to be difficult given the setup for spending. Even with a big pull for gasoline distribution, there wasn’t much of a change at the storage level, and we still see a pick-up in imports across the East Coast (PADD1). President Biden initiated a release of 1M barrels of gasoline from the strategic gasoline reserve (it has 42M barrels in it) to aid in the price of gasoline. The biggest issue for PADD 1 flows is the lack of refining capacity in the area, reliance on Colonial pipeline, and lack of enough Jones Act vessels. Gasoline storage is already 10.5M barrels over last year, and we see this gap closing further. The distillate side is playing out in a similar way with storage closing in on the 5-year average as exports slow and demand languishes.
Crude continued to build driven by PADD 3, which we see continuing as exports slow down over the next few weeks. The oversupply of light, sweet crude in the market will push back into the U.S.

There was one last surge of exports of crude, but we see that falling to an average of 3.8M barrels a day.

Some of the bigger entities are starting to adjust their demand assumptions for 2024. OPEC kept supply/demand flat, but others have started walking back their demand figures. It comes on the back of weakness in Asia and Europe with more refinery run reductions around the world. The U.S. will likely remain operational, but we don’t see them going anywhere above historical norms.
There is now some hope around a very active hurricane season with the expectation of a record number of named storms. The typical backdrop for trading hurricanes is as follows.
- Purchase crude on the formation and trajectory of landfall
- Sell the hurricane landfall
- Buy products on hurricane landfall
The sizing and action needs to be based on strength of the storm and path, but this is usually the way to handle hurricane season.
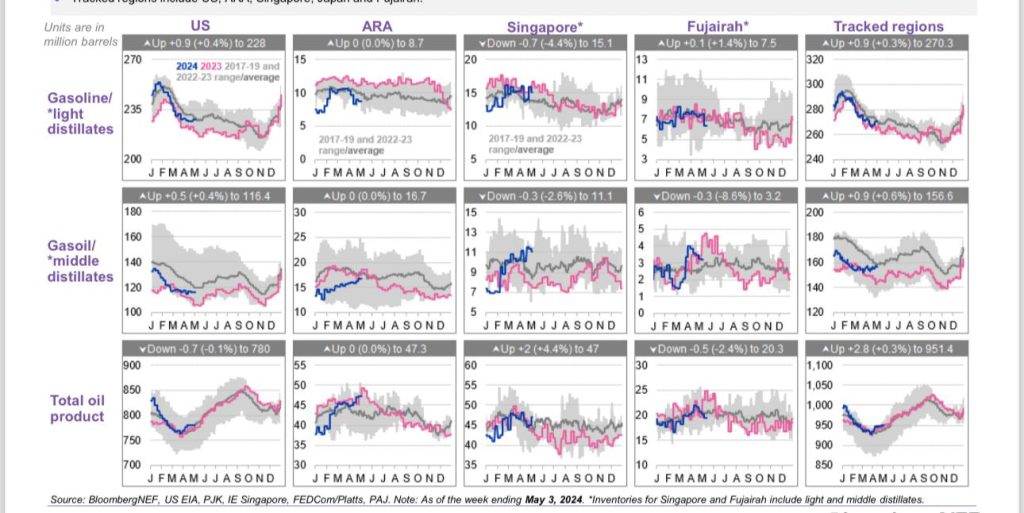
When we look at the global product markets, you can see just how much of a change has come into refined products- especially along middle distillate. The below gives a snapshot of the backdrop, and I don’t see summer changing any of the directions. Singapore and Fujairah show the biggest pivot, and points to much slower economic growth/demand in the Asian markets. The Middle East (Fujairah) is the swing producer/exporter of refined products, and they are showing the bigger issues on broader demand.
On a geopolitical front, Iran’s President Ebrahim Raisi died in a helicopter crash on May 19th. He was a hardliner that increased the militarization abroad and drove more tumultuous times within Iran. I think the below quote summarizes very well how little things will change going forward.
“Without Raisi, it may seem like Iran is headed for a period of great turbulence. Before his ascent, Iran’s supreme leader, Ali Khamenei, spent 30 years in near-constant conflict with Iran’s presidents, sparring over what path the country should take at home and abroad. But Raisi adopted Khamenei’s preferred, Middle East–first approach to foreign policy, expanding Iran’s regional influence and improving relations with its neighbors, including its rival, Saudi Arabia. He made sure that Iran’s presidential bureaucracy synced up with the supreme leader’s. He deepened ties with China and Russia and vastly expanded his country’s nuclear program. Raisi was so loyal to Khamenei that he was widely viewed as his heir apparent.
Yet it is unlikely that Raisi’s death will cause much tumult in Tehran. In fact, it is unlikely to prompt much change at all. Despite popular discontent and an expanding crisis of legitimacy, Iran’s powerful ruling class remains steadfast in its commitment to Raisi and Khamenei’s strategy. Iranian elites will ensure that the presidency stays in the hands of a loyal establishment conservative. They will keep the country’s policies steady. There will still be palace intrigue, as the country gears up for a snap election and ambitious politicians launch their candidacies to succeed Raisi. But Iran’s next president will almost certainly be just like its last one, and nationwide grief at Raisi’s death will ensure that the winning candidate has a smooth transition.”[1]
Based on all the publicly available evidence, it seems to be an accident that was driven by poor decisions in equipment and flying during inclement weather with limited visibility. I don’t see a change in military or terrorist activities because of his passing.
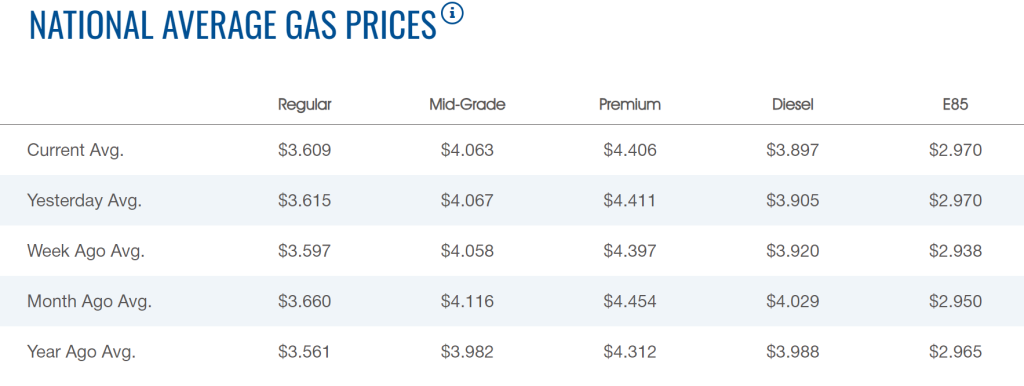
The biggest issue will remain on the economic side with consumers staying weak and/or weakening further around the world. National average gas prices remain over prices for last year- especially in plus/premium. I expect to see prices to continue a steady downward trend, but it will be measured in penny/ half a penny and not a bigger drop. This will keep us either above or in-line with where we were last year, but the problem is- the consumer is in a WORSE place versus last year.
I think this gives a great summary of the issues facing the general American public.

New Fed data highlights consumer weakness:
- 52% of US adults could not handle a surprise bill of at least $2,000 using savings in 2023, the highest share since 2020.
- 42% of these people could not even cover a $1,000 surprise expense, according to a Fed survey.
- Shockingly, almost 1 in 5 respondents could only afford an expense of below $100.
- 17% of surveyed Americans also said they did not pay all their bills in full in the month prior to the survey.
- Meanwhile, 28% of adults financially struggled last year, the largest share in 7 years.
Just looking at this general summary- it’s difficult to say that we are going to see a pick-up in spending- especially during the summer months. Will there be more activity versus the winter- absolutely- but it will be below seasonal norms.
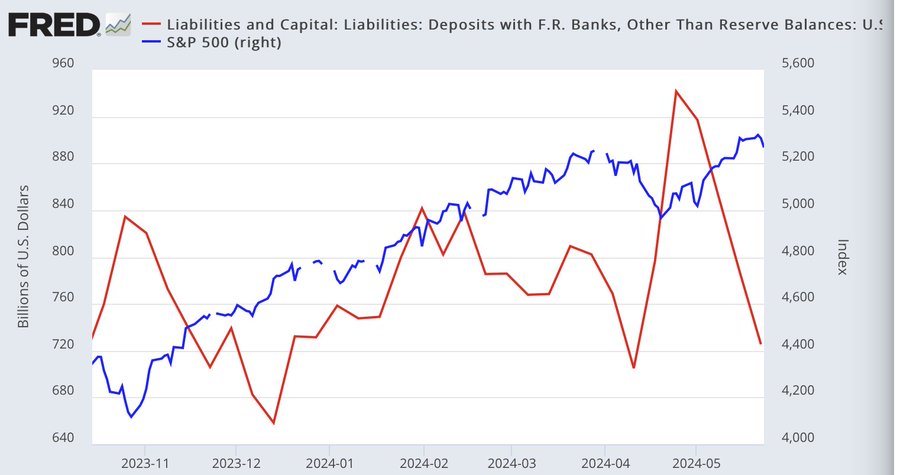
Even as consumers slow, we aren’t seeing a pivot lower across the inflation basket. This is mostly driven by the fiscal side of the equation as the government runs a steep deficit. “Yellen’s been busy draining the TGA account again to the tune of $220B since the April lows in case you’re wondering where all that market lifting liquidity has been coming from after the relative tightening during the April correction.”
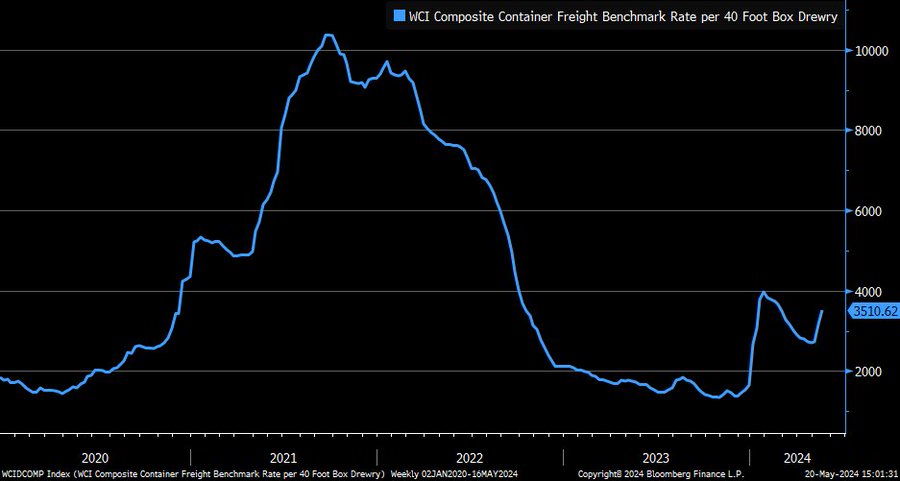
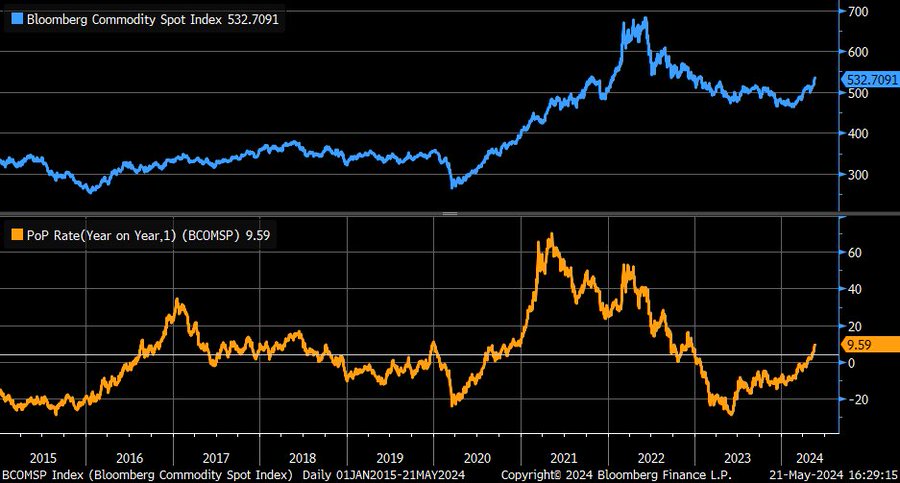
Not only do we have fiscal spending, but commodity prices as a basket are driving higher once again. This comes at a time when freight rates have also moved back up.
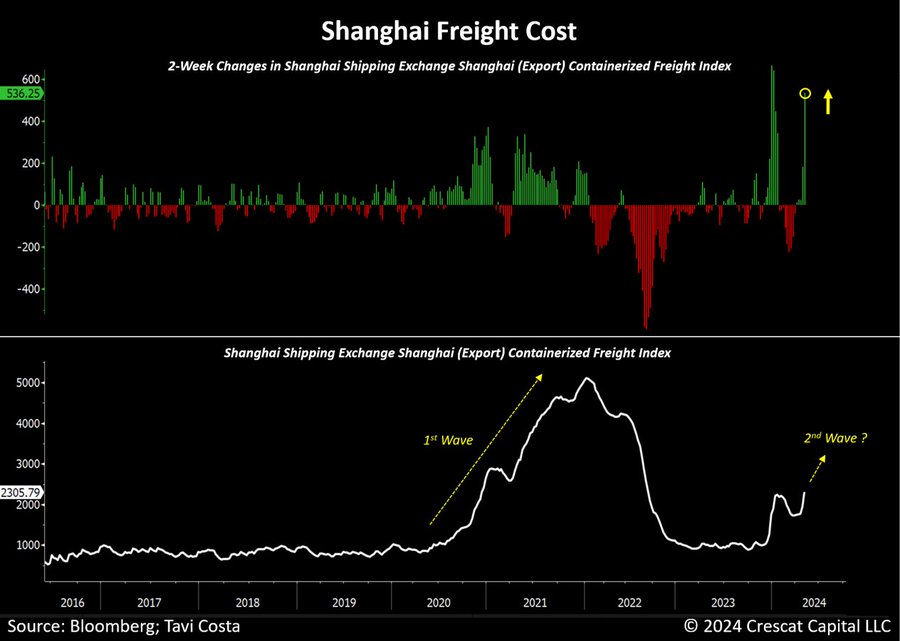

Here is a look at the global rate. It’s moving higher and will likely move back to the highs from the beginning of the year. It won’t get to the levels last seen in 2021, but we are definitely moving in the wrong direction.
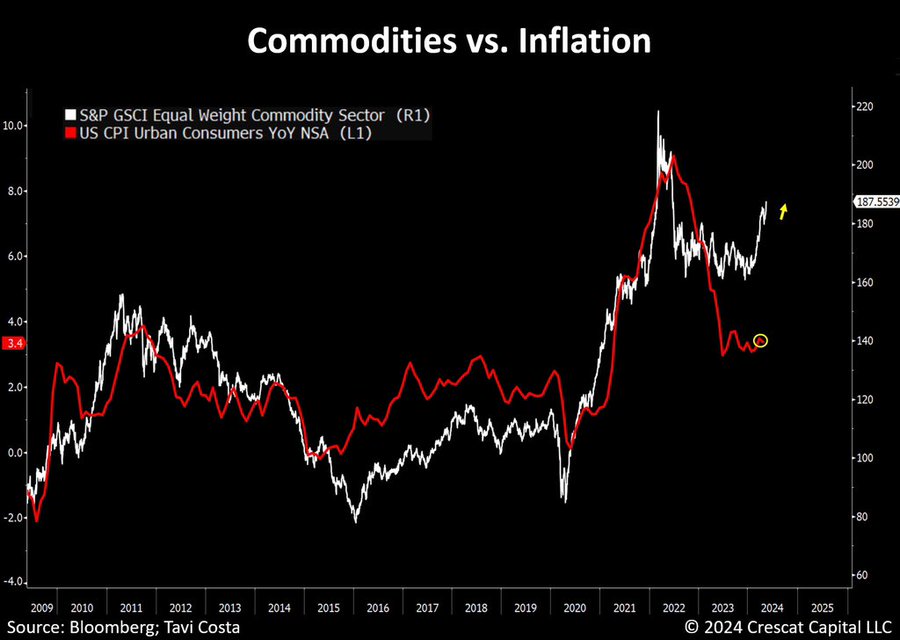
The below inflation dashboard doesn’t show any saving grace- especially as the “hard comps” are falling away. This will push the year over year higher/ faster, which has been demonstrated in the month-over-month and 3-month running average.

There isn’t a metric out there that shows a better setup:
“Fast food meal price inflation has skyrocketed by 41% since 2017. By comparison, average hourly earnings of non-manager jobs have increased by only 36% during the same time. Over the last 4 years, fast food prices have increased by 31% versus the average hourly wage surge of 25%. Meanwhile, over the last decade, prices at McDonalds, MCD, have DOUBLED. Since the pandemic, fast-food restaurants have seen larger price hikes than grocery and gas prices. Fast food is no longer affordable.”

Delinquencies are rising at a rapid rate, which is only going to accelerate given the level of credit card interest and compounding effects.
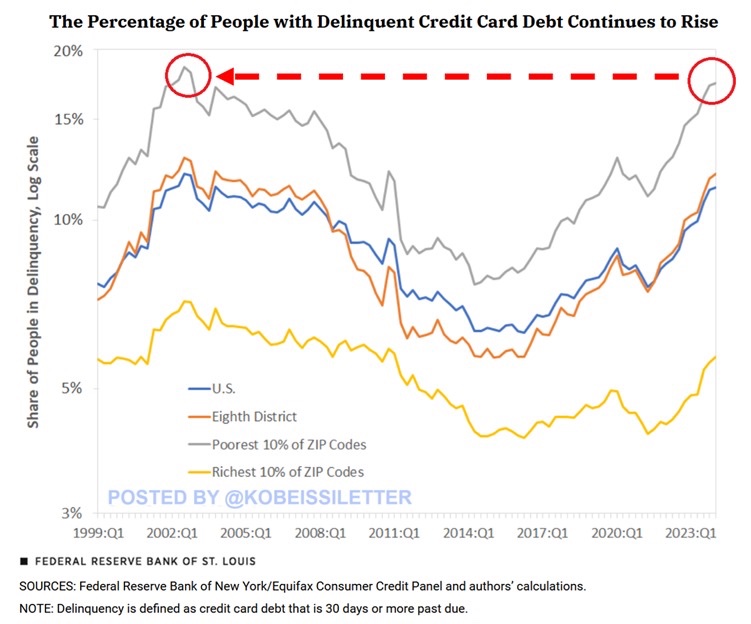
- 1 in 6 Americans from the poorest 10% of ZIP codes are in credit card debt delinquency, according to the Fed.
- The share of people in delinquency in these areas has increased from 11% in Q2 2021 to 17% in 1Q 2024, the highest in 21 years.
- In just 10 years, this percentage has more than DOUBLED.
- Meanwhile, the share of people with delinquent credit card debt nationally is at ~12%, the largest since 2003.
- For 90% of Americans, delinquency rates on credit card debt are now above levels seen in the 2008 Financial Crisis.
Here is a great breakdown on the Credit Card side:
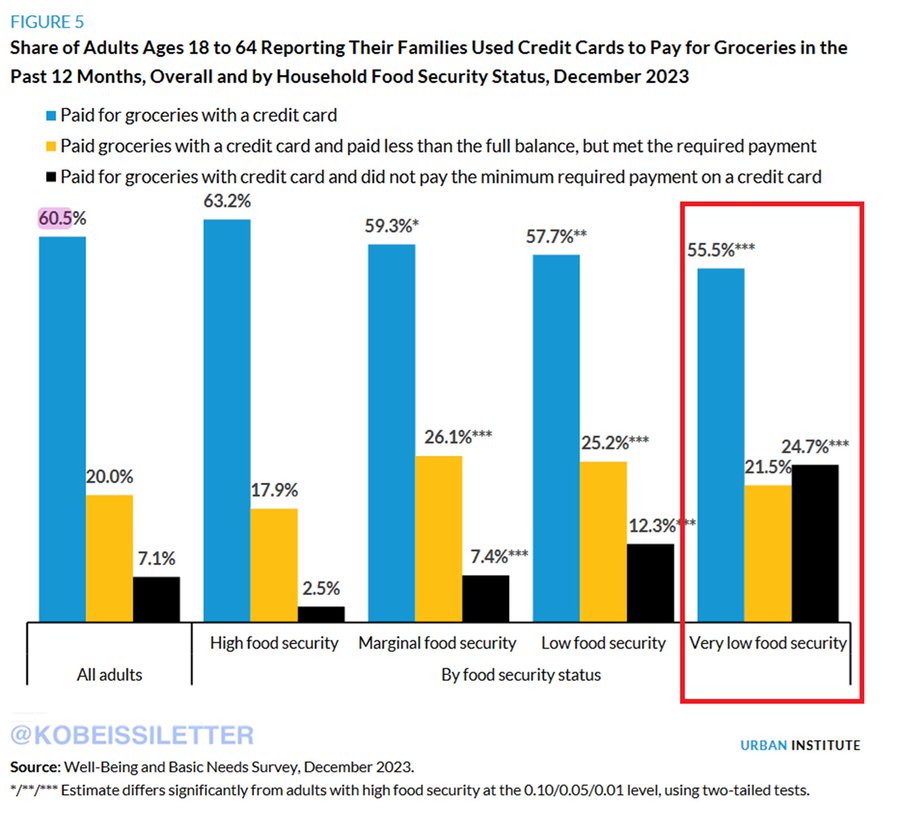
- 61% of Americans aged 18-64 paid for their groceries with a credit card in 2023.
- 19% of adults in the US used savings not intended for routine living expenses and 3.5% exploited the Buy Now, Pay Later option.
- 20% of adults who used credit cards did not pay the full balance but met the required payment.
- However, 25% of those with very low food security did not even pay the minimum required payment on their credit cards.
- Record levels of credit card debt can barely cover living expenses for many Americans.
This is playing out across the developed world with consumer pressure already being pronounced in Europe for several years now. The European consumer never really recovered from the financial crisis from 2011-2014.
There has been so much weight put on a strong recovery in China, but as I’ve been saying for several years now- it just won’t happen. The U.S. and China are facing structural problems that take much longer to correct versus cyclical shifts. This is way more than just a slowing business cycle- this is a structural debt problem. The debt sits at different “levels,” but it still all culminates in a debt bubble/ problem.
Credit is contracting again in China, and this comes when there is endless support for more debt. This comes by way of guarantees, lower/preferred rates, and just general CCP obligations to keep the cycle going. The PBoC has been very clear that they won’t cut rates anytime soon, and even with the government support- everyone is tapped out. We’ve said time and time again that there is NO RATE that will get people to borrow more. Everyone is already choking on so much leverage, there isn’t a capacity to borrow more.

These issues are far beyond just the corporate level and hit the household just as hard. Households are still facing mounting losses at the real estate level as prices fell once again.

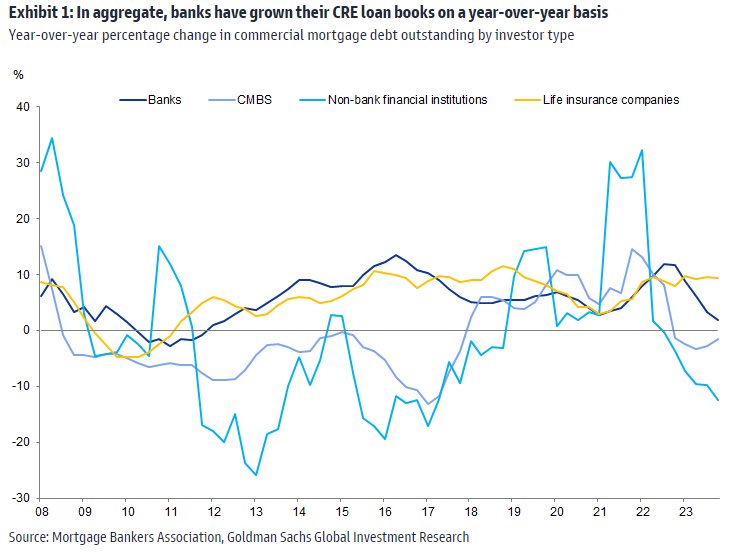
The U.S. isn’t in a better position for loan growth, and I expect this to turn negative over the summer. Bank loan growth has slowed but not yet gone negative … but for non-bank lenders and CMBS, growth is still negative on a year/year basis.
Turning back to China, China’s local governments raised the least revenue from land sales in eight years, another sign of the nation’s deepening housing crisis that has forced Beijing to pump in more cash. Incomes from transfers of rights to use state-owned land — where local authorities sell land to property developers — fell 21% in April from a year earlier to 238.9 billion yuan ($33 billion), according to Bloomberg calculations based on data released by the Ministry of Finance on Monday. That’s the lowest figure since May 2016.[2]

“This adds to weak housing sales and investment data in April that showed more evidence of a deepening housing slump — raising urgency for the government to inject more aid. And they did respond,” said Eric Zhu, an economist with Bloomberg Economics.
This was driven by Chinese land sales falling to the lowest level in eight years.
There’s been a significant amount written about China “selling U.S. treasures,” but the actual data doesn’t corroborate an aggressive sale. We’ve stated in the past that China would liquidate some of their holdings to pull forward USD and use it to stop gap some liquidity holes. When you look at the chain of custody, could China be using the TSY as collateral with other banks? Technically, if the TSY is held as collateral it can’t be shown on the books as “available,” and some scrapers may pick this up as a sale instead of a transfer of holding. The below is an interesting chart creates by Brad Setser with an interesting observation: “And the core issue of whether China has diversified at the margin out of the dollar/ dollar bonds or has diversified its set of custodians beyond the US custodians and Euroclear remains unresolved. The UK and Luxembourg are now holding a lot of Treasuries for someone!”

One of the key things we’ve said time and time again is the issue of the Law of Diminishing Returns. An economy will get to a point where every new dollar yields a “negative util” or negative value for the economy. It actually detracts from the economic prowess because it’s usually created through borrowing, and the excess leverage and interest expense is damaging- just look at the U.S. deficit and interest expense!
The PBoC understands this better than most, but the CCP/PBoC want to show they are taking some sort of action. Every stimulus setup has fallen flat, and this new iteration is no different than any other.
“China’s latest housing initiative is aimed at vacant properties, a major pain point in a crisis that’s dragged on for almost three years. But analysts say the package ofmeasures is still too small to end the rout. The decline in China’s sales of new homes accelerated in recent months, with households increasingly preferring to buy in the secondary market. That’s pushed up the stock of unsold homes and empty land to the highest level in years, discouraging new construction and threatening more defaults by developers — including large state-owned firms. The support package announced Friday features a 300 billion yuan ($42 billion) facility from the People’s Bank of China that will fund bank loans for the state companies charged with buying up completed-but-unsold housing stock. Economists expressed concern both about the limited size of the measure relative to the stock of unsold housing, and the risk it won’t be fully implemented.”[3]

As we stated earlier, NO ONE- business or household- is borrowing more money. Even though it’s available and at favorable rates, the loan growth metrics remain steeply negative. This won’t change with more of the same solution thrown at a very different problem.
There is a huge amount of unsold housing, and it doesn’t matter how much money you throw at the situation.

There’s been talk about creating a “bad debt” bank, which could help ease the pain by lifting the struggling assets off people’s balance sheet. It’s unlikely it would be at parity, but losing 30/40 cents per dollar instead of everything would go a long way. The problem is- the provincial and local governments don’t have the balance sheet to launch such an endeavor. It would have to come from the federal level, but they are hesitant because of the contagion that already permeates the system. Based on the government structure of China, all of the local and provincial government debt is guaranteed by the federal government. Even though it doesn’t show up on their balance sheet, they are responsible for all of it. This makes it VERY difficult to issue more debt to buy struggling homes.
The reason it’s so difficult- who are you going to sell it too? Mortgage rates are already at historic lows, and there was infrastructure and building for the sake of it. China poured money into infrastructure (especially real estate), which they grossly overbuilt. Now- who buys the unwanted square footage?

As developers receive less money, it will put more stress on the banks that lent to them, and the people who gave downpayments and invested in MVPs. The below chart gives you an idea of just how stressed some of these companies are getting on the cash level.

The U.S. has some data bounce in the flash PMI, and some of the leading Fed data come in “less negative.” There is a certain amount of seasonality, but you also have to consider- business still need inventory and consumers still need daily “stuff.” The fact that Feb-April was so low- it would make sense to see a bit of a bounce into May. My concern is that May-June will look “ok”, but July-August are going to get much worse. In the meantime, inflation will relentlessly move higher especially as home prices bounced, commodity costs rose, and the federal government keeps printing.
There’s been some “Disinflation” as retailers trimmed prices as reported sales from Target and Walmart weren’t very good during the recent earnings calls. “Prices are dropping for thousands of items at Target and Walmart, as US retailers’ results indicate fatigue among some consumers after three years of high inflation. Target this week said it would lower prices this summer for 5,000 items ranging from milk to paper towels in an effort to stay competitive. Walmart told analysts last week that it had reduced the prices of a large number of grocery products. The cuts by two of the largest general merchandise chains illustrate how retail prices are levelling off, if not falling, after years of increases sustained by pandemic-era supply chain breakdowns and a sturdy US labour market. Persistent inflation has soured Americans’ mood in an election year: 71 per cent of those surveyed in the latest FT-Michigan Ross poll said they believed economic conditions were negative.”[4]
Even as pricing cools in some areas, it’s picking back up in others, and as the “easier” comps fall away it will show the pressure that has been building month-over-month.
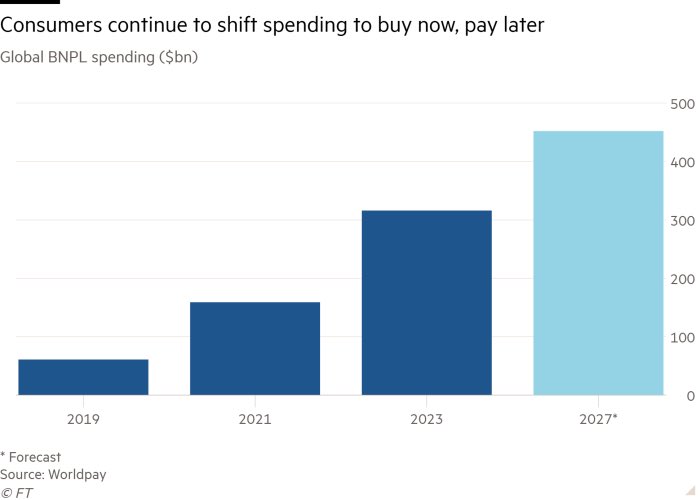
People are also pivoting more to “buy now, pay later.” Consumers are expected to shift more spending to Buy Now Pay Later (BNPL) lenders and per worldpay, worldwide spending on BNPL purchases grew 18% last year to $316 billion per the Financial Times.
The edge still goes to inflation rising, but it will be at a slower pace in May/June- but we see more acceleration in July/August. All of this will keep the Fed on the sidelines with it becoming less likely that we will get any rate cut this year.
- https://www.foreignaffairs.com/iran/death-iranian-hard-liner
- https://www.bloomberg.com/news/articles/2024-05-20/china-land-sales-hit-eight-year-low-in-show-of-property-pain?sref=9yOLp5hz
- https://www.bloomberg.com/news/articles/2024-05-19/china-s-housing-rescue-is-too-small-to-end-crisis-analysts-say?sref=9yOLp5hz
- https://www.ft.com/content/e3b5c1a0-48ac-4922-970a-8b9ca7c2539e

