Brent prices had a nice bounce back above $86 as the U.S. headed into the core of driving season and Hurricane Beryl moved into the Gulf of Mexico. The hurricane has come and gone with no lasting impacts pushing Brent down $2 quickly. This is one of the earliest Hurricanes, and the earliest Category 5 on record, which helped push up futures. The only impact was on some production, but we don’t see any meaningful impact to refining or production. The broader talking point now is a more “robust” hurricane season and risk to PADD3 assets. When we evaluate the physical market, there is more pressure forming to the downside.
An interesting fact going into the end of the month: “Gunvor, which was one the traders bidding up Brent in the last rally, now has 4Mnb of Forties grade unsold for July, probably sending it to floating storage.” There was a significant amount of buying through the end of June/beginning of July. They are still in the money at this point, but when physical guys try to corner the market- it never ends well. The market will sniff out who’s exposed, and result in either a breakeven win or a larger loss.
- Russian exports have shifted higher once again. Our base case has been for export levels similar to 2023. Russia has limited storage and refining capacity that pushes more crude into the floating market. Any thought that they would cut production as a “make-up” for overproduction was always a pipe dream.

- Physical pricing indicators have softened further. I discuss in more detail lower, but I thought it would be good to go through a DFL swap (Dated-to-Frontline). A DFL measures the price of physical cargoes: dated brent vs the 1st month (front month) futures. It reflects crude to be delivered in the short term over the period 10 days to one month ahead against the first month futures. The indicator has been flatlining and starting to roll over.

- CFDs (contract of difference) are bets that the spread between two brent prices: dated brent vs forward brent will be greater or smaller than some agreed amount over a set period of time. On average, Dated Brent and Forward Brent reflect oil to be delivered further forward in time, up to 4 months ahead.

There has been an increase in backwardation, which is an indicator of some softness. The pricing structure has held up, but we are seeing more pressure to the downside as we progress through July. Our view is that Brent heads back below $83 with a range of $77-$83 in July and August. We expect another shift lower in Sept as pressure mounts on the pricing structure.
Time spreads have stayed elevated, which has helped keep futures pricing at about $85. I expect to see some softness come into the market as physical barrels are slow to clear. There was some strength in Nigeria in the near term, but Angola continues to struggle clearing August. WAF: Nigerian crude oil was offered at their highest levels in about a month as sales picked up. Escravos and Forcados were offered at around dated brent plus $3, while light sweet Qua Iboe and Bonny Light were offered at above dated brent plus $2.
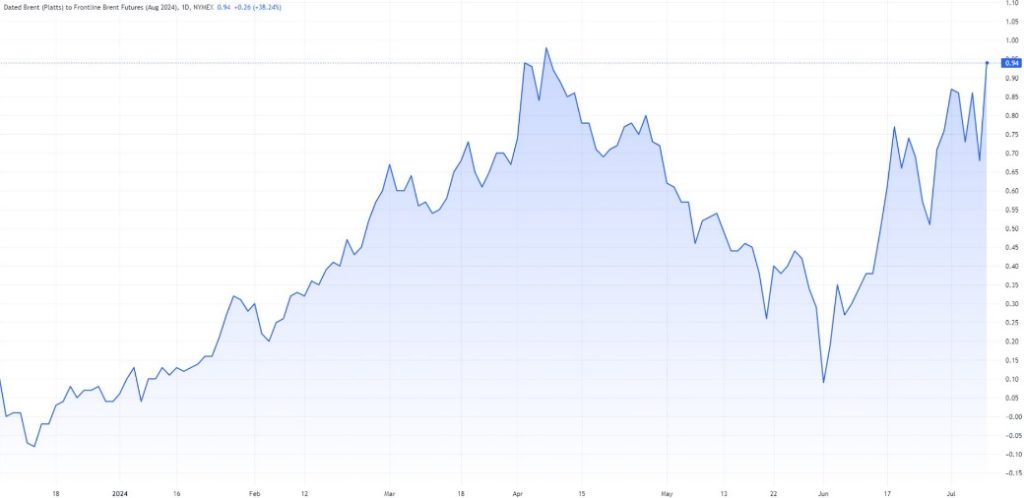
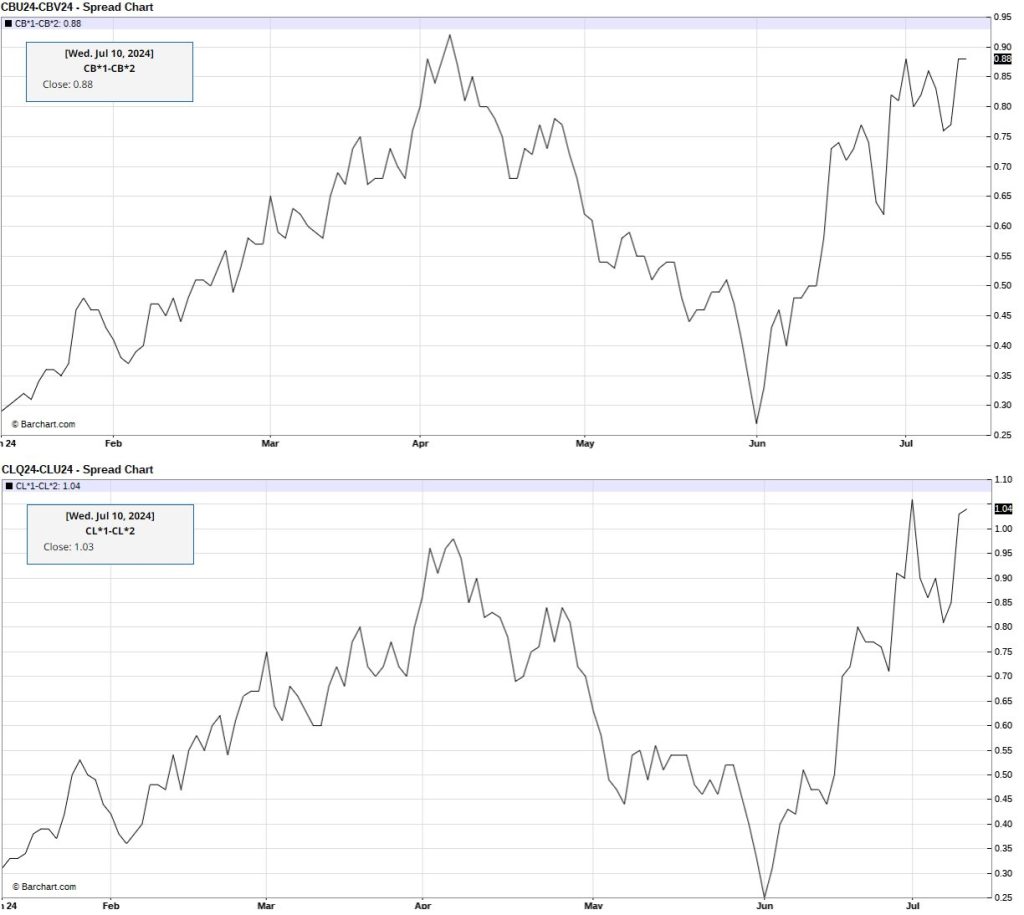
West Africa is a key swing location for volumes and now Angola is struggling to clear volumes: “WAF: Angola’s Sonangol was still struggling to sell two spot crude cargoes. Sonangol cut an offer for Dalia cargo to dated brent +$.15 and a Gimboa cargo to dated -$.50. There remain about 5 to 10 cargoes of August-loading crude remained unsold.”
The biggest headwinds in the near term remain builds in the U.S. and weak Chinese crude demand. The U.S. will likely see an outsized build next week because the largest exporting facility was shut down due to the Hurricane. On the Asian demand front, OPEC expected 1.3M barrels per day while IEA expected 900k barrels per day. So far, Reuters is tracks 2024 Asian imports as falling 130k barrels per day. This is going to take a MASSIVE increase across the 2nd half to close the gap even a little. “Chinese crude tanker trips have fallen to their lowest level in nearly two years, underlining concerns over demand from the world’s largest oil importer.” In China, refinery throughput is down y/y due to run cuts, and Chinese refiners have been heavy in the reselling of cargoes on the spot market. I don’t see a whole lot of improvement over the next few months given the state of the Chinese economy.
My view was that Chinese driving demand was going to “flatline” at the recent levels, which has so far been the case. I don’t see much showing a meaningful change in demand over the next few months.
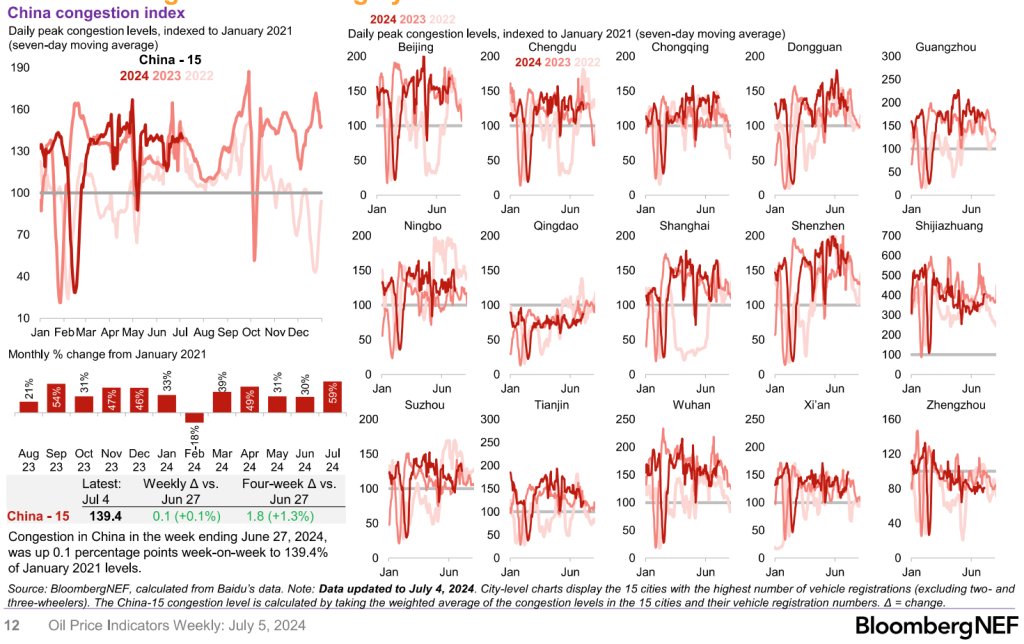
Run rates in China have been far below seasonal norms when you look at things across the last 5 years. The Shandong independent refiners have been running at near historic lows, and yet still not clearing the build up of storage in the country. This is complicated by more crack spread pressure in Asia that limits their ability to export into the Asian market. The state-owned refiners have also been reducing some of their runs by around 3%-8%, but we expect to see some larger drops over the next 6 weeks.

In the U.S., the market isn’t any better from the gasoline perspective. Here is just a sample of U.S. gasoline crack spreads versus last year:
- NY $24.48/bbl ($38.05/bbl)
- Gulf $12.93/bbl ($25.77/bbl)
- MW $14.00/bbl ($27.00/bbl)
- L.A. $18.52/bbl ($49.60/bbl
- SF $17.05/bbl ($50.02/bbl)
- PNW $15.37/bbl ($47.29/bbl)
Even at the lower prices, the arbitrage is supported to bring volume over into the U.S. The arb from USGC (US Gulf Coast) to Northwest Europe works out because of the slowdown in diesel shipments due to the hurricane. This opened up the arbitrage, but I expect to see that close quickly while the gasoline one allows more volume to flow into PADD 1.

According to GasBuddy data, week-to-date (Sun-Tue), we’re down 2.9% from last week and was about 3.2% below the four-week average. This indicates demand of around 8.68M barrels per day, which picks up the slowdown following the 4th of July holiday and Hurricane Beryl. The implied demand from the EIA came in well above this number of 9.398M barrels a day, but this is likely some carryover from the retail side, and some build up ahead of the Hurricane.

The implied demand on gasoline will still show a sharp drop next week now that many of the larger events have passed and storage has built in key areas. Gasoline will see some continued builds across the system, especially as more gasoline shows up in PADD 1. Exports were also slowed down due to the hurricane, which will drive up some of the PADD 3 data.

Distillate is the interesting one right now that has seen rising storage around the world. The U.S. is no different as we see broad builds, but some of it is overstated- specifically in PADD 3. Exports were slowed down due to the hurricane, which resulted in more products being stuck in storage. Regardless, builds of distillate are rising around the world and putting more pressure on crack spreads. As more Middle East product heads to the Atlantic Basin, there will be bigger builds as well as more crack spread pressure.

The physical side of the crude markets doesn’t support the recent bump the Brent prices approaching $87. West Africa is struggling to clear their current July exports: “Nigeria NNPC lowered the July prices for light sweet grades Qua Iboe and Bonny Light by $1.10/bl & $1.08/bl relative to dated Brent. Still 20 cargos unsold out of 45.” So far, this hasn’t been enough to entice European buyers, and it’s because there’s a sizeable amount of U.S. cargoes floating that don’t have a home at the moment. This will create some competition in the Atlantic Basin over the next 2 weeks or so. The wide Brent- Dubai EFS isn’t helping WAF differentials either. The biggest reason is the margin at the refining level- even though it may “look good on paper”- WAF light, sweet grades need additional help on the margin side. This will result in steeper price cuts in order to move July cargoes, which they will try to do before August’s slate is announced. The additional WTI cargoes heading to EU will weigh on that considerably.
The pressure on physical crude into the Asian markets resulted in a fairly sizeable cut in Saudi OSPs. Based on softening in WAF differentials and Brent-Dubai EFS, Saudi was bound to get more aggressive into Asia. There’s no need for them to cut prices into Europe and the U.S. because the competition for barrels is already fierce. This usually results in an increase in differentials to Europe and U.S. with a cut into Asia to shift the flow of barrels. “Saudi Arabia set its flagship Arab Light crude oil official selling price (OSP) to Asia at plus $2.40 versus Oman/Dubai average for July, a document seen by Reuters showed on Wednesday. That marks a 50 cent per barrel cut from the June OSP, the first cut in five months and towards the lower end of market expectations according to a Reuters survey. Its OSPs for other crude grades sold to Asian customers were slashed by 40-60 cents, the document showed.”[1] I think this commentary covers what is actually happening in the broader market. “Refining sources expected state oil giant Saudi Aramco (2222.SE), opens new tab to cut its prices in Asia because of falling Middle East crude benchmarks and weaker profit margins for Asian refiners. The potential price reduction for Asia, which accounts for 82% of Saudi Arabia’s oil exports, underscores the pressure faced by producers in the Organization of the Petroleum Exporting Countries (OPEC), amid robust non-OPEC supply growth and a global economy facing headwinds.”
Refining margins bounced a touch off the lows in Asia, but have been stuck around $17. This is no where near high enough to bring back some economic run cuts, and we already saw weakness slipping back into the crack spread. Saudi’s actions will likely support current volumes and provide some support for refiners on the margin side. None of this will be enough to increase volumes- rather just keep things at the current status quo.
Here is another data point on the physical market: While other North Sea differentials are firm, the WTI Midland has been falling for the past 3 sessions. Angola’s august loadings have improved a bit with around half sold, but additional Nigerian price cuts could way on the speed of Angola’s remaining cargoes.
Another point about weak demand is on the prompt European gasoline: “Prompt European gasoline in a contango structure *in July* – first time at this point of the year that prompt values are at a discount to forward prices since the continent was locked down in 2020.” I’ve spoken repeatedly about the softness in Europe, but this is even worse than I was expecting: “It is uncommon for the forward structure to be in contango at this time of year. In the corresponding session last year the July swap was at a $19/t premium to the August swap, and since 2009 the current scenario has occurred only twice — in 2020 when much of Europe was under Covid-19 lockdown measures, and in 2016 when the front of the curve was pressured by high European inventories and high US supply. The contango structure reached $5.50/t on both occasions. The recent move builds on weakness exhibited last month, when the front of the forward curve between June and July moved into contango, a structure which was maintained through the rest of June. Demand for gasoline has failed to meet traders’ expectations this European summer. Stock levels have been robust, particularly in the US where high refinery utilization rates have boosted supply and stifled the requirement for European product. This was shown in gasoline crack spreads to North Sea Dated crude in June, which moved sharply lower — counter-seasonally — to an average of $14.87/bl, $5.83/bl lower than in May and down by $9.68/bl compared with year ago.”[2]
This build up in Europe is even worse because the 10 or so cargoes of WTI floating to Europe without an end buyer are very gasoline heavy. Who is going to what gasoline rich crudes unless it’s at a steep discount? Gasoil is also going to come under additional pressure as 4 VLCCs ladened with product leave from the Middle East destined for Europe. We’ve been talking about ME refined product avoiding Asia and shifting over into the European markets.
The additional WTI crude shipments, weak gasoline structure, and elevated gasoil imports will result in a lot of products being left in U.S. tanks. We expect to see net unseasonal builds in the U.S.- specifically in PADD3. “These Crude light sweet barrels (gasoline rich yields) are staying in the Atlantic. On the gasoline side, Nigeria and LatAm are tapped out, which causes the U.S. to become a dumping ground and back-up of exports into storage.
Here’s the image of VLCC flows: There are 4 VLCCs bound for Europe with diesel in an unprecedented move to capture high LR2 freight rates, which totals 7 million barrels arriving at the end of July or early Aug depending on sailing time.

When we look at imports, we can see Asia at being fairly flat while the EU weakened. There should be some recovery in European flow based on refiners ramping, but the volume adjustment has so far been muted against seasonal norms. Based on the shifts in crack spreads, we don’t see any real reason to see a bigger increase in runs.

We discussed the likelihood of crack spreads finding a bottom, but it took much longer than I initially expected. There has been some recovery, but it’s moved back to the ceiling I thought likely. I don’t see a continued appreciation over the next few weeks given the way contango forming in the market for products.
- NWE diesel barge refining margins rose by $2.45 a barrel on the day to $21.32 a barrel on Monday.
- The shift higher in diesel cracks almost instantly brought 4 VLCCs from the ME, which comes back to our original thesis. Any shortfalls will quickly be filled because there is a significant amount of product floating around the world. The ME will continue to be the swing shipper as Asian demand struggles.
- Singapore gasoil margins closed the trading session at slightly above $17 a barrel on Monday.
- Any shift in the Asian markets higher will quickly be filled by Chinese refiners/exports or small bumps in refiners in the region. Many already rolled out run cuts so it could just move them back to seasonal norms.
- There is a bigger focus on protecting margins, so it’s very unlikely to see a big increase in output.
On a final international note, Saudi Arabia announced the discovery of seven additional oil and gas fields. Saudi Arabia’s energy minister announced on Monday the discovery of seven oil and gas deposits in the kingdom’s Eastern Province and Empty Quarter, the official Saudi news agency SPA reported. Saudi Energy Minister Prince Abdulaziz bin Salman said state oil group Saudi Aramco had discovered “two unconventional oil fields, a reservoir of light Arabian oil, two natural gas fields, and two natural gas reservoirs”, SPA said.” I’ve been saying for years that we are far away from ever hitting a supply crunch, and as technology improves- we will see recovery rates rise. Oil and gas is here to stay- so buckle up!
The below gives you an idea of how the market looked heading into the July 4th holiday. Gasoline prices have reverted back to year ago levels as prices keep creeping higher. We believe that pricing will start to move back down, but it will take the next few weeks to see this reduction.
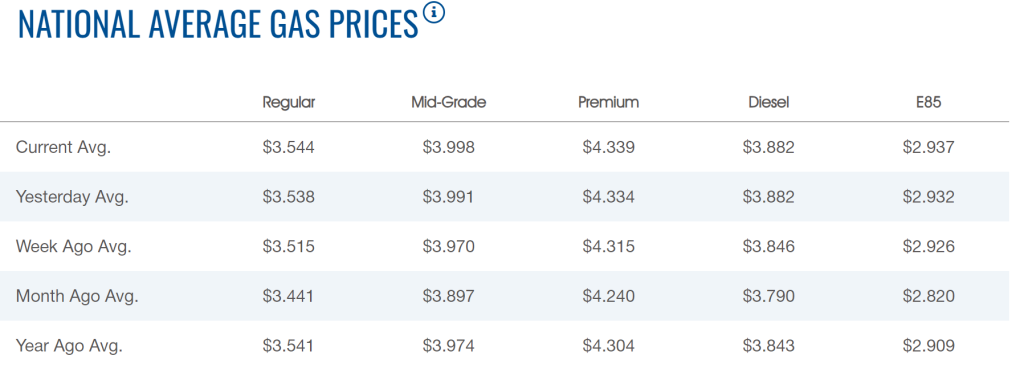
Historically, July 4th-Aug 15th generates the most active in the U.S. with vacations and general travel. The July 4th start has been spread across two weekends this year as it falls on a Thursday. I think the recent GasBuddy data does a good job of showing the increase in activity starting: “According to GasBuddy data, weekly (Sun-Sat) US gasoline demand fell 0.9% from the prior week and was 0.2% below the four-week moving average. Friday and Saturday saved the week from being even worse with WoW increases of 2.1% and 4.3%, respectively.” It also highlights how activity has been sluggish in comparison to other years, which I think weighs on total gasoline demand.
When we look at the last EIA reported (June 21st), we can see a drop back below 9M barrels a day. This isn’t a normal drop because at this point we are averaging about 9.2M-9.3M barrels a day. We expect to see the running 4-week rolling average struggling to break, let alone maintain, a level above 9M barrels a day.

The limitations only get worse when we factor in price increases for gasoline. Prices at the pump have been gradually moving higher, and as the futures front month shifts up- we are seeing that passed through the system. We will likely trend back to year ago levels, and shift above them over the next 2-3 weeks. “The move came as the cost of oil crossed the $80 per barrel mark, putting upward pressure on pump prices. With oil costs accounting for about 54% of what you pay at the pump, more expensive oil usually leads to more expensive gas.”
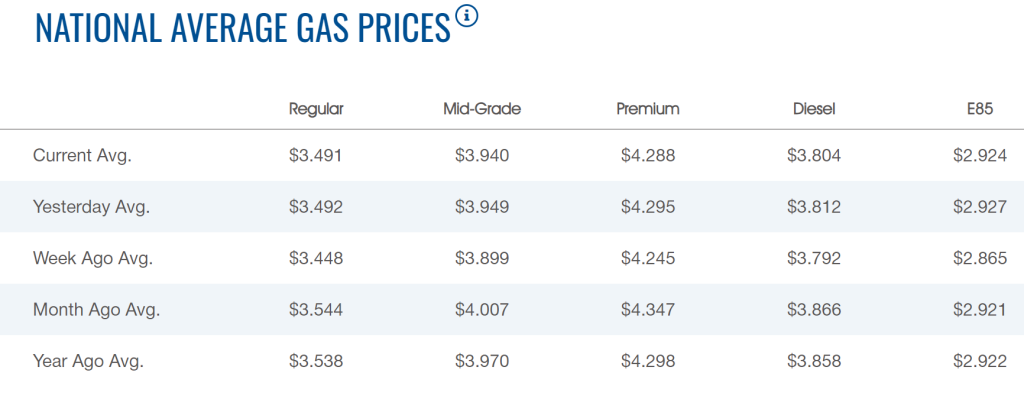
There was a bih expectation of a record number of travelers this year, which will likely be accurate. The biggest issue will be “distance traveled” and the method of travel. There has been a shift travel times because people are staying “more local” without going on extended vacations. This has limited how much gasoline is burned as well as money spent at the various locations. It follows other trends we’ve seen in past recessions or economic slowdowns.
Overall, the gasoline market is in a difficult position as consumer demand weakens and huge amounts of volume float around the world. The imports into PADD 1 (East Coast) and back-up of exports into PADD 3 (Gulf of Mexico) will be important for setting the price.
We continue to believe that exports of crude and refined products from PADD 3 will be very slow. This will result in a sizeable build up of storage, and result in some counter-seasonal builds. I believe this will change the landscape for the net draw/builds for 2024. The EIA, IEA, and OPEC assumptions believe that Q3 will show some sizeable draws helping the picture for year-end. This would require a very aggressive Q3, which isn’t what we see playing out. The larger than expected stocks at the end of 2024 could result in OPEC+ extending the voluntary cuts into Q1’25. The main agencies are already assuming net builds for 2025, and a large part of that is driven by the end of the cuts. OPEC could get a stronger start by extending the cuts through Q1, and the decision to extend will be driven based on how strong draws are in Q3’24.
Global distillate storage remains at near the highs of the last several years, and we see this pushing higher over the next several weeks.
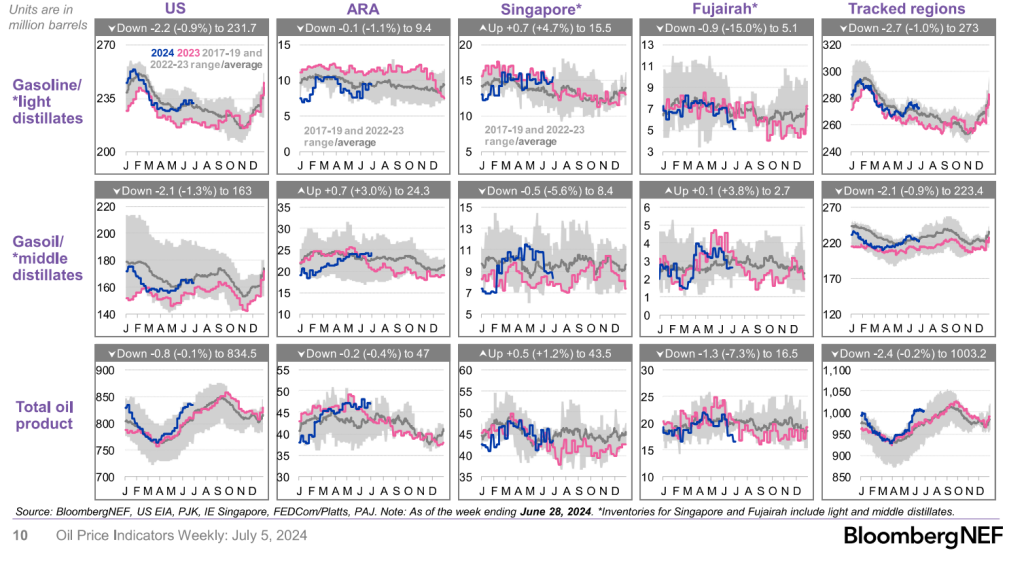
As a significant amount of oil remains “in-transit,” as it shows up at the coast, there will be a sizeable increase in floating storage. The big builds in refined products are indicative of a much bigger increase as demand struggles and refiners pull back on utilization rates.
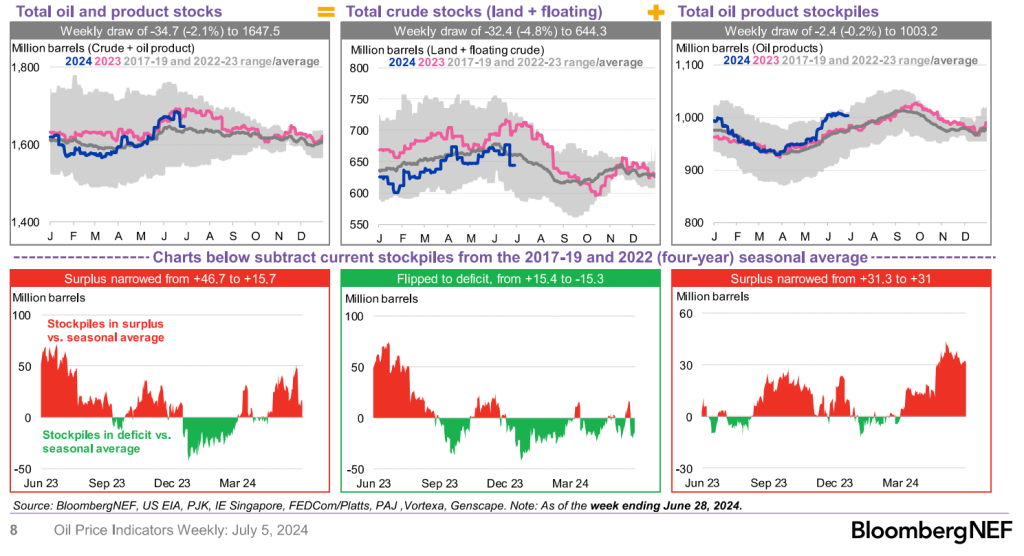
A further reduction in utilization rates will result in more pressure on storage and an increase in floating storage, Saudi’s power burn has been elevated, which has reduced their exports. This is more of a short term (seasonal shift) that happens on a yearly basis. The flows from Russia more than make up for the losses from KSA.
The economic data has been shifting all around, but the leading indicators point to another pick-up in inflation. We need to look at rates, inflation expectations, and underlying economic growth or weakness. The world is awash in debt that will cause more stress across businesses and governments. There is no way for any entity to pay off this level of principal so many firms/governments will be forced to roll the debt. As interest rates increase on the rolled debt, the need for an ever-growing bubble spirals. The beginning of the debt spiral was the Asian Currency Crisis that saw a cycle central bank intervention run crazy. World debt has now crossed $300T with little desire by any government to see it paused.

The U.S. is one of the worst culprits when it comes to frivolous spending, and there are no signs of it slowing down. The U.S. is at a point of spending $140B on interest in one month, and the level of debt issuance is only shifting higher.

There is a belief that the Fed will cut rates, but given the amount of liquidity that remains in the market AND new debt being pushed into the financial system- it’s near impossible to see a cut. The fiscal spending is directly running counter to the monetary policy that is being carried out.
You have to look no further than the 30 year US treasury auction to see cracks forming. The auction tailed by 2.2bps WI, which is the largest since 2023 despite an increase in direct bidders to a high since Dec 2014. The amount of paper coming to market is only shifting higher, and it will overwhelm whatever buyers remain in the system. The bid to cover ratio also shifted lower, and the cracks are only getting wider.
I think @altheaspinozzi does a great job of describing the issues
- Indicates duration rejection at 4.405% yield
- Shows the need to appeal to indirect bidders to fund the U.S. deficit
The problem is- “Who will be the indirect bidders?” An indirect bidder is typically a foreign entity that is buying through a dealer or broker, but the U.S. is going to struggle to keep the merry-go-round going. The market is getting saturated with U.S. TSY especially as the auctions are getting bigger to cover the rising interest expense. The mistake is to believe the Fed cutting rates will save the bond market because you need to find a clearing price for this debt. The debt spiral only continues to balloon, and QE isn’t the solution because the last thing the market needs is another shot of useless liquidity.
The market is running out of places to “hide” the debt and liquidity, and the MMT (Modern Monetary Theory) lies are being pulled front and center. The issue becomes- what can banks do about duration and credit risk. There is a significant amount of hidden contagion in the banking system as asset values diminish and maturities rapidly approach. “Smaller lenders in the US look particularly vulnerable because of their real estate exposure, and there’s already been turmoil in the sector. New York Community Bancorp had to take a capital injection of more than $1 billion earlier this year after its financial challenges mounted. More regional bank failures are likely because of their property debt, according to Pimco.”[3]
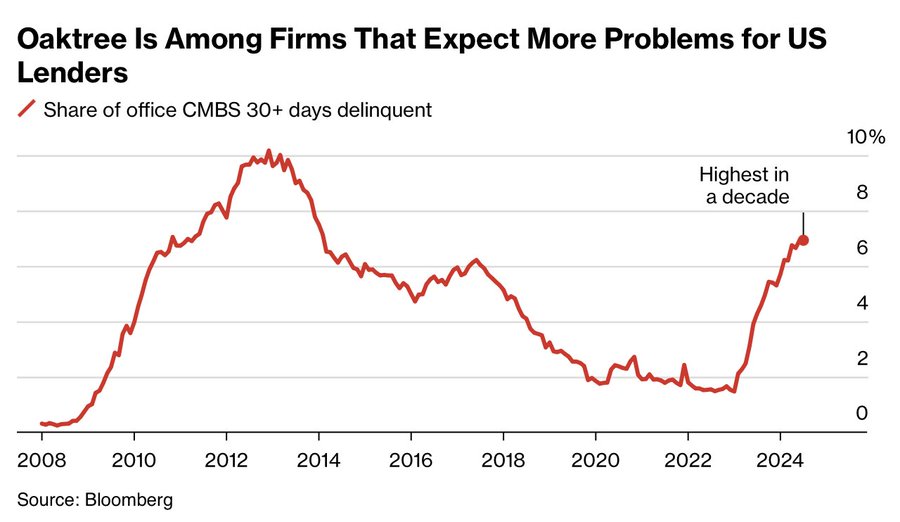
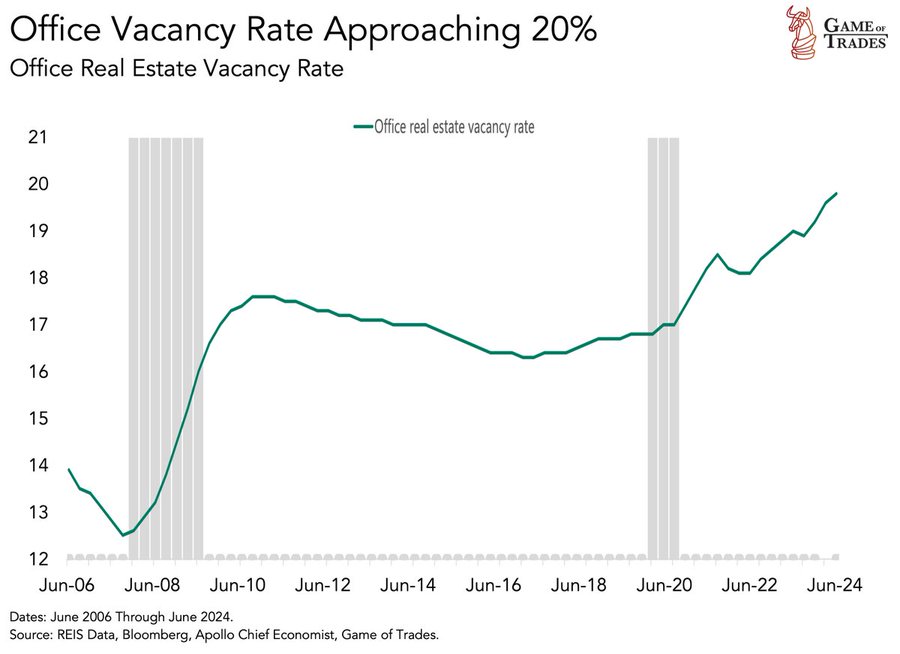
There is a belief that the CRE market is a fantastic opportunity, which could very well be true. But, how has the business office landscape changed? Will we ever revert back to a 5 day work week or will we remain at 2-3 days in the office? There will always be opportunities, but who is exposed to the depreciating asset? How much debt is levered against the asset? There is a lot of unknowns, and we aren’t even near the bottom when it comes to risk. The vacancies help to put this in perspective- especially when you look at how it NEVER returned to the pre-covid levels.
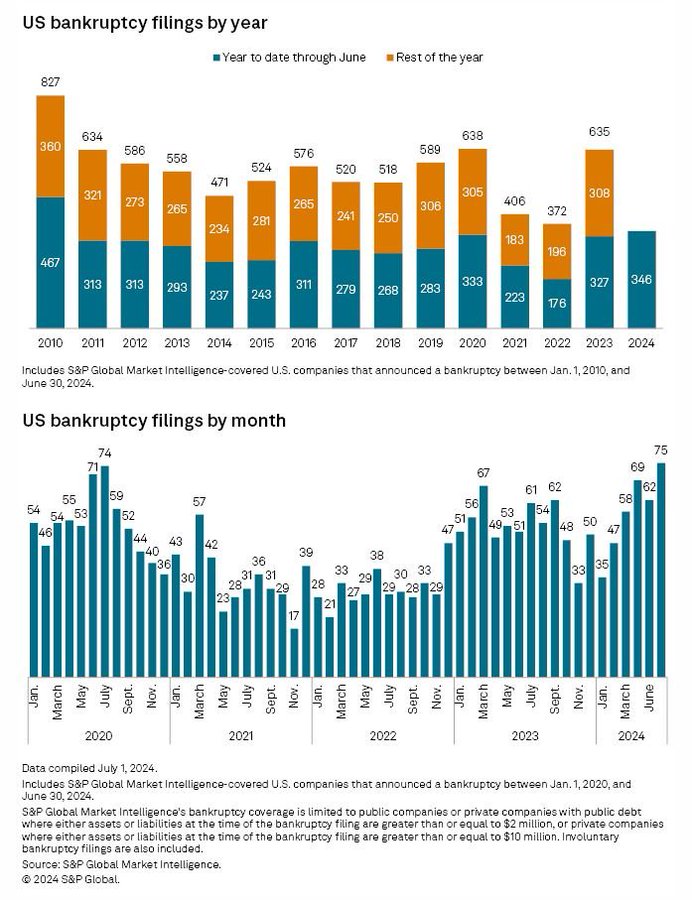
The risk expands when you weigh it against U.S. corporate bankruptcies reaching the highest levels since early 2020. When these started to soar in 2020, there was a significant amount of stimulus pumped into the system. What happens this time? The Law of Diminishing Returns comes for us all!
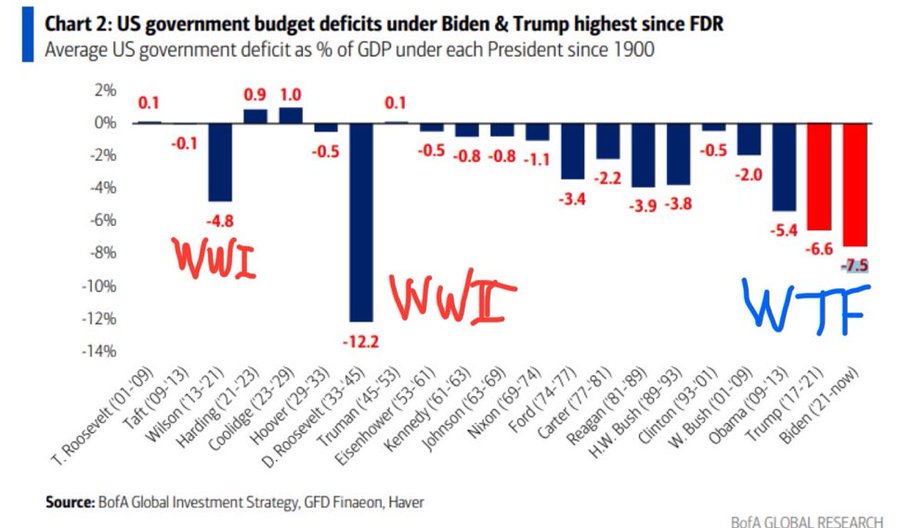
The below chart puts into perspective on the budget deficit in the U.S. Where is this capital being deployed? The government is the only entity hiring at the moment and propagating the current economic growth. We need to let the business cycle play out otherwise this will end poorly for everyone. As the deficit grows, the US Treasury will have to borrow more to cover maturities, increased interest payments, and the need for additional funding to finance the deficit.
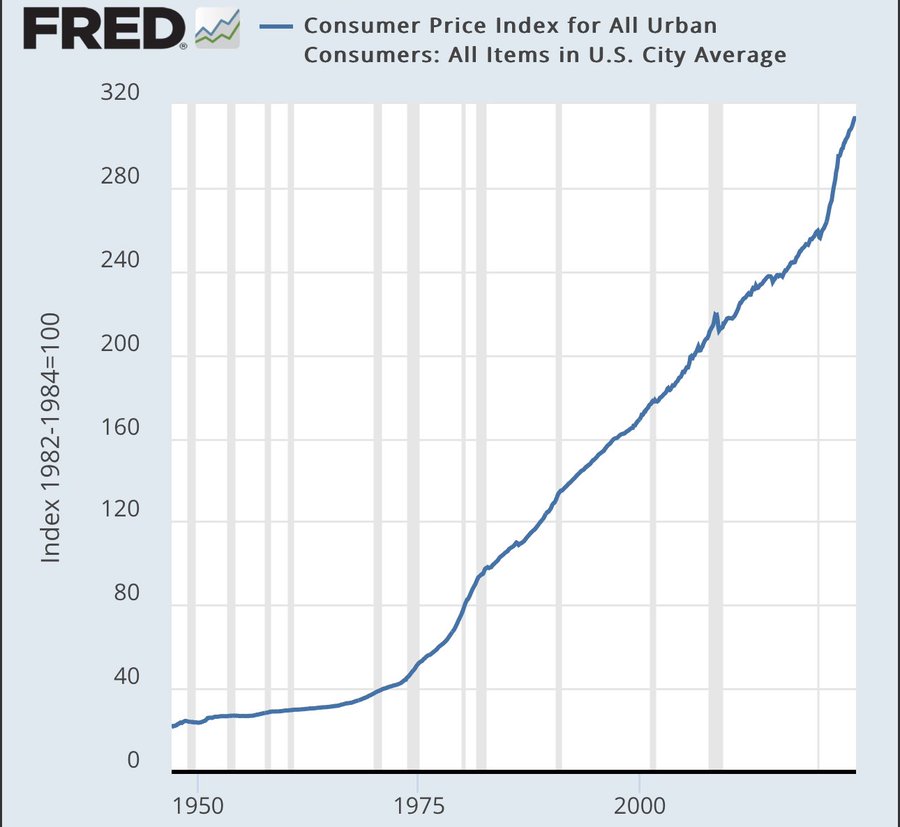
Inflation “appeared” to have fallen when you look at the CPI data, but as I’ve been saying- inflation would soften in May/June but accelerate in July/August. The biggest driver behind this view was sticky inflation and rising freight costs. Typically, freight costs lead PPI (Producer Price Index) rises by about 3 months, and PPI leads CPI by 6 weeks or so.
It’s important to level set inflation in the U.S. The below gives you an idea of the small “blip” in the CPI, which will turn higher once again for several reasons.
The biggest one is the disconnect between sticky and flexible inflation. “Still a huge gap between sticky (blue) and flexible (orange) CPI components in June per AtlantaFed… latter moved back into negative territory.”
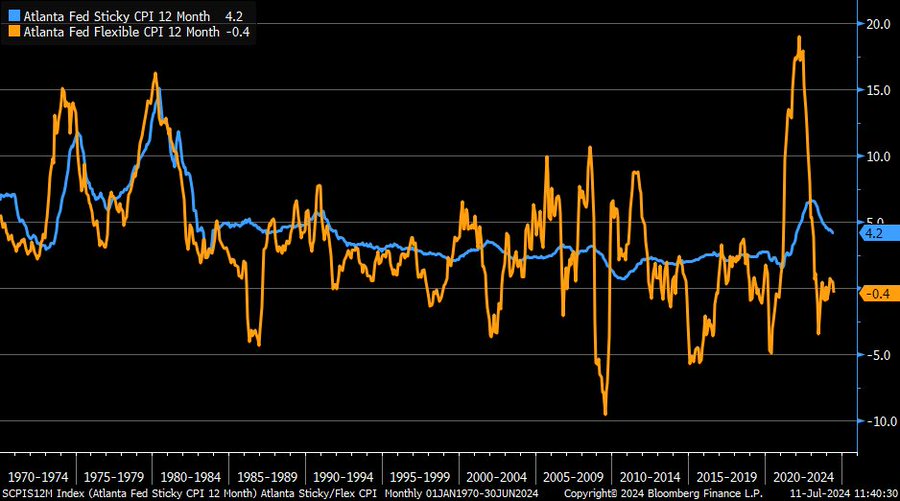
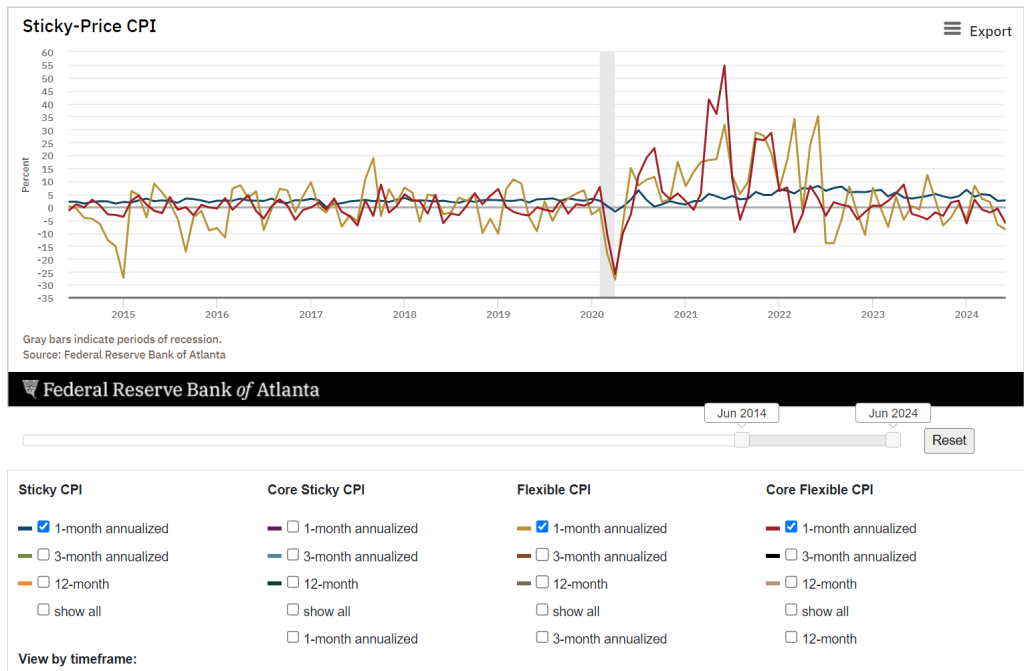
Sticky inflation remains well above on a year over year level, but when we look at it on a month over month level- it’s actually shifted back up. Core Sticky and “headline” sticky moved higher as you can see below with the drop in CPI being driven by flexible factors.
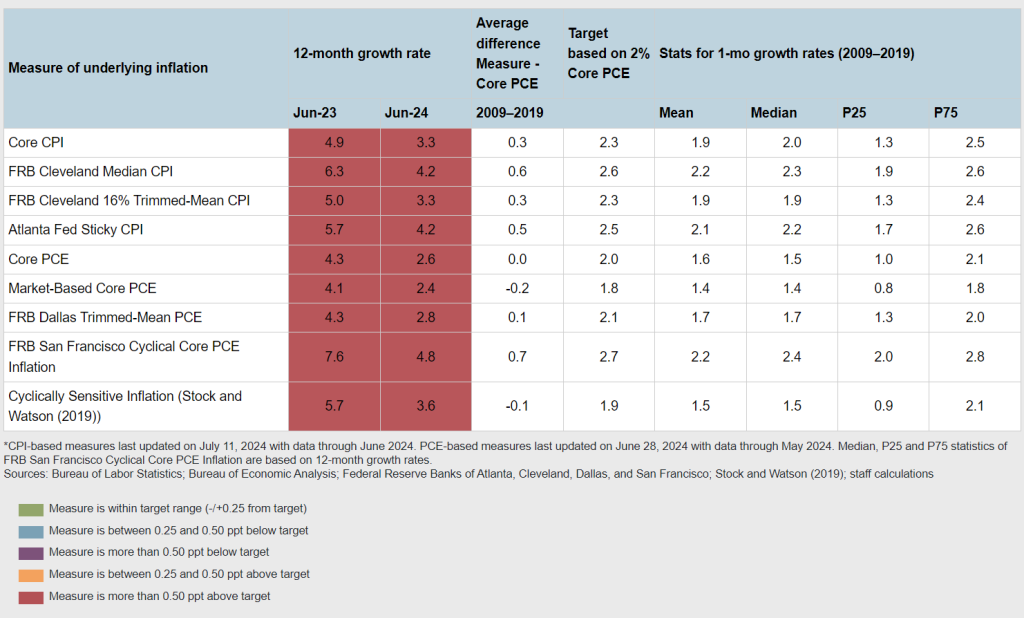
When we look at the broader indicators, inflation is still running well above the targets dictated by the Fed.
We expect to see inflation move back up as we start picking through the leading indicators.
- Freight rates have continued to move higher.
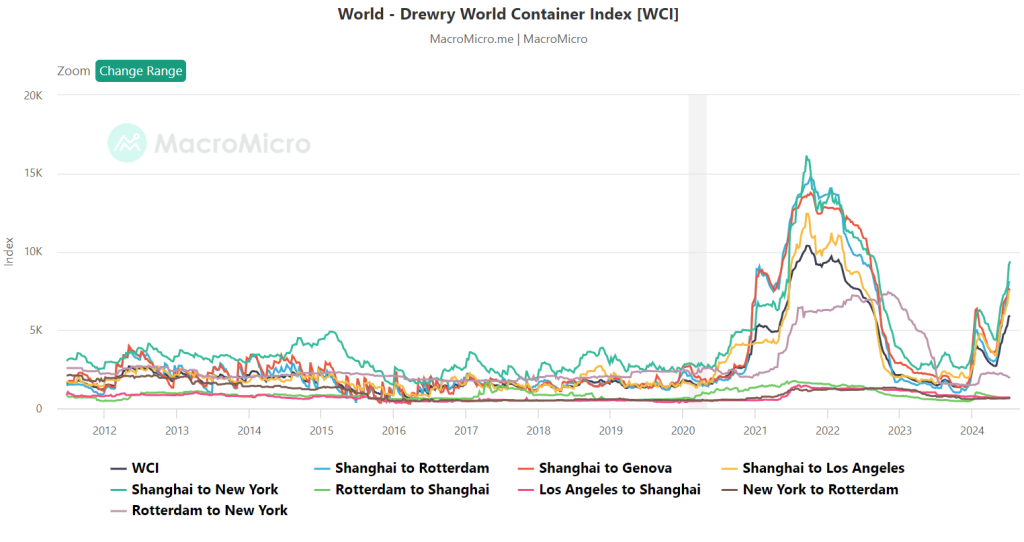
The shift is well above the normal levels we’ve seen over the last 10 years, and it will be an inflationary driver. Typically, we start to see the rates soften in July, but the increases from end of April thru June will begin showing up in the data. The below charts show some slow down in the pace of increases, but it’s still going to be inflationary through Sept.


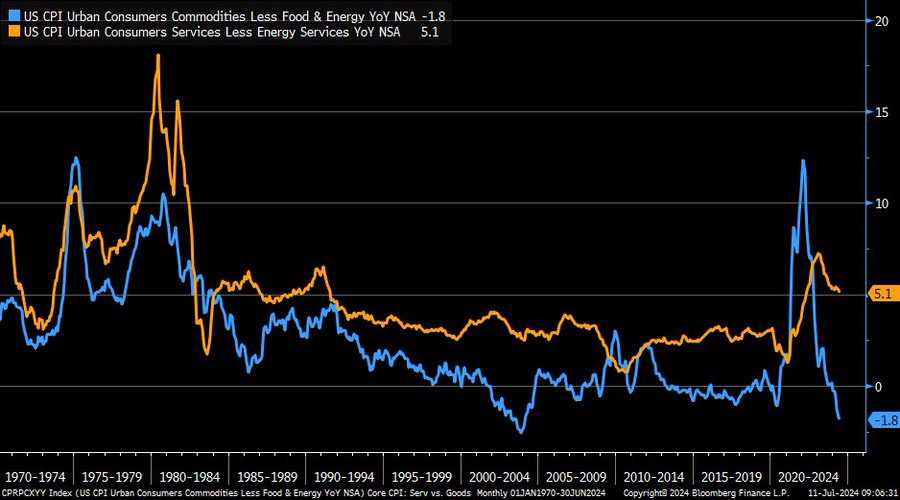
The goods side of inflation still remains the biggest disinflationary component, but with an economy 74% services- the bigger issue is on where sticky inflation is heading. Core goods (blue) still deep in deflation territory while core services inflation (orange) is still elevated … latter resumed its move lower in June.
The leading indicator into this world is PPI, which not only shifted higher, but actually had a big revision month over month. “In month/month terms, June PPI #inflation +0.2% vs. +0.1% est. & 0% prior (rev up from -0.2%) … core +0.4% vs. +0.2% est. & +0.3% prior (rev up from 0%).” PPI is showing that more cost is shifting to the producer that will have a choice- “Can I pass it down to the consumer or will I have to give up some margin?” The bigger problem is the large revision higher because the June number is based on the revised number. This means the size of the spike is actually much larger over the time period than anyone expected, and the estimates are way off.
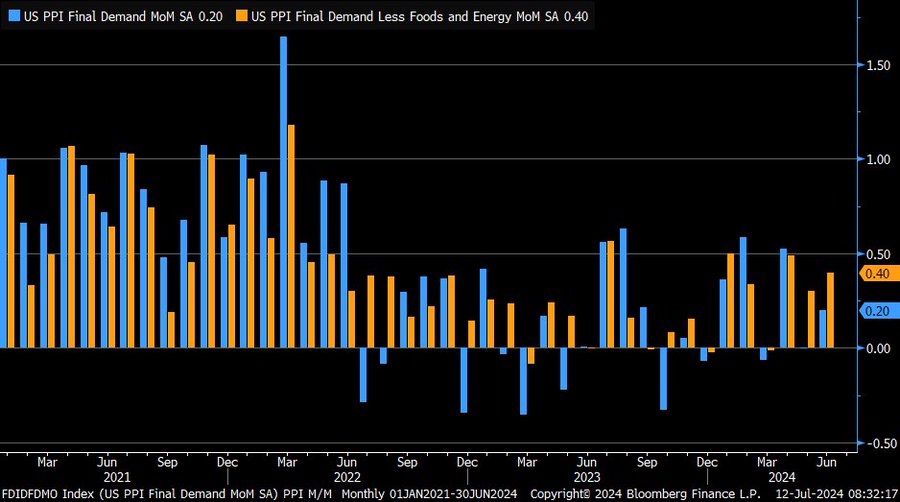
The freight costs were very impactful into these costs that are just starting to show up because it takes time to move through the system.
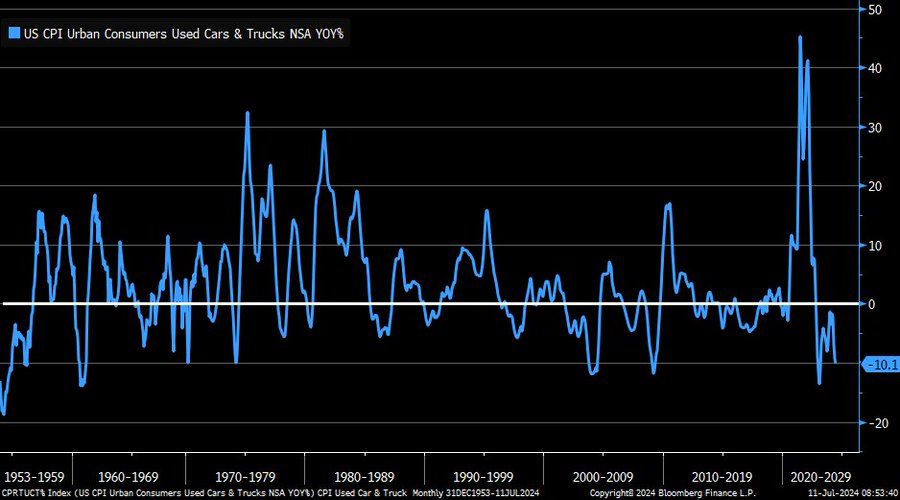
The CPI data can also experience large swings driven by used cars that have been very volatile. “Still #deflation for used cars and trucks component in CPI … -10.1% year/year vs. -9.3% prior”
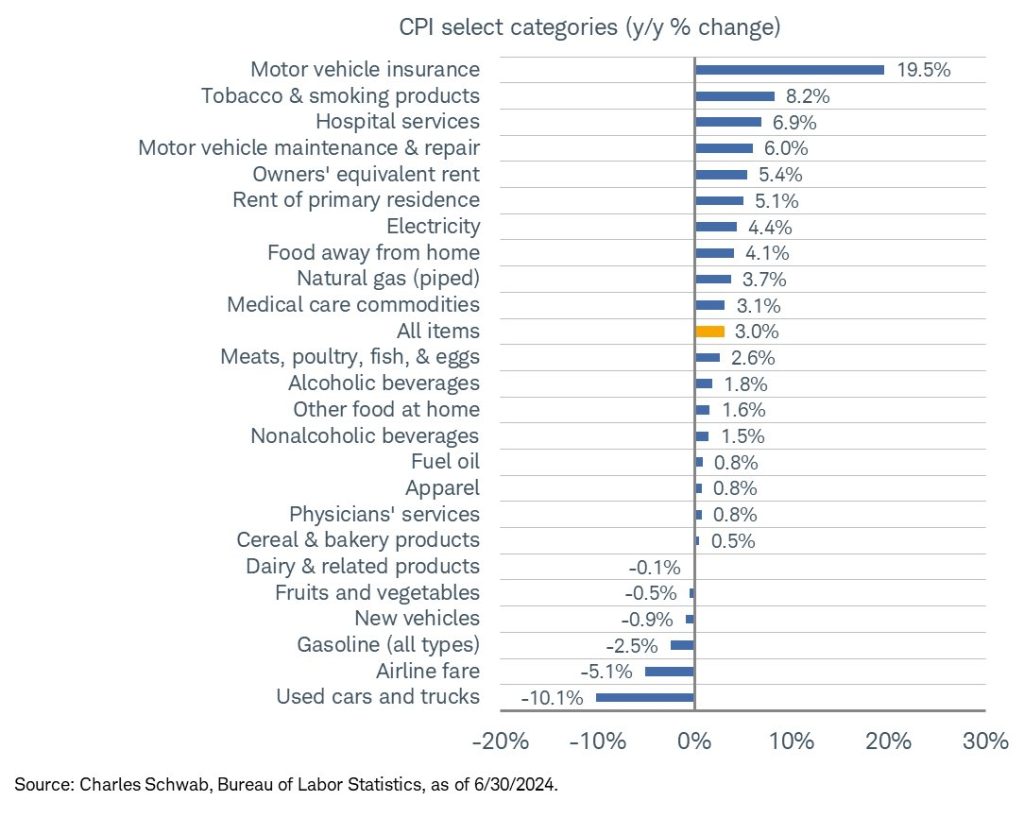
Based on what we are seeing, the car industry will remain deflationary, but on the opposite side- we will see continue to see insurance shifting higher as costs of repair stay strong. The below chart gives you an idea of what is driving inflation and deflation- as someone with three children- I can tell you that used cars/trucks and airline fair have WAYYYY less to do with my costs versus electricity and food. Gasoline has also flipped to “positive” when you look versus last year, which will make that flip back to positive (so far) in July.
Small businesses are still the cornerstone of activity in the U.S., and they continue to see higher prices. Sales still haven’t been meaningfully impacted, which highlights that more pricing will be pushed through the system.

There is also a plan for increasing salaries- none of this is deflationary. “Quite a jump of late for small businesses’ plans to raise compensation … June marked largest monthly increase since last November.”

We are seeing some pressure in the ISM data as services fell into contraction. “Very weak: June ISM Services down to 48.8 vs. 52.7 est. & 53.8 prior; new orders down to 47.3 vs. 47.1 prior; prices paid down to 56.3; business activity down to 49.6 … employment down to 46.1.” While prices paid fell- it was still in expansion, and based on the above data- we expect it to stay above 55.

The pace of expansion has slowed, but we see this turning back up based on the indicators above.

The consumer remains under pressure, which is clearly seen in the homebuyer affordability fixed mortgage index.

Hourly earnings are weakening, which is becoming a bigger pressure point as excess savings are “officially gone” and credit card rates stay at record levels.

This is some of the largest reasons that more people feel “worse off” than last year.

Slightest downtick in consumer credit card rates in May (first since late 2021), but they’re still incredibly high relative to history.

We still see an increase in underlying inflation with more pressure on the consumer forming this year.
I will be doing another report next week with a focus on Asia- primarily China- when we look at trade, policy, and economic backdrops.
- https://www.reuters.com/business/energy/saudi-arabia-cuts-july-arab-light-crude-oil-osp-asia-2024-06-06/
- https://www.argusmedia.com/en/news-and-insights/latest-market-news/2583662-prompt-european-gasoline-forward-curve-in-contango
- https://www.bloomberg.com/news/articles/2024-07-10/us-commercial-property-crash-is-set-to-deepen-the-pain-elsewhere?sref=9yOLp5hz

