The crude markets have been battling back and forth across demand destruction. OPEC+ cuts, supply disruptions, and geo-political tension. We believe they brent will stay in the $73-$77 range throughout September, and we don’t see much upside as we progress through the rest of this year. The supply side will keep brent prices from spiraling lower while demand weakness keeps the upside capped. As we progress through 2024 and into 2025, we believe that there are greater downside risks as recessionary pressures mount. The market is pricing in a 25bps rate cut from the Fed with some expectations putting it as high as 50bps. In my opinion, the Fed shouldn’t cut this year, but the market has priced in three 25bps over the rest of 2024.
In terms of demand, Sinochem just had two of their refiners declare bankruptcy today. “The creditors of Zhenghe Group Co. and Shandong Huaxing Petrochemical Group Co., both based in the eastern province of Shandong, failed to agree on restructuring plans for the indebted plants and the businesses were declared bankrupt, according to separate statements from a local court.”[1] Demand has been a huge issue around the world, but China has been a source of some of the biggest slowdowns this year Refiners in the country have been operating at some of the lowest seasonal adjusts rates in years, and it’s unlikely to change in the near term. The last hope was for a sizeable increase in export quotas- but things were kept similar to last year.

“China has released new oil export quotas for the rest of 2024, comprising 8 million metric tons of clean refined fuel and 1 million tons of marine fuel, two Chinese commodities consultancies and several trade sources said on Friday. The latest and likely the final batch for 2024 brings the total export allowance so far this year to 54 million tons, including 45 million tons released under the first two allotments, steady from last year’s total amount at 53.99 million tons.”
We expected to see an increase in export quotas as we headed into the end of the year, instead we saw things held similar to last year. “However, the new allowance volumes for this third batch were lower compared with last year’s third batch of 15 million tons, comprised of 12 million tons for light transportation fuels and 3 million tons for marine bunker.”[2] At least there was another round of exports, but it still falls short from what I was expecting. These levels of exports should support internal runs at current levels, but unless you get a big increase on internal demand- it’s unlikely to see a big increase in runs.
Here is the expected allowance for the different entities: “For refined fuels such as gasoline, diesel and jet fuel, state-owned oil majors such as Sinopec, CNPC and CNOOC were given 6.38 million tons of export allowances, or around 80% of the total volumes, according to one of the consultancies JLC. The rest were awarded to Sinochem at 790,000 tons, private refiner Rongsheng Petrochemical Corp at 730,000 tons and China North Industries Group Corp (Norinco) at 100,000 tons.”[3] There continues to be pressure across private and state-owned refiners in China, and we expect to see at least one more bankruptcy this year. Run rates will still be under pressure, and it’s unlikely to see a sizeable change through 2024.
There is the potential for another bankruptcy in the near term: “Another Sinochem teapot, Shandong Changyi Petrochemical Co., was scheduled to host a meeting with creditors in late September, according to a separate statement. The three plants, formed to process crude from a local field in the last century, have a combined nameplate processing capacity of more than 300,000 barrels a day, although most of their units have been idled for months.” While there’s been oil supply kept off the market, there has also been a broad slowdown in refined product demand. We’ve been highlighting these headwinds consistently, and pointing a big spotlight on the problems this means for the broader economy.
Bloomberg put out an article that shares a similar view to us regarding the “cautious” final batch of export quotas: “China issued the third and what’s likely to be the final batch of fuel export quota for this year, keeping the level very similar to 2023 in a sign it doesn’t want to encourage refiners to boost activity. Seven refiners and traders received permission to export 8 million tons of gasoline, diesel and jet fuel in the tranche, according to industry consultant JLC and Mysteel OilChem. That takes the total issuance for the year to 41 million tons, compared with 40 million tons in 2023. The batch will likely be the last for the year, according to JLC.” It will continue to be a rough road for internal refiners.
On the refining front, distillate storage when from one of the lowest levels in the last 30 years to either “normal” levels as measured by the 5-year average or the highest it’s been in 20 years. The flip from tank bottoms to tank tops in under a year points to the lack of demand in the broader market across the industrial and consumer levels. Gasoline has also seen a sizeable shift in product storage as demand slowed on a broad scale.
While demand will be a problem, you can’t get too bearish in this market given the cap on supply and buyers looking for deals. Imports have experienced a nice bounce so far in September, and we see this being fairly steady throughout the rest of the month and into next October. Typically, there’s a pick-up in imports as we progress through the fall months as refiners prepare for winter demand.

The physical market has found some support with prices stabilizing a bit and prices catching a bit of a bid. We don’t expect this to have a big spike, but it at least shows a slowdown in the selling pressure. There has been an uptick in cargoes being bought, which will help keep us in the $73-$77 Brent range.
Libya has seen exports remain under pressure, and we don’t see that changing in September. There have been some frameworks agreed upon, but nothing concrete has been finalized. It’s likely to see production normalize and exports rise by the end of Oct, but I wouldn’t expect much over the next 4 weeks. I was excepting a drop to about 300k barrels a day, which is the quantity produced and exported offshore. “Exports have fallen drastically from pre-blockade levels but the country has still exported five crude cargoes totalling about 3mn bl since the beginning of September and is preparing to load more in the coming days, according to a shipping source and tracking data. Libya’s eastern-based administration ordered the oil blockade on 26 August in response to an attempt by its rival administration in the west to replace the central bank governor. The blockade has pushed Libya’s crude production from around 1mn b/d to as low as 300,000 B/d, Argus estimates. The shutdown order was meant to halt operations at Libya’s eastern oil terminals — Es Sider, Ras Lanuf, Zueitina, Marsa el Brega and Marsa el Hariga — but all of Libya’s exports so far this month have loaded from one of these ports. Libya typically exports 1mn b/d of crude. The average this month is about 300,000 b/d. That some oil continues to trickle through represents a change from past blockades, when eastern export terminals were completely shut and crude production fell close to zero.”[4] We will see this quantity maintained through the remainder of the September and most of October.
Saudi Arabia is starting to increase their exports, which is normal this time of year as summer burn ends. We discussed how demand was lacking for KSA blends driven by elevated OSPs versus the rest of the market. As KSA has reduced several OSP cuts, it has pulled more of their crude into the market, which should remain stable through next month.
“According to Kpler, Saudi crude exports are likely to rebound slightly to ~6mb/d due to seasonal declines in domestic burning demand and maintenance at some refineries(3m avg ~5.5mb/d). After exceptionally weak lifting demand to Aramco over the summer months nominations of Chinese term holders have been continuously increasing. After the reported total of 43mb in September, October nominations have seemingly edged even higher to 46mb, just a tad below 1.5mb/d. Constructive OSP pricing has played a key role in reviving strong buying interest for Saudi barrels as spot-traded grades have by now become more expensive than their formula price-based peers. The premium of spot Upper Zakum continues to hover around $2/bbl, with Qatar Energy’s monthly Al Shaheen tender expected to come in at equivalent levels.”
The physical market has continued to trend higher throughout this week, and will be stable as it drifts higher over the next few days.
- North Sea: Mitsui bid Forties for Oct 4-13 at Dated Brent plus $1.55, up from a bid on Monday.
- PetroChina bid WTI Midland for Oct 7-11 at Dated Brent plus $1.68 FOB.
- Gunvor bought Ekofisk from BP Oct 11-13 at Dated Brent plus $2.20, down from Monday’s indications. Allowing for the Platts quality premiums for October, the deal works out as equal to Dated Brent plus $1.23 for Dated Brent purposes.
- Ekofisk becomes the cheapest grade underpinning the benchmark.
- North Sea: Mitsui bid Forties for Oct 4-13 at Dated Brent plus $1.50 and BP offered Forties for Oct 16-18 at Dated Brent plus $1.15.
- The average value of $1.33 is up from Friday’s value of dated Brent plus $1.20. Shell offered Ekofisk for Oct 2-4 at Dated Brent plus $2.45, the same as an offer on Friday, and Gunvor bid Ekofisk for Sept 28-30 at Dated Brent plus $2.65.
- That boosted the value of Ekofisk to Dated Brent plus $2.55 on average. Allowing for the Platts quality premiums for October and September, the indications work out as equal to Dated Brent plus $1.42 for Dated Brent purposes.
- Petroineos bid WTI Midland for Oct 4-8 at Dated Brent plus $1.43 on a FOB basis.
The refining side of the equation is lackluster with more pressure as cracks stayed weak. Europe has weakened the most over the last few weeks, but there is more downside coming in the U.S. Asia stabilized at the moment, but we expect to see more Chinese exports shifting into the market. This will send cracks lower and displace more Middle East product into the Atlantic Basin.
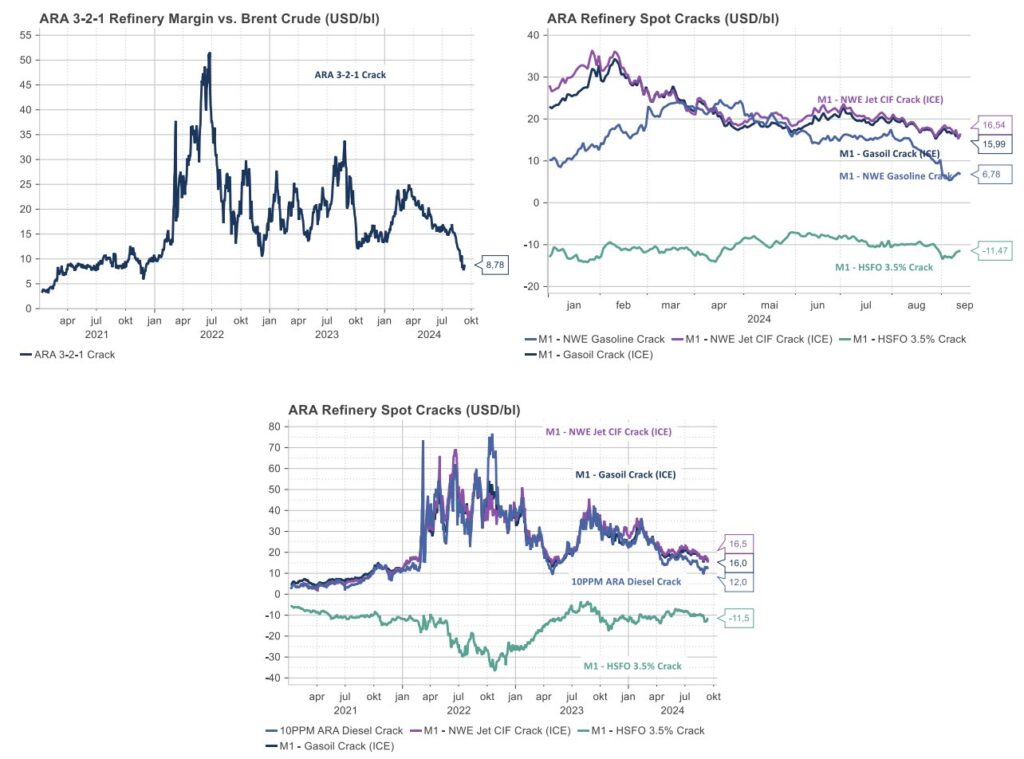
We’re heading into fall turnaround, and it will likely start “sooner” for some as they use this as an excuse to cut runs a bit early. China has already been operating at seasonally historic lows, and following two bankruptcies with a likely third- run rates aren’t rising any time soon. China has begun buying some additional capacity for the SPR, and the U.S.
The U.S. has seen a steady climb in gasoline and distillate storage, which is going to put some additional on crack spreads. Gasoline demand will weaken further after this latest spike, which we discussed last time following Labor Day. We are now into winter grade gasoline, so blending facilities are incentived to move as much summer grade into the market (or whatever is left). This adjustment happens every year/season, and we will likely see a gasoline demand number between 8.4-8.5M again next week.
Distillate saw a nice bounce, but we expect to see a drift back to the running levels of about 3.5M barrels a day due to limited demand continuing across the economy. Imports of gasoline will start to inch higher as demand in Europe stays low and storage rises further.
U.S. exports are a key spot to watch as the market for our refined products struggle. Libya disrupting the Med/European market helped pull some additional U.S. crude into the market, but this has balanced out over the last few weeks.

As U.S. exports slow, it will keep more crude and products stick in PADD 3, which will keep a cap on crude prices while pulling down crack spreads.
We expect to see some steady increases in crude storage as we progress through Oct, which is just inline with historical norms

Refinery runs will just fall further as we progress through the rest of Sept and into October.

The crude markets is facing a mix of positive and negative attributes that firmly keep things in a tight range. The WTI and Brent curves are still in backwardation with physical prices showing some sign of life. The overarching issue as we progress through the rest of this year and into 2025 will be the demand backdrop. Demand is the overarching issue that will keep us very capped on the upside and act to drag us lower if things worsen in Nov/Dec.
The Middle East was something out of a spy novel with beepers, walkie-talkies, and computers exploding over a two-day period. Israel sent a message to Hezbollah beepers on Tuesday at 3:30pm that caused their booby-trapped equipment to explode. This resulted in injuries to almost 5k individuals and over 10 deaths. This was followed closely on Wed by the detonation of explosives hidden in walkie talkies and other electronic devices used for communication. The second wave of attacks caused hundreds more injuries and several deaths. This has sent the Hezbollah into a panic throughout Lebanon and shows just how deep the Mossad have penetrated into the full supply chain of their communications and intelligence community.
Isreal has achieved a huge victory by creating chaos, distrust of equipment, and broad/targeted injuries to many Hezbollah fighters. There have been several medi-vac flights of Qud back to Iran and some of the injured are Houthis from Yemen. We will likely see Israel follow-up this attack with broad strikes against Hezbollah assets in the North in order to capitalize on the mass confusion caused by the attacks.
The attacks are a broad escalation across the board, and we will likely see some sort of counterattack. Iran never responded to the assassination in Tehran, and now there was a huge attack across their proxies. None of these events are a good thing for the Iranian regime and points to broad weakness that is only getting worse. This will cause some sort of counter- whether it’s escalation in the Red Sea or a broad attack against Israel- it’s fair to say something will happen. I just don’t think Iran is capable of a bigger response so anything that happens will be underwhelming.
The Fed officially came out with a big cut of 50bps, which is a very big start to the rate cutting cycle. Here is a great chart of what it looks like every time the Fed starts off with a .5% cut:

Last 2 times the Fed’s first cut was 50+ bps:
- Jan 3, 2001
- S&P 500 fell ~39% next 448 days
- Unemployment rose another 2.1%
- Recession
- Sep 18, 2007
- S&P 500 fell ~54% next 372 days
- Unemployment rose another 5.3%
- Recession
Powell tried to walk a line during the press conference that had a hawkish tone with dovish action. Here’s a good sample of statements:
- Fed believes that the economy is “strong overall”
- Powell said they are still going to let the balance sheet run-off
- Fed has “growing confidence” that strength in labor market can be maintained
- Consumer spending has “remained resilient”
- Inflation has eased but “remains above 2% target”
- Labor market is now less tight than before pandemic
- Fed is moving to a “neutral stance” but “not on any preset course”
- Powell said they will be open to pausing, accelerating, or raising rates. He tried to walk a more “hawkish” tone vs the dovish action.
- During remarks, Powell also said they aren’t declaring victory on inflation.
Why is a 50-bps rate cut needed if the economy is “strong?” The dot plot shows another 2 cuts this year- each being 25bps, but Powell tried to issue some damage control saying they can still pause, accelerate cuts, or reverse them.

The market has been trained to function only with rampant liquidity and ZIRP (zero interest rate policy.) This mindset has pushed everyone to demand rate cuts as the market slowed or really the trigger being labor slowing. The below chart shows the “new” market assumption for cuts, which is way more aggressive than what the Fed dot plots are suggesting.

Prediction markets don’t believe the Fed today:
- Today, the Fed said they see a total of 2 more 25 bps interest rate cuts in 2024, or 50 basis points of additional cuts.
- However, prediction markets are pricing-in a 48% chance of MORE than 2 additional cuts in 2024, according to Kalshi
- There is currently a 36% chance of 75 basis points of additional cuts and an 11% chance of 100 basis points of additional cuts.
- This means the market is pricing-in a material chance that at least 1 more 50 basis point rate cut is coming.
There has also been a pervasive view that deflation is “damaging” to the market, but when you look at asset prices- there will either be a price drop (correction) or a wage price spiral. Based on history, a price drop is much easier to control versus a wage price spiral running out of control. The market gave the chance of today’s announcement at 50% (a coin toss) between 25bps and 50bps.

The Fed set a very dangerous precedent (again) by protecting the “Fed Put” even while the S&P is at all-time highs. The important thing to watch at this point is the yield curve and gold, which should expectations of a spike in inflation. The Fed is going down the same path we saw in the late 70’s of cutting too soon. I think it’s interesting that there is such a push to cut rates when we are just back to the long running average of the 10-year treasury.
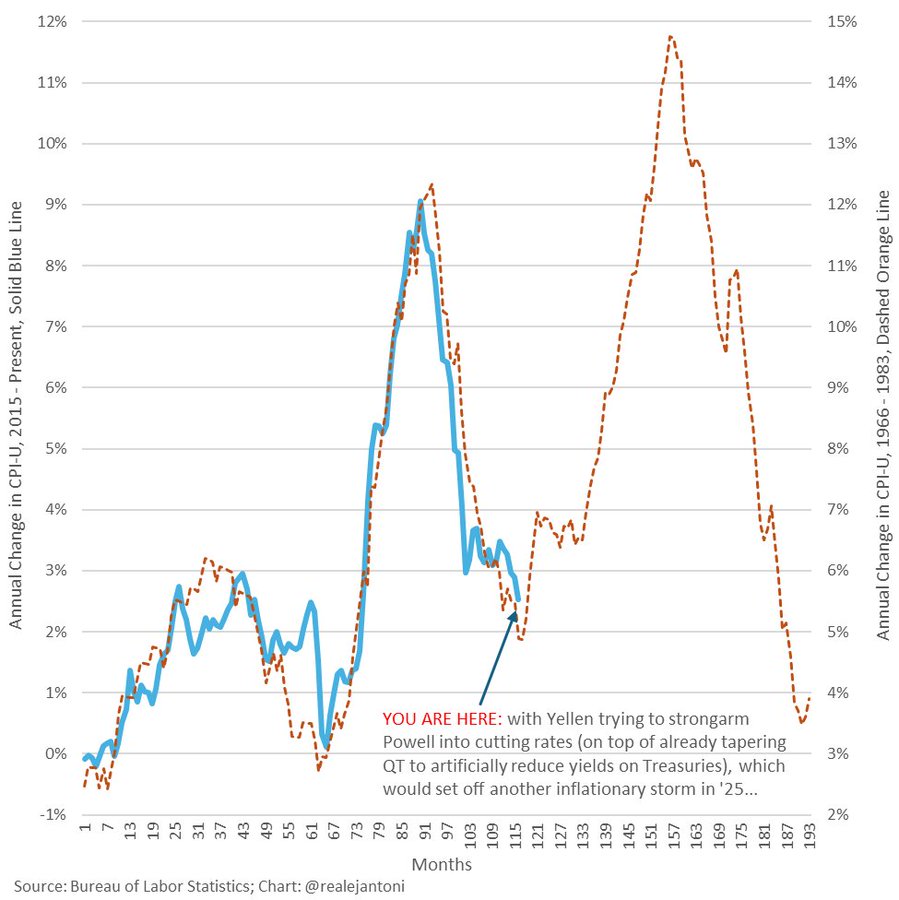
When you look over the last few rate cut cycles, this is the highest inflation has been once they start cutting. You can see that it’s even turning HIGHER, which is even more insane because this is using their flawed and manipulated data series.
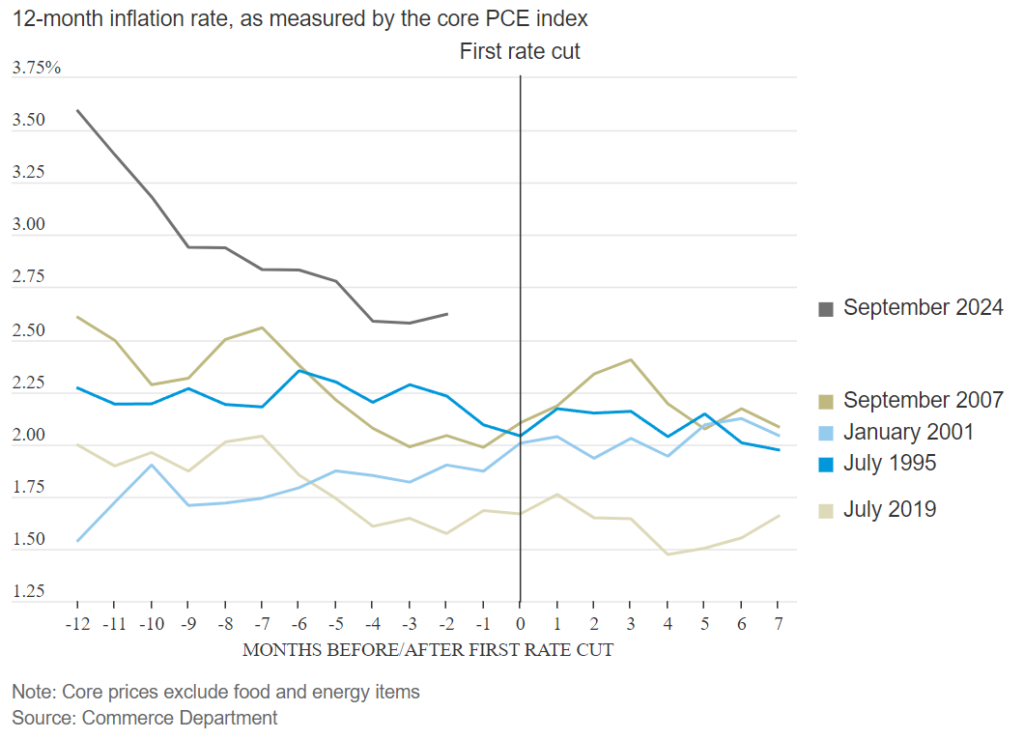
We have inflation shifting higher, fiscal spending out of control, and a 10-year yield running below the historical average. Are there some spots of slowdown- yes, but there isn’t much in the data showing we need to cut rates today.

I can’t stress this enough- the market still sets the yield curve. The supply vs demand backdrop for U.S. paper is getting MUCH worse- a rate cut doesn’t change that math. I don’t think people appreciate the impact of inflation. This is a massive drain on resources as assets are only going to be pressed higher to account for the additional liquidity. There’s a misnomer that this cut will help the U.S. spending problem by cutting interest expense. The Fed doesn’t control the yield curve (they tried w/ YCC & failed) because it’s set by the market. The US gov’t has gotten used to free money (liquidity) and U.S. TSY providing a margin of safety and setting risk free pricing, but they’ve ignored the Law of Diminishing Returns. The gov’t is still running a trillion-dollar deficit (and rising), which means Yellen (the treasury) has to issue new debt to cover spending over tax revenue + roll old debt + increase issuance to cover rising interest expense. What does this do? This INCREASES the amount of paper that the market has to absorb.
As more paper comes to market, what interest rate will the market accept or the “clearing price” of the auction. If Yellen is issuing $3B 30 Yr or $7B 30 YR, the interest rate will be very different. Bond holders want to be compensated for their risk and inflation. When you have this amount of fiscal printing, lenders will want to be compensated for the level of risk & devaluing aspect of the currency. Let’s just take one metric of debt/GDP. GDP is calculated as C+I+G+(X-M), and we’ve seen the G (government) explode higher. At the outset, it isn’t a huge problem if the money is spent on projects that generate a “positive multiplier” or generate economic growth ABOVE 1- so it covers principal & interest. The cost of generating $1 of GDP growth gets more expensive as you keep the printer running. For ex, $1 to generate $1 of GDP growth- but it’s diminishing the more you use it- $3 for $1; $18 for $1; $37 for $1 until you hit a point of negative utilization. Negative Util means that every new $1 printed generates a NEGATIVE util or creates negative growth. Essentially the debt load has eclipsed the benefits, and the interest expense is crushing GDP causing the debt/GDP ratio to BLOW OUT. Debt (numerator) has exploded higher) as GDP (denominator) shrinks causing a huge spike in the ratio. So as a bond investor- are you willing to own 30yr TSY at 3% or 5% or 8% to compensate for the risk? The view that a Fed Fund Rate Cut saves this is ignoring the basic principles of supply vs demand and how it rolls into the Law of Diminishing Returns… welcome to the second wave of inflation!
The Federal Debt is up $82B in just two days to a new record high of $35.351T, and there is no chance it slows down. The government is increasing their spending, which will only keep this accelerating. Cutting rates DOES NOT slow this down because the market still sets the yield.

While it’s easy to get bearish the dollar, we are still in the same “race to the bottom” game we’ve been in to date. The below chart puts into perspective all of the cuts that have happened around the world with the most recent being the U.S. and Indonesia.

It’s important to remember that the U.S. printed $6T and only received three years of a fake “booming” economy fueled by inflation. Now we are already in a massive recession- aka Law of Diminishing Returns. It’s interesting to see that the Taylor Rule is actually calling for an increase in the Fed Funds rate, which is driven by expectations of inflation and GDP. There are different ways to calculate the Taylor rule, but the “standard” assumptions put the rate at 5.73%- which is about 25bps ABOVE the previous rate. So now, we are 75bps away from where we should be according to the rule.

There are many ways to come up with what the Fed Funds Rate “should be”, with another one being the 2yr TSY. The bond market was essentially telling you (guessing) Powell was going to have an overreaction with a steep cut. The important point on this chart- does the 2YR predict the Fed action or does the Fed feel compelled to comply? Listening to investors at this point regarding monetary policy is like asking a heroine addict if they would like another hit.

The Fed balance sheet is still grossly outsized, which will take years to “normalize.” It also signals the sheer amount of liquidity that still exists in the market. We have a huge amount of liquidity that hasn’t even remotely been pulled out of the system.

The money supply barely feel below 0%- and if you factor in the programs run by the Fed and Money Market Accounts- it was never actually negative. Even without an adjustment to the Fed Funds, we have already moved back to money supply growth, and the actions of today mixed with fiscal spending will only send inflation higher.
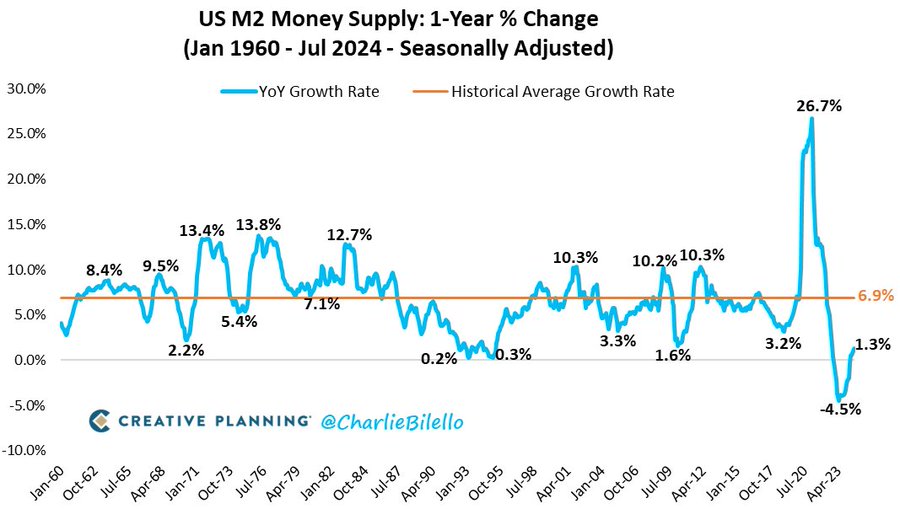
By focusing more on labor (unemployment always spike after a cut- especially on this size), the Fed is ushering in a wage price spiral by supporting asset prices. We are seeing levels stagnate while costs continue to rise across the board.
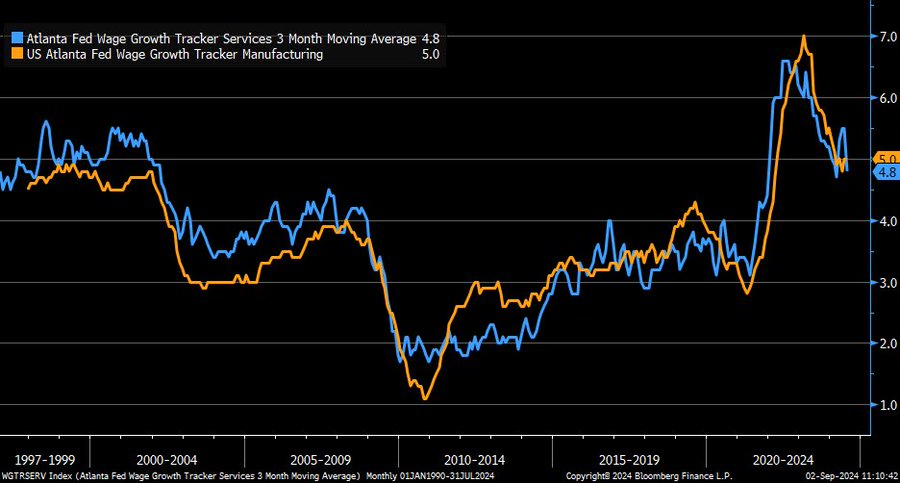
In order to afford general living expenses, consumers are turning to credit cards at a rapid pace. “More of our customers are resorting to credit cards for basic household needs and approximately 30% have at least one credit card that has reached its limit. See our latest survey, 25% of our customers surveyed noted they anticipated missing a bill payment in the next six months.” -Dollar General, CEO August 29, 2024.
Personal interest payments have crossed $500 billion
- Current levels have NEVER been seen since 1959
- This sets the stage for rapid consumer weakening
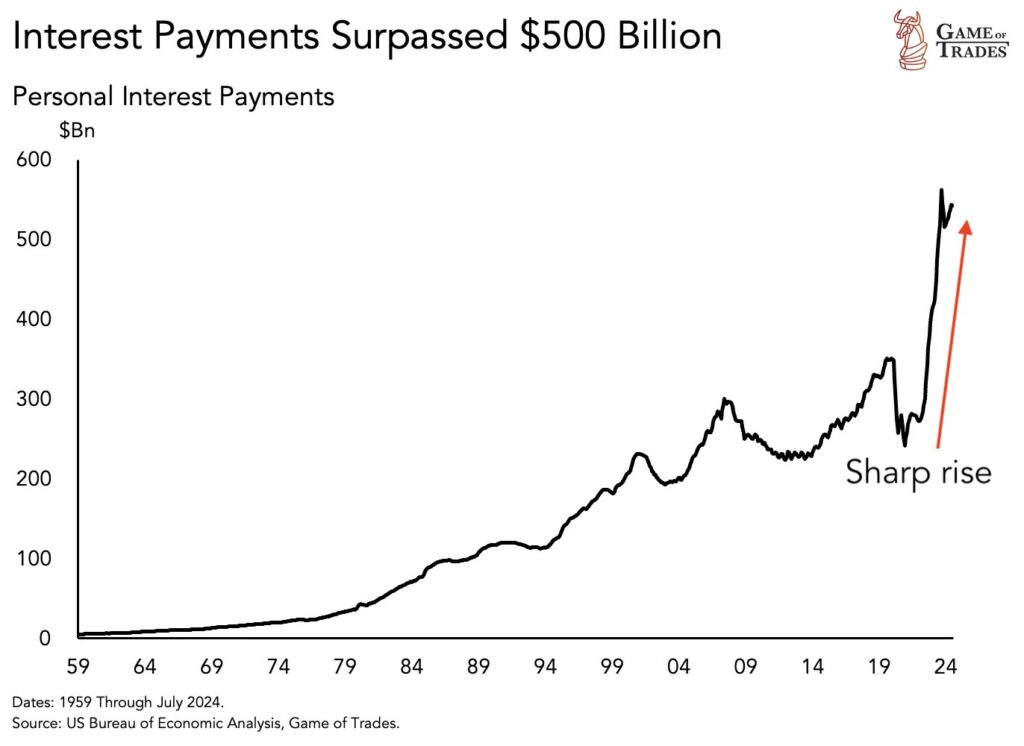
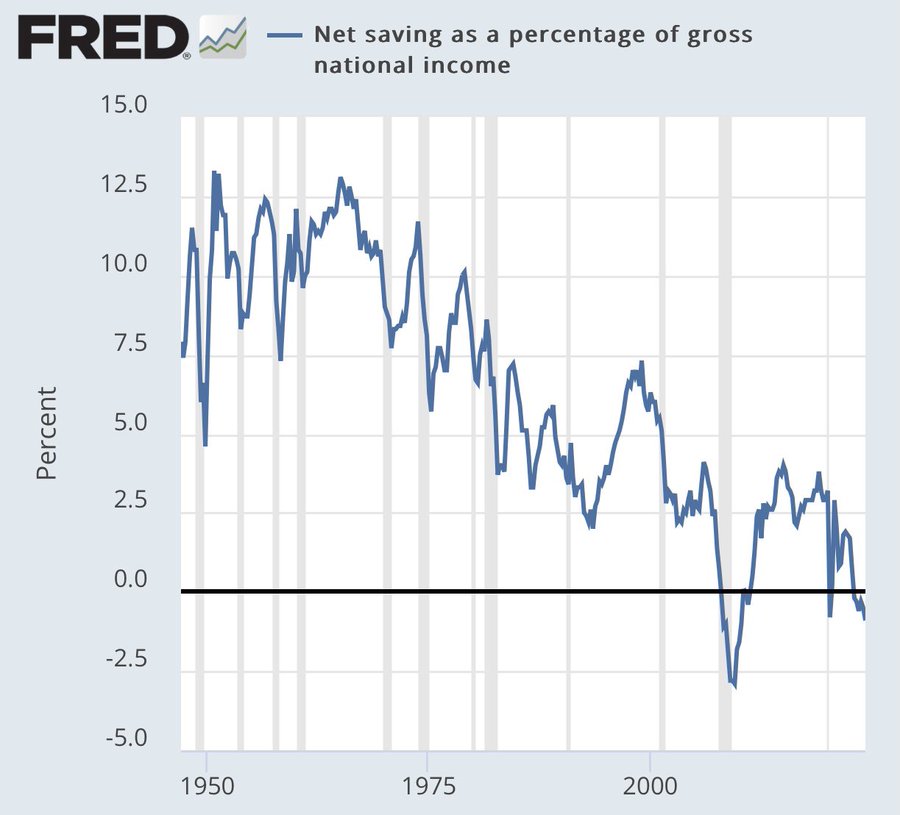
The turn to credit is only going to get worse as US net saving falls further, which is currently -.9% of gross national income. The two time frames between interest payments and savings are helping to highlight, which direction we are heading.
When you put these different variables together, you can see the huge surge in consumer credit.
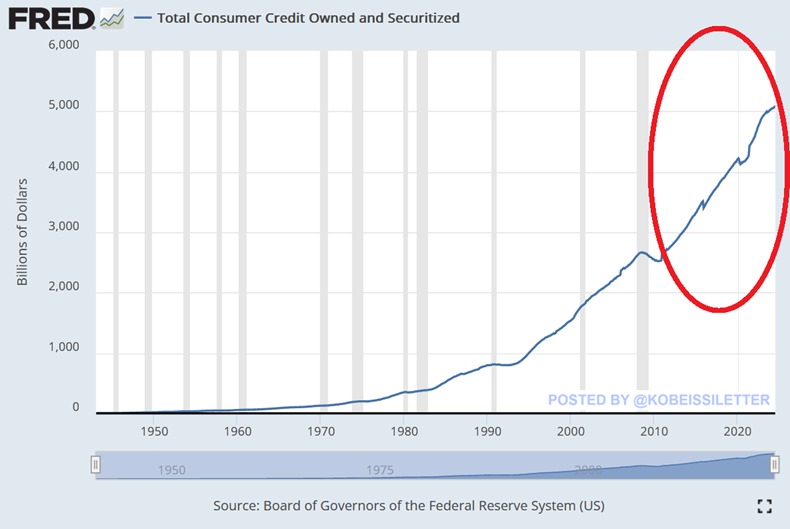
Total consumer credit jumped by $25.5 billion in July and reached a new all-time high of $5.1 trillion.
- This marked the largest jump since November 2022 and the 11th straight monthly increase.
- Total consumer debt has DOUBLED in 14 years.
- Revolving debt, which includes credit cards, jumped by $10.6 billion and also hit a new record of $1.4 trillion.
- Non-revolving credit rose by $14.8 billion and is just $2 billion below the January peak of $3.73 trillion.
- Meanwhile, the share of credit card debt delinquencies soared to 9.1%, the highest level in 12 years. The debt mountain is collapsing.
It isn’t surprising to see credit card defaults hit a record with more pain coming across the board.

From 1940s to 1970s, Americans used to save around 10% of their annual income But today, savings relative to income has entered contraction territory People are now spending more than they earn.

This increase caused credit card debt to climb aggressively Which has now crossed $1 trillion → the highest level EVER.

This situation is worsened by record-high credit card interest rates of 21.51% The cost of carrying debt today is nearly 2x what it was just a few years ago.

As a result, defaults have started to climb rapidly and is showing no signs of stopping In fact, small lenders are facing record high credit card defaults Crossing even the Dot Com bubble & Financial Crisis peaks.

The credit defaults are going to cause even more problems for banks that are sitting on huge unrealized losses. This will only get worse as real estate weakens further, especially commercial real estate. Q2 marks the 11th STRAIGHT quarter of unrealized losses on investment securities for banks, a streak never seen before. The number of banks on the FDIC Problem Bank List increased to 66 and represents 1.5% of total. In total, US banks unrealized losses hit $512.9B in Q2 2024.
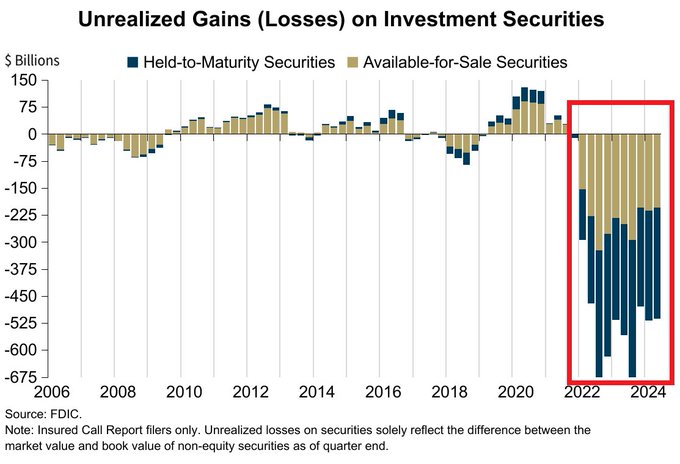
It’s important to understand that this doesn’t even include derivatives that could easily make those losses explode in multi-trillion levels.
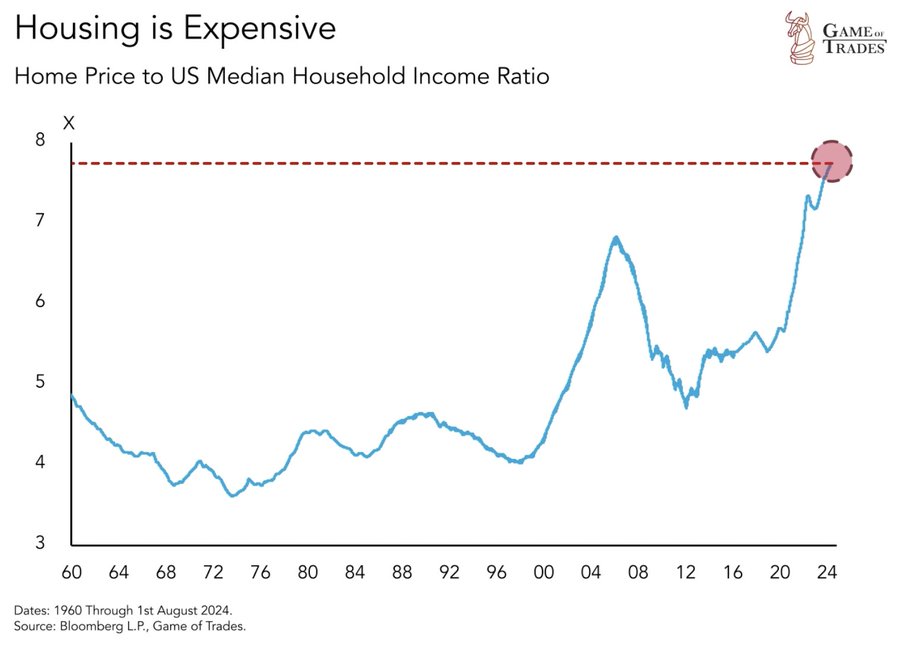
As the consumer struggles and asset prices continue higher, home prices relative to median income is now at the highest level ever seen. The actions taken by the Fed today will only drive those costs higher as asset prices will likely move higher because of these actions.
The Fed pivot is going to bring comfort, especially when you consider where we sit with inflation and a massive fiscal overspend. There are two ways to stimulate the economy: fiscal and monetary policy. The U.S. government has been spending like a drunken sailor on shore leave for over a decade now supported by ZIRP and loose monetary policy. The party is coming to an end- regardless of if they stop spending or not. It’s difficult to make tough choices, but the sooner we make hard decisions- the better off we will be. Unfortunately, the Fed and U.S. government are running full steam off the cliff of the Law of Diminishing Returns, and at this point only the Invisible Hand can stop what’s coming.
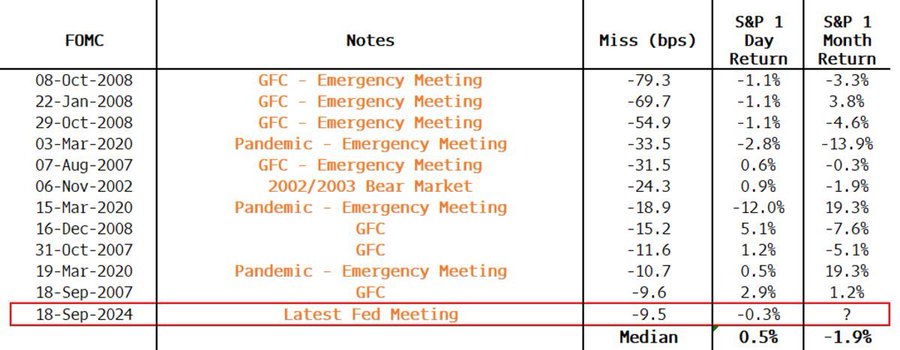
Here is another interesting chart: “To contextualize, the Fed surprise to markets yesterday was the biggest downside shock in rates markets seen outside of major crises in at least 20 years.”
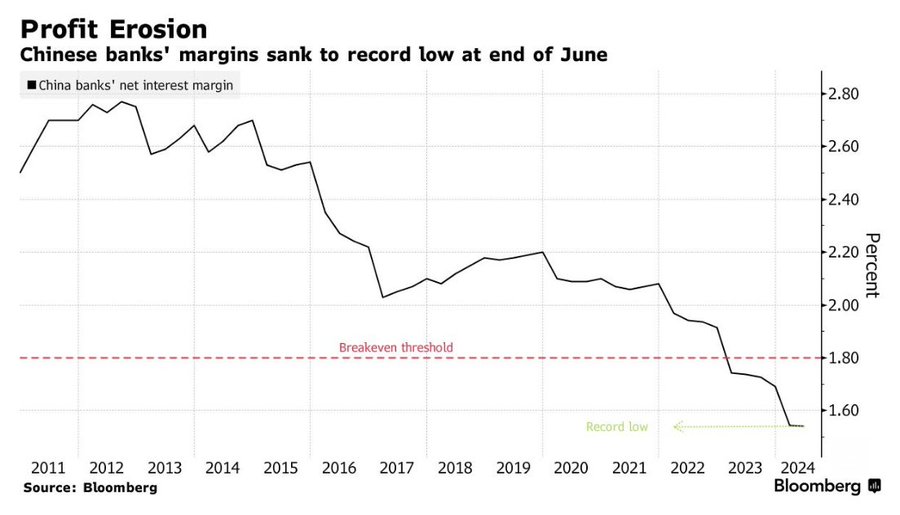
China isn’t in a better position when you look at the recent economic data that was released. Here is a great summary of the recent data points: “”China’s economy is running out of steam,” Tommy Wu, senior economist at Commerzbank Research, writes in a note. August economic data, including slowing growth for industrial production, retail sales and manufacturing investment, suggests that overall economic growth in 3Q is slowing after a modest 2Q, Wu says. It seems increasingly possible for China to miss its 5% growth target for 2024, and the government will “need to step on the stimulus pedal harder” to support the demand side to boost growth, Wu adds. “Exports is now the only bright spot,” Wu says, but notes headwinds are strong given coming higher tariffs against Chinese products like EVs and steel.” I think investors are underestimating the issues across the board when it comes to the Chinese economy. There are very few places that are showing any meaningful increases with banks showing even more pressure:
The only bright spot that existed to date has now slowed considerably, making the 5% nearly impossible to hit. Chinese prices decline for the 5th straight quarter, the longest stretch of declines since 1999
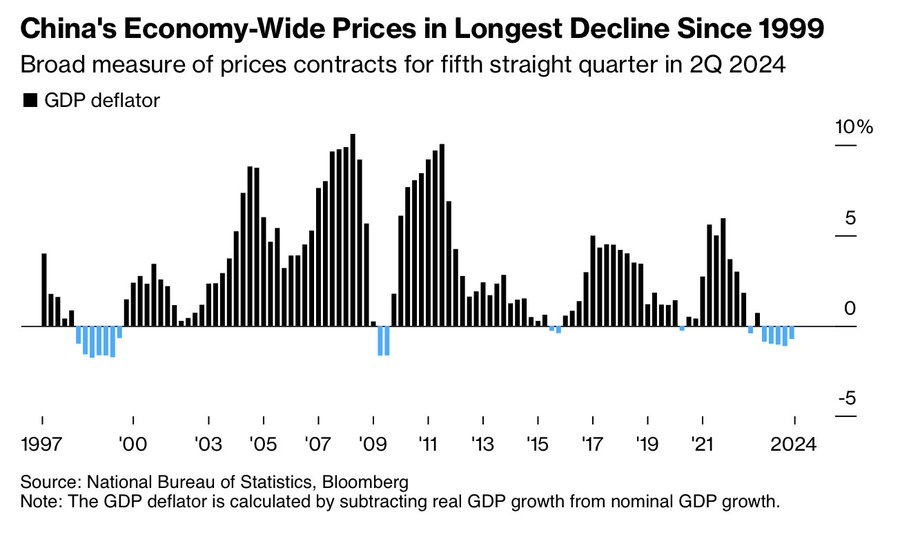
The recent data has increased the calls for massive stimulus, but ignores the fact that China has been utilizing broad monetary and fiscal stimulus since 2009. It’s going to be near impossible to increase support and generate growth given the Law of Diminishing Returns.
- Retail sales rose by 2.1% in August from a year ago, missing expectations of 2.5% growth among economists polled by Reuters. That was also slower than the 2.7% increase in July.
- Industrial production rose by 4.5% in August from a year ago, lagging the 4.8% growth forecast by Reuters. That also marked a slowdown from a 5.1% rise in July.
- Fixed asset investment rose by 3.4% for the January to August period, slower than the forecast of 3.5% growth.[5]
There’s been a targeted push to try to increase domestic spending, but the balance of this release showed little progress: “Despite the miss, industrial production still grew faster than retail sales, “reflecting the structural imbalance imbedded in China’s economy, with stronger supply and weaker demand,” said Darius Tang, associate director, corporates, at Fitch Bohua.”[6] The main growth driver has been fixed asset investment, infrastructure, and manufacturing, but these have seen a meaningful shift lower. “Among fixed asset investment, infrastructure and manufacturing slowed in growth on a year-to-date basis in August, compared to July. Investment in real estate fell by 10.2% for the year through August, the same pace of decline as of July.”


Retail sales are the biggest concern as local demand has been very weak when looking at prices in the market and general demand. The consumer has always been a point of concern, but the real estate crisis in the country impacts people’s financials in a big way. The below charts show there’s been very little improvement, and things have only gotten worse throughout 2024. The pressure at the banking level (as talked about previously) is only compounded by the decline in underlying asset prices and collateral.


When we look at it from a year over year perspective, you can see the trend has consistently been in negative territory.


Property sales put into perspective the pace of the slowdown- especially when you look at it against the 2015-2023 averages.

The concerns about the economy have caused a sizeable decline in investment both from internal capital as well as external investment (FDI). Chinese real estate was a hot commodity for over a decade, but you can see just how rapid the decline has been throughout the year. This also comes on the back of significant stimulus and rate cuts to support housing and real estate investment.

It’s not surprising to see the big pivot in FDI (Foreign Direct Investment) as capital investments pull out of China and into other areas.

Bank loans and credit impulses are showing how systemic the issues are, and the fact that the problems are far from over. The pace of the slowdown has only gotten much worse as we progressed through the year, which isn’t surprising as China’s exports struggle from a global slowdown. The pace of the economic slowdown has accelerated, which many exporting companies within China are seeing directly. This is causing many of them to look to reduce leverage and avoid new debt. The pace of the loans also highlight limited CAPEX spending and a broad hesitancy to make additional investments.

I’ve said for years that the PboC wanted to track as close to 0 as possible for the credit impulses. They have since slowed down further, and not because of their choosing. Instead, the market has caused a bigger reduction, and even as the PboC has tried to increase liquidity- they’ve been unable to accelerated borrowing and spending.

The biggest drivers of these slowdowns have been smaller, private corporations as well as consumers. The local consumer has seen a huge drop in new loans and underlying borrowing. I’ve stated countless times that the consumer in China (similar to the U.S.) is massively overlevered. The leverage ratios only got worse as real estate weakened and underlying asset pricing diminished.

Loan quantities to financial institutions have also dropped as banks attempt to adjust their leverage to account for weak asset pricing.

The only support is coming from the increase in government debt issuance, but as we’ve discussed in the past- SPB (Special Purpose Bonds) and local government infrastructure projects are yielding steeply negative growth (multiplier effects). These bonds will be long term drains on resources because the underlying projects aren’t generating enough revenue to cover principal and interest.


The velocity of money has shifted much lower with all these pressure points, and there isn’t a level of stimulus from the PboC that could change this direction.


The two largest economies in the world are succumbing to the Law of Diminishing returns as debt to GDP levels remain at all-time highs and rising. As the yield curve continues to steepen in the U.S., we are going to see a 10yr that will move back to 4% and shorter duration will all drift higher. The longer duration yield will rise “faster,” but the whole yield curve is going to shift higher.
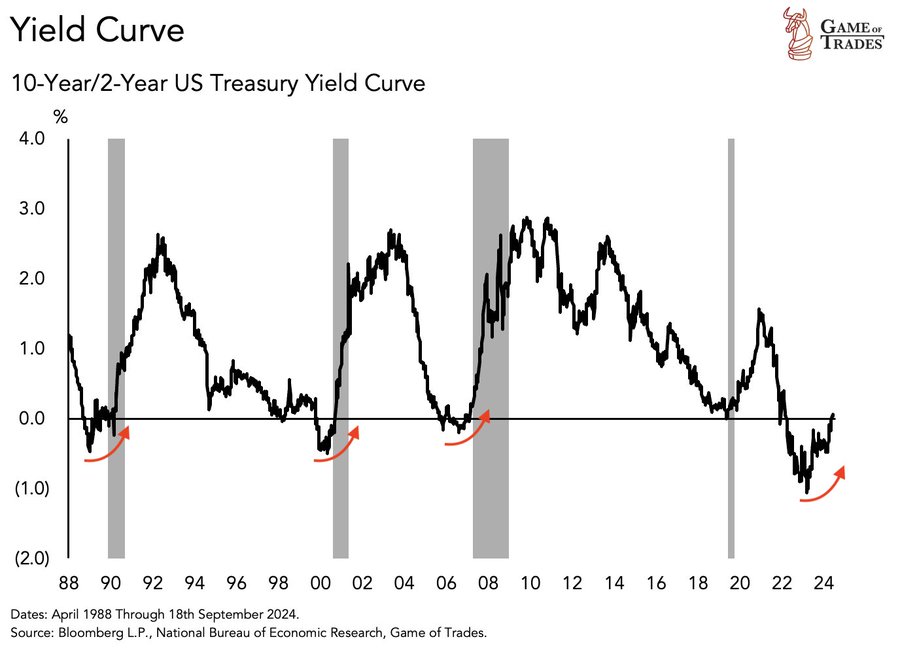
For example- as the 10 year makes its way back to over 4%- the 2yr will rise as well. In previous cycles- as the 10 yr rises- the 2yr falls or stays flat (at the least). The shift is real here- and Yellen only made it SOOOO much worse because she shortened the duration of our debt by a wide margin. This provided a near term “pop” in liquidity but also shortened our duration and increased the “maturity wall” to levels that are just crazy.
GDP growth in the U.S. has been driven by inflation, government spending, and consumer credit that has been tapped out. The consumer has started pulling back as government spending leads to larger deficits and stimies growth further. China is in a similar boat as the consumer pulls back further and exports slow driving down growth. Debt levered against infrastructure and fixed assets have reach a point of “negative utils,” and is becoming a bigger drain on underlying growth.
In total, the global economy is in for a bumpy 2025 with more downside pressure from the two largest economies in the world.
- https://www.bloomberg.com/news/articles/2024-09-17/two-sinochem-oil-refineries-declared-bankrupt-as-margins-plunge
- https://www.xm.com/research/markets/allNews/reuters/china-issues-9-mln-tons-of-new-fuel-export-quotas-for-2024-commodities-consultancies-say-53929606
- https://www.xm.com/research/markets/allNews/reuters/china-issues-9-mln-tons-of-new-fuel-export-quotas-for-2024-commodities-consultancies-say-53929606
- https://www.argusmedia.com/en/news-and-insights/latest-market-news/2608010-libya-still-exporting-crude-despite-blockade
- https://www.cnbc.com/2024/09/14/china-retail-sales-industrial-data-miss-expectations-august.html
- https://www.cnbc.com/2024/09/14/china-retail-sales-industrial-data-miss-expectations-august.html

