Primary Vision
  • HOME
  • ABOUT US
    • ABOUT US
    • PRIMARY VISION AI INNOVATIONS
  • RESEARCH
    • INSIGHTS & ARTICLES
    • FREE ARTICLES
  • EVENTS
  • PRESS
  • SUPPORT
  • FAQ
  • LATEST NEWS
  • LOGIN
  • SIGN UP!
    • FRAC SPREAD COUNT SIGN-UP!
    • ENTERPRISE SUBSCRIPTION PLAN SIGN UP!
  • HOME
  • ABOUT US
    • ABOUT US
    • PRIMARY VISION AI INNOVATIONS
  • RESEARCH
    • INSIGHTS & ARTICLES
    • FREE ARTICLES
  • EVENTS
  • PRESS
  • SUPPORT
  • FAQ
  • LATEST NEWS
  • LOGIN
  • SIGN UP!
    • FRAC SPREAD COUNT SIGN-UP!
    • ENTERPRISE SUBSCRIPTION PLAN SIGN UP!
No Result
View All Result
Primary Vision
Home Market Trends

Monday Macro View: What is the Frac Spread Count telling us about jobs in oil and gas industry?

Osama Rizvi by Osama Rizvi
January 19, 2025
in Market Trends
0
Monday Macro View: What is the Frac Spread Count telling us about jobs in oil and gas industry?

The U.S. oil and gas industry continues to evolve, with efficiency and adaptation at its core. A key metric that offers real-time insights into the sector’s health is the Frac Spread Count (FSC).

This week’s FSC data highlights the ongoing challenges facing the industry, with the current count at 188, reflecting a week-over-week decline of 7 spreads and a year-over-year drop of 47. These numbers tell a deeper story about the fracking industry’s transformation, where operational efficiency and technology take precedence over expansion. Interestingly, while the FSC has declined, the Frac Job Count (FJC) tells a slightly different story. The FJC has risen by 8 week-over-week, reaching a total of 205 jobs. This divergence between FSC and FJC illustrates the industry’s growing efficiency. Operators are completing more jobs with fewer spreads, reflecting the widespread adoption of high-horsepower fleets, automation, and optimized resource allocation. This development underscores the industry’s ability to maintain productivity and maximize output, even as the overall number of active spreads decreases.

The impacts reverberate across the economy and can be most observed in the oil and gas job sector as fewer skilled workers are entering the oil and gas industry. As fracking operations become more automated, the need for traditional field labor diminishes, but the demand for specialized roles, such as data analysts and automation engineers, grows. This mismatch complicates workforce planning for an industry that must navigate both technological shifts and an aging workforce. The FSC data mirrors these challenges by illustrating how the industry is optimizing current resources rather than expanding activity. This is quite an opposite trend to what happened in the start of U.s. fracking boom where the industry doubled in size in 10 years. Fast forward 2024, rig count has fallen by 28% but the oil production has still risen. Many of the small companies struggle to compete with larger players who have the scale and resources to invest in automation and high-horsepower fleets.

Source: New York Times

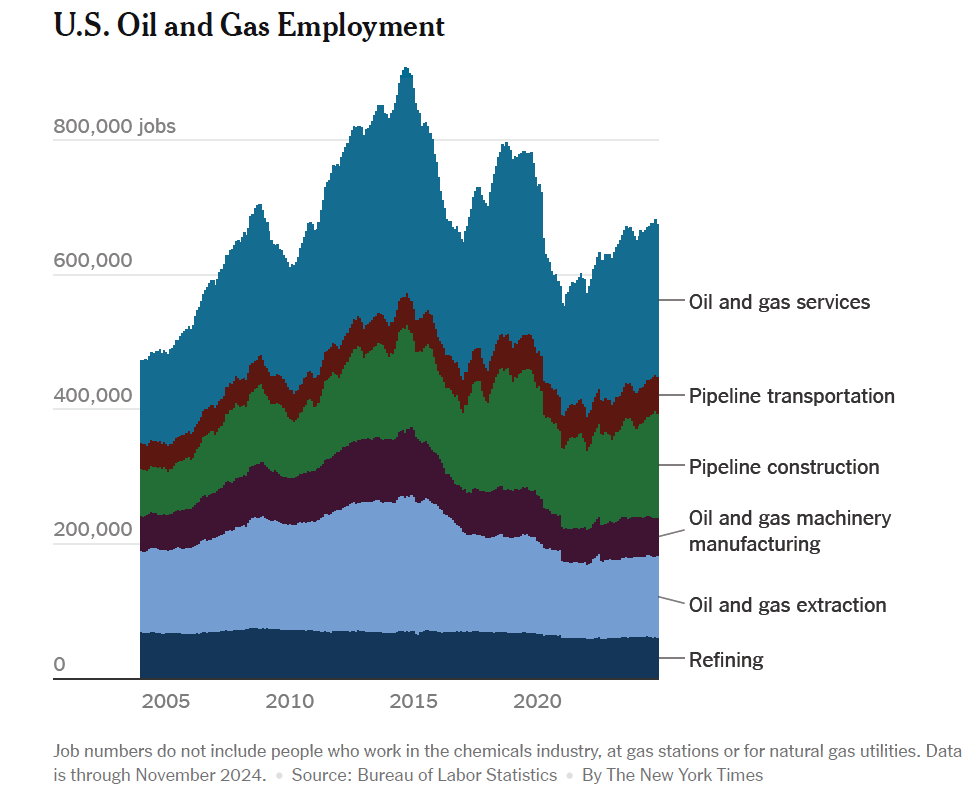
The FSC data reflects this dynamic, with fewer active spreads indicative of ongoing consolidation in the market. Smaller operators, unable to sustain high operating costs or match the efficiency gains of larger peers, are exiting the market or merging with bigger firms. This consolidation reduces overall industry employment opportunities, further contributing to the workforce contraction. According to a recent analysis, oil and gas sector now employs 25% less workforce and with spending expected to fall by 3% in North America, further job losses might incur.

The broader implications of these trends extend beyond employment. As the industry becomes more efficient, the connection between high oil and gas prices and increased labor demand is weakening. Operators now prioritize sustainable output growth over rapid expansion, leveraging technology to balance profitability with market uncertainty. The FSC data, with its steady decline, illustrates how this philosophy has taken hold across the sector.

The Frac Spread Count data and research into the trends of oil and gas employment reveals a rapidly evolving industry where efficiency and technology dominate. The FSC captures the operational reality of a sector increasingly defined by doing more with less. While this transformation has reduced labor demand, it underscores the critical importance of innovation in maintaining production levels amid economic and environmental pressures. The industry’s ability to adapt will define its trajectory, but the gap between technological progress and workforce dynamics will remain a challenge for years to come.


Previous Post

SLB: Q4 TAKE THREE

Next Post

Market Sentiment Tracker: China meets its growth target

Related Posts

SLB’s Perspective in Q1: KEY Takeaways
Market Trends

SLB’s Perspective in Q1: KEY Takeaways

June 6, 2025
Market Sentiment Tracker: Is the U.S. Economy Quietly Rebounding?
Market Trends

Market Sentiment Tracker: Is the U.S. Economy Quietly Rebounding?

June 3, 2025
Monday Macro View: Electric Fleets Keep Expanding, Even as Completions Slow
Market Trends

Monday Macro View: Electric Fleets Keep Expanding, Even as Completions Slow

June 2, 2025
Patterson UTI’s Perspective in Q1: KEY Takeaways
Market Trends

Patterson UTI’s Perspective in Q1: KEY Takeaways

June 2, 2025
Market Sentiment Tracker: Credit Card Delinquencies Hit 14-Year High
Market Trends

Market Sentiment Tracker: Credit Card Delinquencies Hit 14-Year High

May 27, 2025
Monday Macro View: Is U.S. Shale Activity About to Slow Down
Market Trends

Monday Macro View: Is U.S. Shale Activity About to Slow Down

May 26, 2025
Next Post
Market Sentiment Tracker: China meets its growth target

Market Sentiment Tracker: China meets its growth target

Please login to join discussion

Recent News

SLB’s Perspective in Q1: KEY Takeaways

SLB’s Perspective in Q1: KEY Takeaways

June 6, 2025
Market Sentiment Tracker: Is the U.S. Economy Quietly Rebounding?

Market Sentiment Tracker: Is the U.S. Economy Quietly Rebounding?

June 3, 2025
Monday Macro View: Electric Fleets Keep Expanding, Even as Completions Slow

Monday Macro View: Electric Fleets Keep Expanding, Even as Completions Slow

June 2, 2025
Patterson UTI’s Perspective in Q1: KEY Takeaways

Patterson UTI’s Perspective in Q1: KEY Takeaways

June 2, 2025
Market Sentiment Tracker: Credit Card Delinquencies Hit 14-Year High

Market Sentiment Tracker: Credit Card Delinquencies Hit 14-Year High

May 27, 2025
Primary Vision

Established in 2011, we are renowned for our expert frac data and analytics, providing a rich array of unique indicators and industry commentary.

CONTACT

+1-713-554-4977
info@primaryvision.co

SOCIAL NETWORKS

POLICIES

Privacy Policy
Terms of Use

PARTNERS

Amazon Web Services

TRUSTED SITES

Logo

Logo

RECENT NEWS

SLB’s Perspective in Q1: KEY Takeaways

SLB’s Perspective in Q1: KEY Takeaways

June 6, 2025
Market Sentiment Tracker: Is the U.S. Economy Quietly Rebounding?

Market Sentiment Tracker: Is the U.S. Economy Quietly Rebounding?

June 3, 2025
Monday Macro View: Electric Fleets Keep Expanding, Even as Completions Slow

Monday Macro View: Electric Fleets Keep Expanding, Even as Completions Slow

June 2, 2025
Patterson UTI’s Perspective in Q1: KEY Takeaways

Patterson UTI’s Perspective in Q1: KEY Takeaways

June 2, 2025
Market Sentiment Tracker: Credit Card Delinquencies Hit 14-Year High

Market Sentiment Tracker: Credit Card Delinquencies Hit 14-Year High

May 27, 2025
  • HOME
  • ABOUT US
  • RESEARCH
  • EVENTS
  • PRESS
  • SUPPORT
  • FAQ
  • LATEST NEWS
  • LOGIN
  • SIGN UP!

© 2025 Primary Vision. All rights reserved.

  • HOME
  • ABOUT US
    • ABOUT US
    • PRIMARY VISION AI INNOVATIONS
  • RESEARCH
    • INSIGHTS & ARTICLES
    • FREE ARTICLES
  • EVENTS
  • PRESS
  • SUPPORT
  • FAQ
  • LATEST NEWS
  • LOGIN
  • SIGN UP!
    • FRAC SPREAD COUNT SIGN-UP!
    • ENTERPRISE SUBSCRIPTION PLAN SIGN UP!

© 2025 Primary Vision. All rights reserved.