

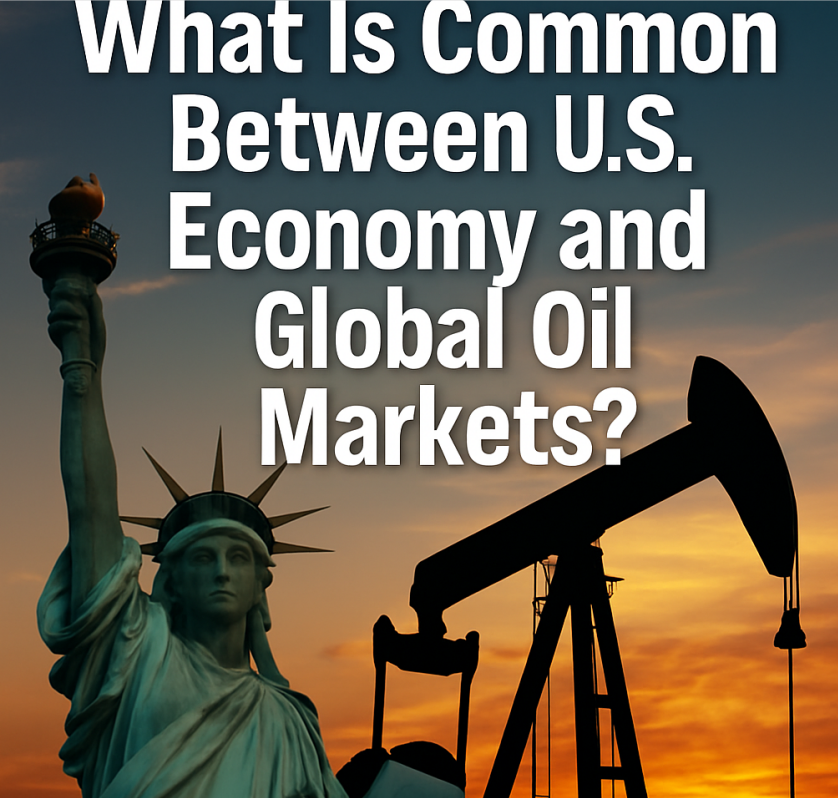
The U.S. economy and the oil market share a similar trait: both look sturdier on the surface than they are beneath. Headline GDP growth and job reports have echoed the same kind of resilience that Brent and WTI prices have shown in recent months. But just as oil’s apparent stability has leaned on China’s stockpiling and diesel margins rather than broad-based demand, the American economy’s strength has rested on debt-driven consumption, narrow sectoral growth, and the wealth effect of surging equities. In both cases, the cracks are there — they are only waiting for the lag to catch up.
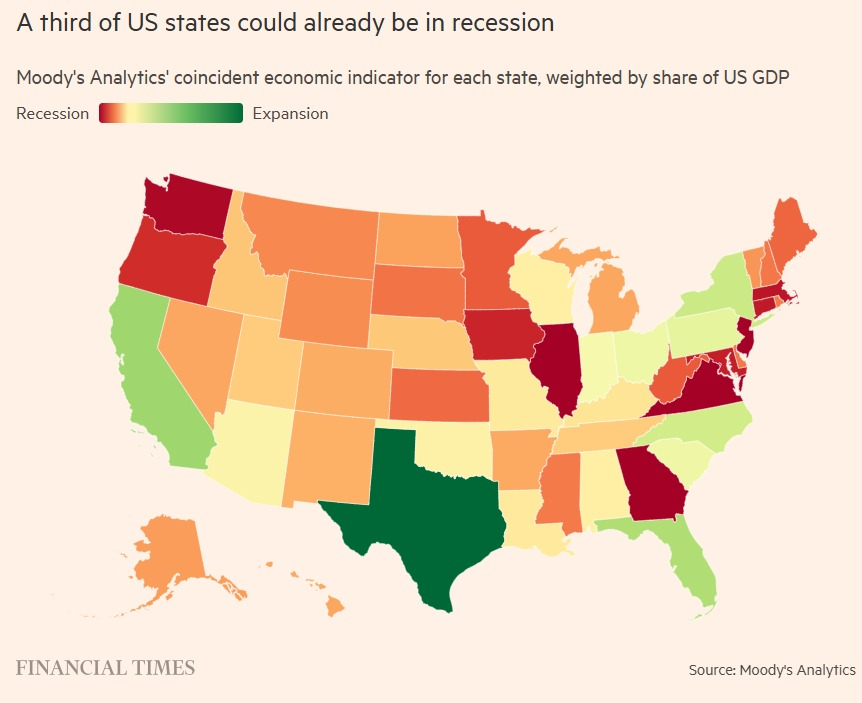
Mark Zandi of Moody’s Analytics points out that California, Texas, and New York—together accounting for nearly one-third of the nation’s GDP—are already in, or close to, recession territory. California’s economy alone, at around $4.1 trillion, represents about 14 percent of U.S. GDP; Texas adds $2.7 trillion (roughly 9 percent); New York contributes $2.3 trillion (about 8 percent). Meanwhile, construction, manufacturing, and agriculture are contracting, while healthcare and AI-linked investment are holding the national numbers up. The August jobs report showed just 22,000 new positions, almost all in healthcare, and the Bureau of Labor Statistics’ payroll diffusion index slipped below 50 — a threshold rarely crossed outside of downturns. Economists at the University of California, Santa Cruz, even estimate a 71% probability that the U.S. was already in recession by May, despite the Q2 GDP bounce.
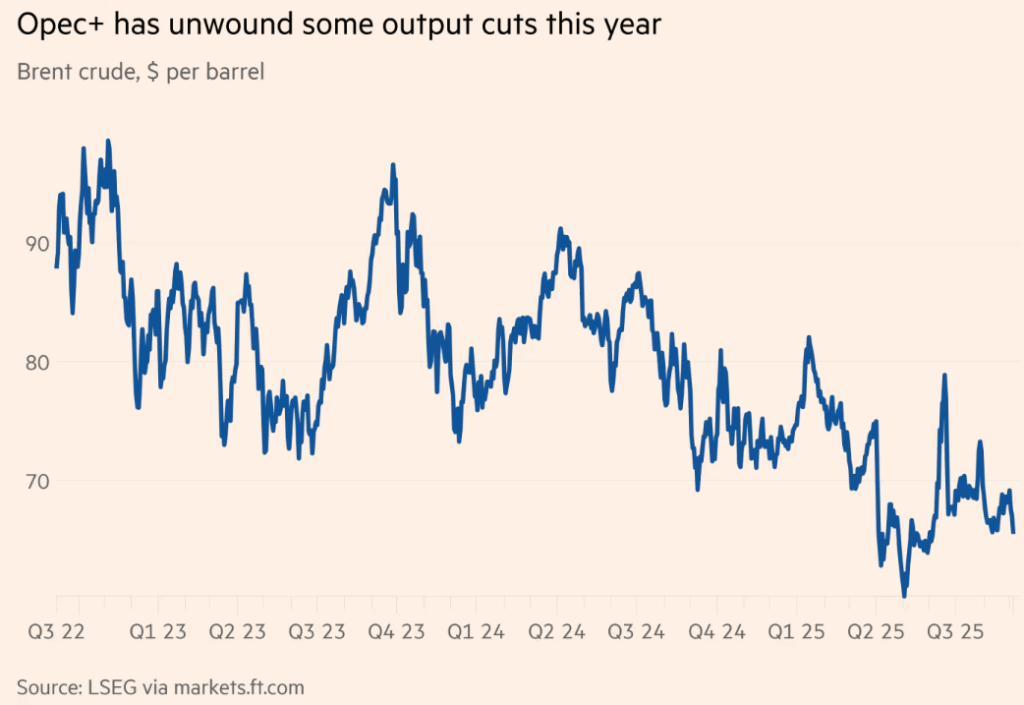
Oil markets, too, illustrate the gap between appearances and underlying reality. At its September 7 virtual meeting, OPEC+ agreed to raise its production ceiling by 137,000 barrels-per-day (bpd) starting in October—well below the large monthly hikes seen earlier this summer and signaling a gradual unwinding of an additional voluntary cut of 1.65 million bpd. In August, actual OPEC output rose—driven mainly by Saudi Arabia and the UAE—but the increase of about 310,000 bpd fell short of the 416,000 bpd that had been allocated, highlighting persistent gaps between quotas and reality.
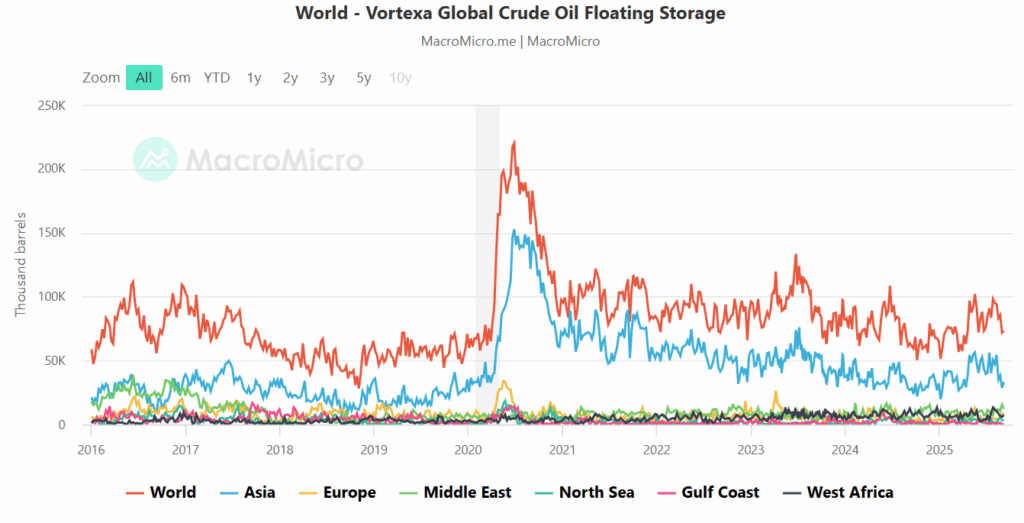
Demand, however, is slowing. The IEA projects only 0.7 million bpd of demand growth in 2025 — the weakest since before the financial crisis, excluding the Covid slump. The EIA pegs growth at roughly 1.0 million, and OPEC at 1.3 million. Even those numbers look optimistic when set against weaker factory activity in Asia and swelling inventories. The IEA notes that oil-on-water has risen sharply, with cargoes piling up in non-OECD storage and Chinese tanks.
There are other signs that also hint towards further turbulence in the oi markets. Saudi Arabia has recently lowered their OSPs. Ed Hayden-Briffett, research analyst from The Officials says that “he market took the OSPs as immediately bearish but has been reassured by talk of China buying 500 kb/d for inventory. The Saudis themselves simply need to sell more barrels”. He is hinting towards a market share tussle that takes us back to 2014 – and we also know how it ended.
Prices have stayed afloat mainly because of temporary supports. China has been stockpiling at roughly 530,000 barrels per day, double its normal pace, while refining margins in diesel have added a floor. But those are narrow props, not lasting foundations. More supply from Guyana and Canada is already on the way, and OPEC’s ceilings will eventually materialize into exports. If Asia’s demand weakens further, the market could look very different in the months ahead.
The U.S. economy and oil market both stand on uneven ground: their apparent strength rests on concentrated supports. In both, the lag between surface stability and underlying stress raises the same question — how long until the cracks widen into something harder to ignore.