- Our regression model suggests a steady revenue growth in NTM 2023, but the rate can decelerate and decline over the next two years.
- The EBITDA growth rate is sharp in NTM 2023 but may decelerate in NTM 2024.
- The relative valuation indicates the stock is reasonably valued at this level.
Part 1 of this article discussed the NOV’s (NOV) outlook, performance, and financial condition. In this part, we will discuss more.
Linear Regression Based Revenue Forecast
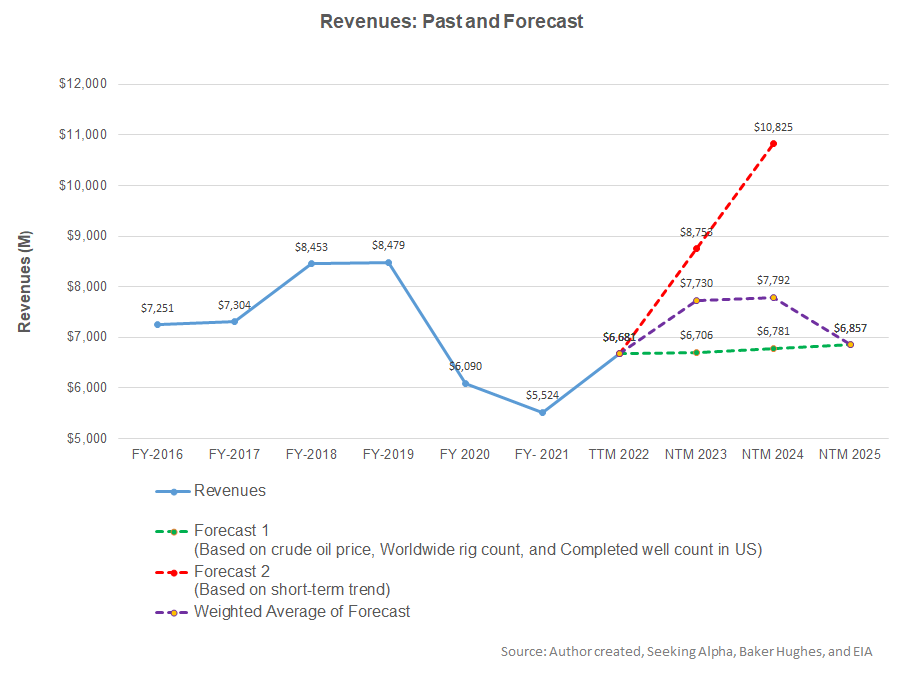
Our model is based on a regression equation between the key industry indicators (crude oil price, the aggregate rig count in the US and internationally, and the US completed well count) and NOV’s reported revenues for the past seven years and the previous four quarters. The model suggests that NOV’s revenues will increase by 16% in the next 12 months (or NTM) in 2023. The growth rate can decelerate sharply in NTM 2024 and decline by 12% in NTM 2025.
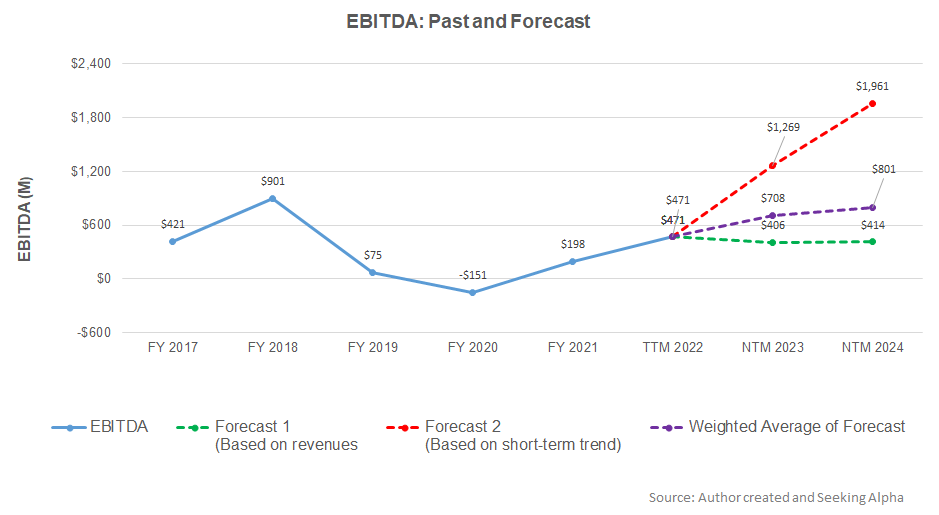
Based on the same regression models and the forecast revenues, I expect the company’s EBITDA to increase steeply (138% up) in NTM 2023. However, it will decelerate to 50% in NTM 2024.
Target Price
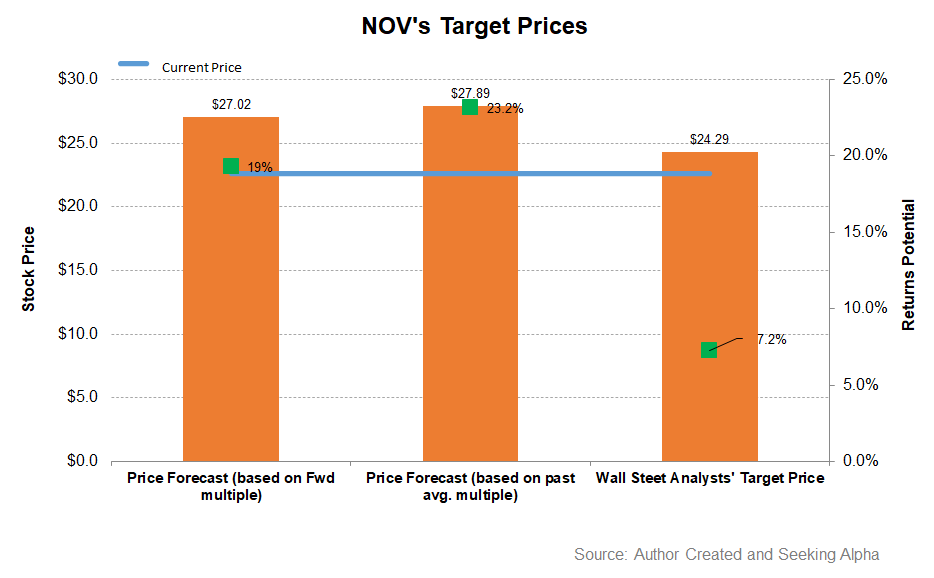
Returns potential using the forward EV/EBITDA multiple (16.0x) is lower (19% upside) than the returns potential (23% upside) using the past average EV/ EBITDA multiple (36.6x). The sell-side analysts’ expected returns (7% upside) from the stock are much lower.
What Does The Relative Valuation Imply?
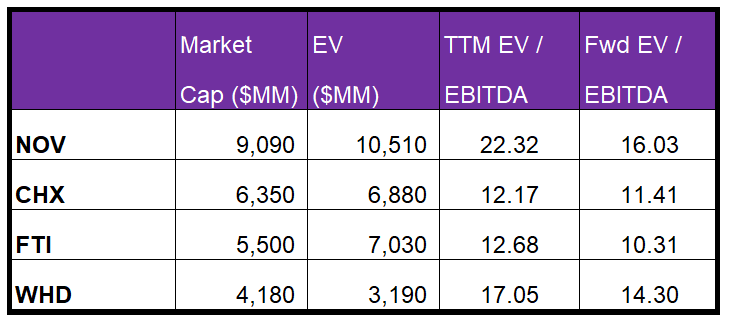
NOV’s current EV/EBITDA multiple is lower than the past five-year average EV/EBITDA multiple of 37x. So, it is currently trading at a discount to its past average.
NOV’s EV/EBITDA multiple is higher than its peers’ (CHX, FTI, and WHD) average of 14x. Because NOV’s forward EV/EBITDA multiple contraction is steeper than its peers, it typically reflects in a higher EV/EBITDA multiple than its peers. So, the stock is reasonably valued versus its peers at the current level.
Analyst Rating
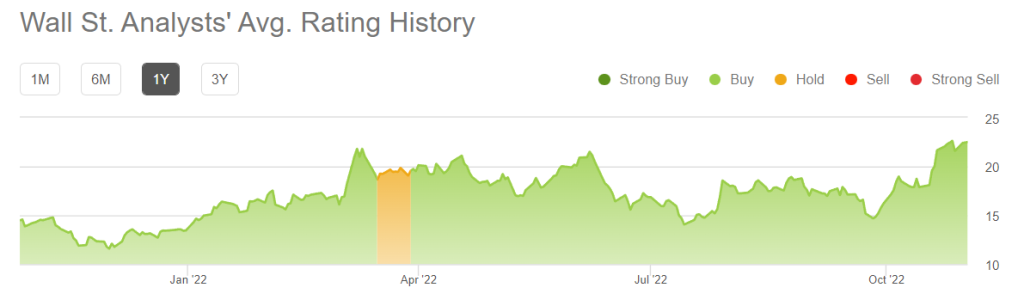
According to data provided by Seeking Alpha, 13 sell-side analysts rated NOV a “buy” in the past 90 days (including “Strong Buy”), while nine of the analysts rated it a “hold.” Only two analysts rated it a “sell.” The consensus target price is $24.3, suggesting a 7% upside at the current price.
What’s The Take On NOV?
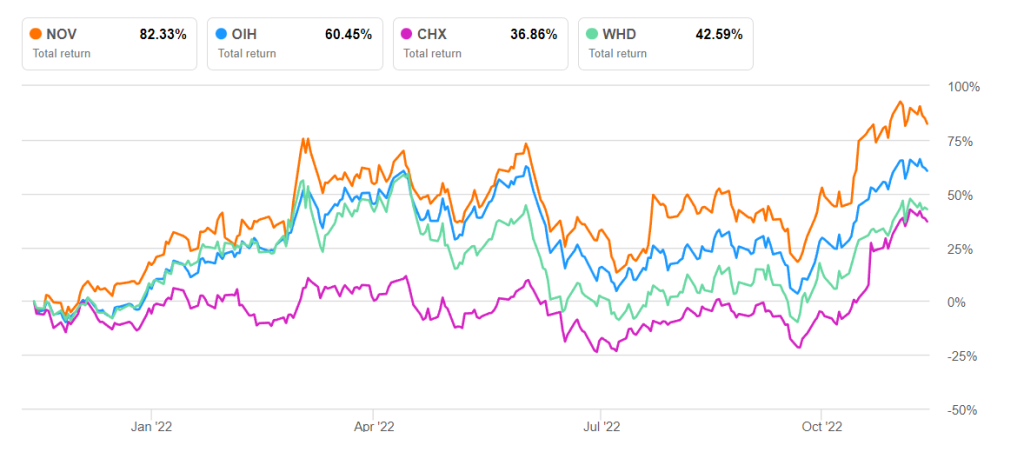
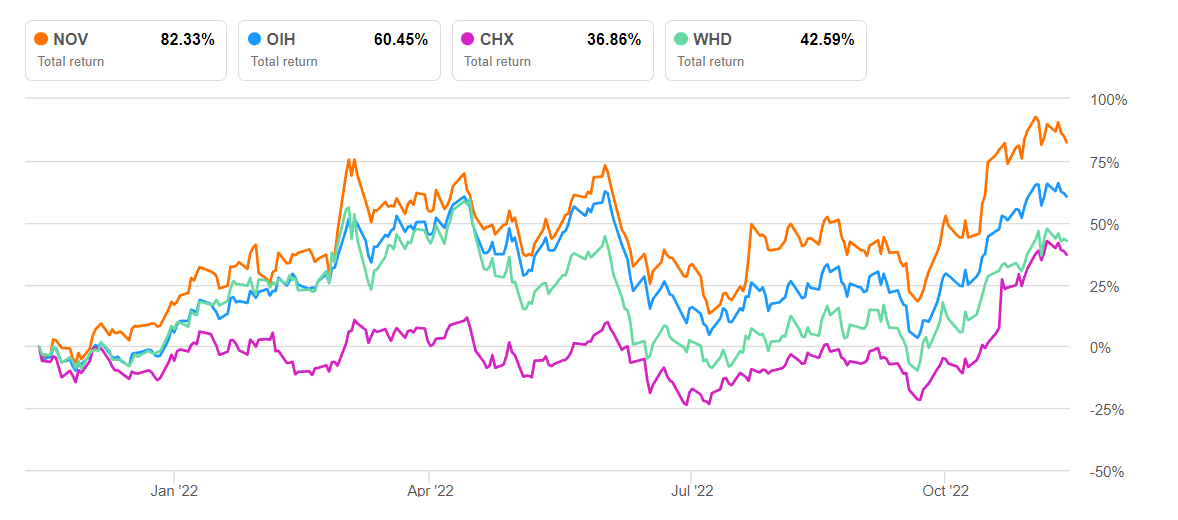
In this last phase of 2022, the oilfield services market sees rising demand in the Middle East, along with reactivation and recertification projects, pressure control upgrades, and automation projects. In this scenario, NOV primarily focuses on the downhole energy business to improve visibility for precision well placement. Outside this, it will concentrate on well safety performance and reducing greenhouse gas emissions to drive its business in the medium to long term. As the day rate in the US catches up with the benefits of the crude oil price recovery, the stock outperformed the VanEck Vectors Oil Services ETF (OIH) in the past year.
However, NOV will continue to face near-term hardships from projects being pulled forward and supply chain issues. Its cash flows were negative in 9M 2022 because working capital requirements significantly increased in the past year. The company’s robust liquidity ensures it can absorb the cash flow deficit. The stock is reasonably valued relative to its peers. Investors might want to hold it because it has the right pieces to set returns that swell in the medium to long term.


